. 2018 Dec 11;115(50):E11817-E11826.
doi: 10.1073/pnas.1810701115. Epub 2018 Nov 28.

Photoreceptive retinal ganglion cells control the information rate of the optic nerve

Affiliations

Photoreceptive retinal ganglion cells control the information rate of the optic nerve

Nina Milosavljevic et al. Proc Natl Acad Sci U S A. .

Abstract

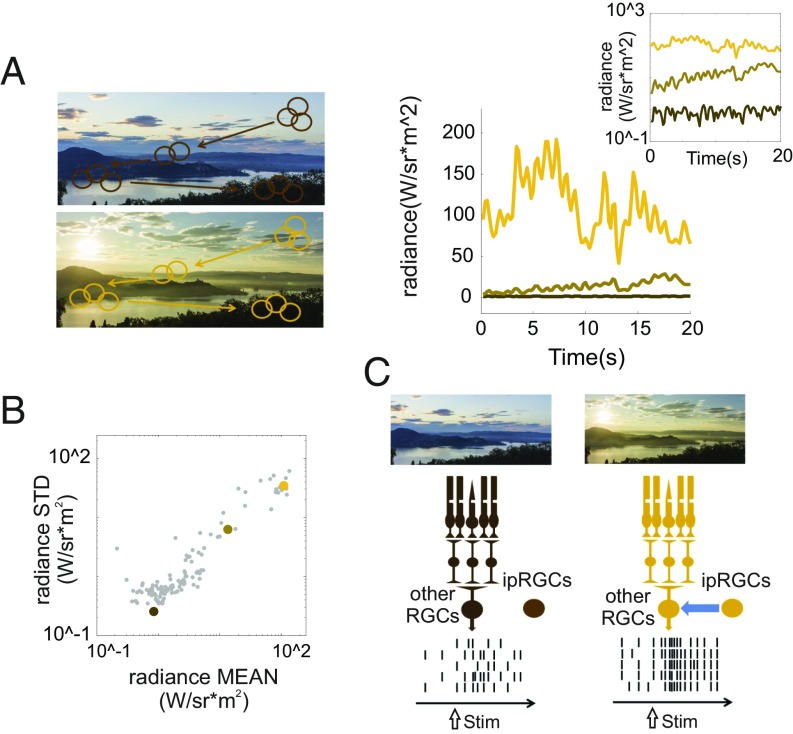
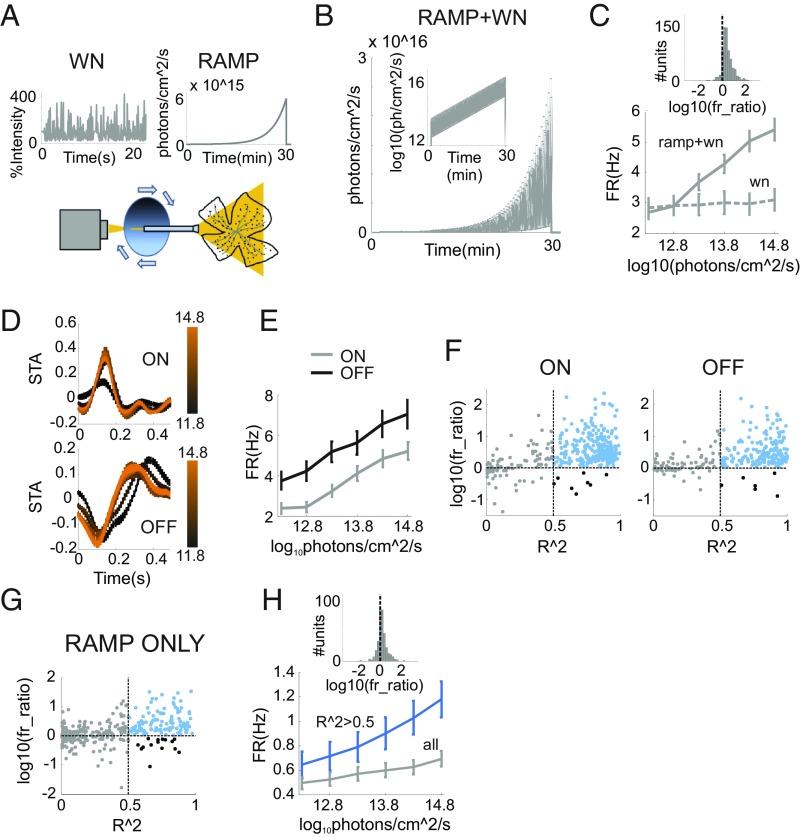
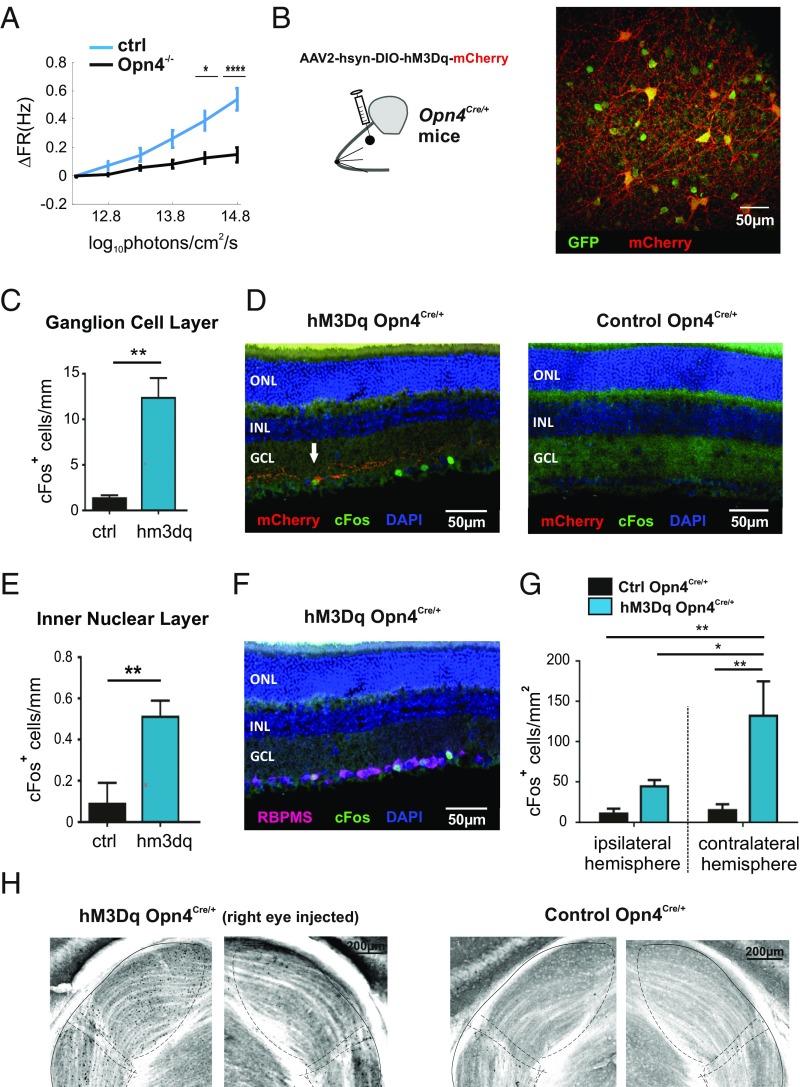
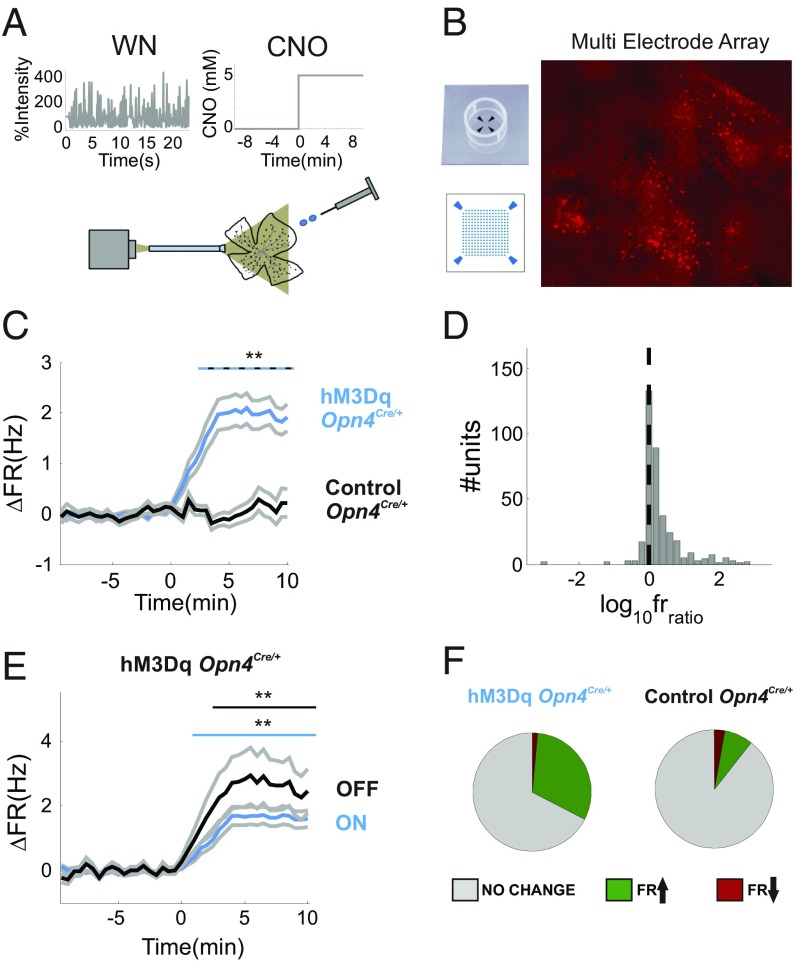
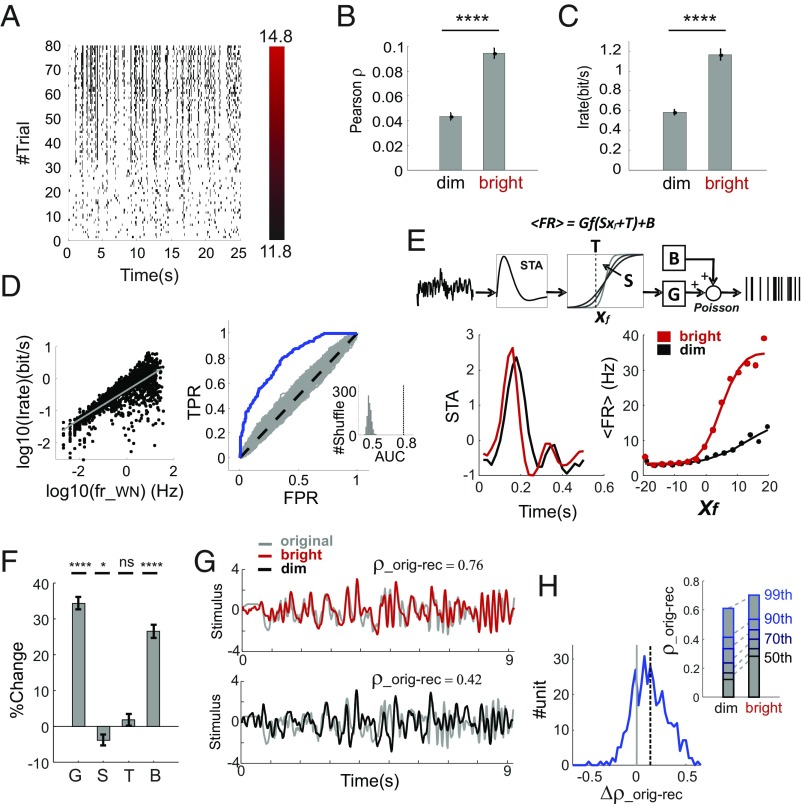
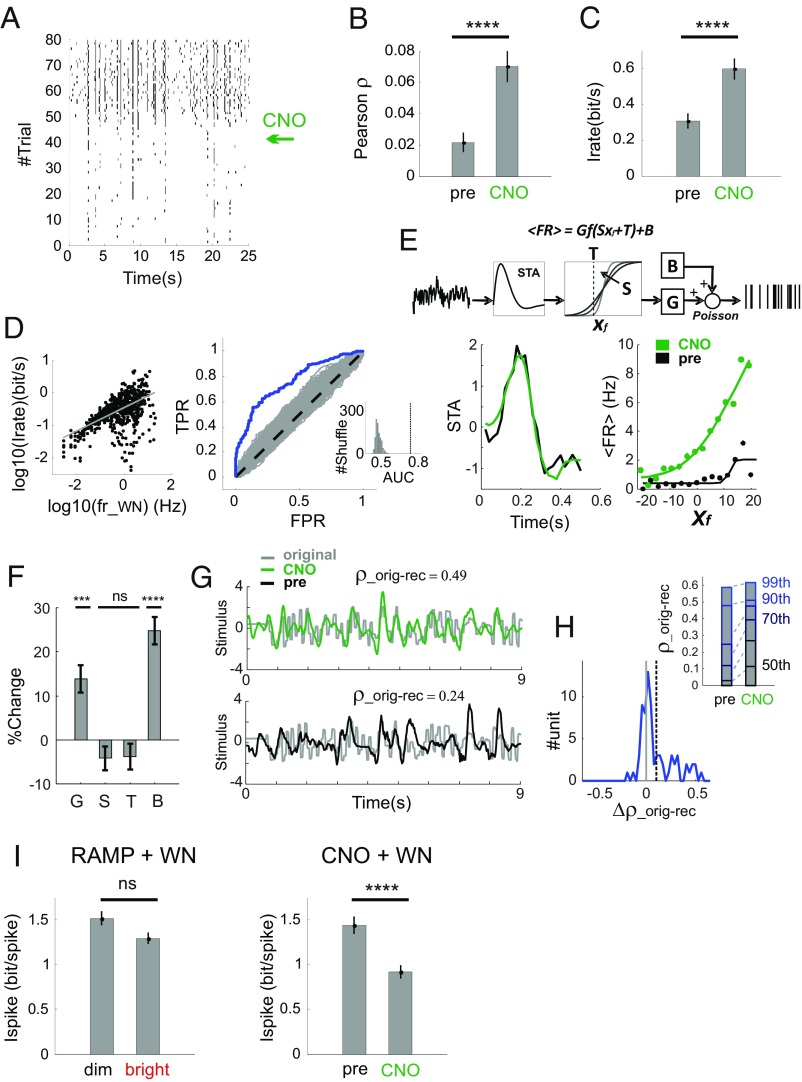
Information transfer in the brain relies upon energetically expensive spiking activity of neurons. Rates of information flow should therefore be carefully optimized, but mechanisms to control this parameter are poorly understood. We address this deficit in the visual system, where ambient light (irradiance) is predictive of the amount of information reaching the eye and ask whether a neural measure of irradiance can therefore be used to proactively control information flow along the optic nerve. We first show that firing rates for the retina's output neurons [retinal ganglion cells (RGCs)] scale with irradiance and are positively correlated with rates of information and the gain of visual responses. Irradiance modulates firing in the absence of any other visual signal confirming that this is a genuine response to changing ambient light. Irradiance-driven changes in firing are observed across the population of RGCs (including in both ON and OFF units) but are disrupted in mice lacking melanopsin [the photopigment of irradiance-coding intrinsically photosensitive RGCs (ipRGCs)] and can be induced under steady light exposure by chemogenetic activation of ipRGCs. Artificially elevating firing by chemogenetic excitation of ipRGCs is sufficient to increase information flow by increasing the gain of visual responses, indicating that enhanced firing is a cause of increased information transfer at higher irradiance. Our results establish a retinal circuitry driving changes in RGC firing as an active response to alterations in ambient light to adjust the amount of visual information transmitted to the brain.

Keywords: information; ipRGC; melanopsin; neural coding; retina.


Conflict of interest statement

The authors declare no conflict of interest.

Figures

Fig. 1.
Fig. 1.
A model for enhanced visual information transfer at higher ambient light. (A) During visual exploration, receptive fields of RGCs move across visual patterns [shown to Left as simulated shifts in the location of a receptive field (circle) across the scene over time]. The amplitude of resultant variations in radiance is positively correlated with ambient light (shown to Right, and Inset as semilogarithmic plot, for three representative recordings of radiance during active viewing of the same natural scene at different times of day; brown, tan, and yellow lines for dim, moderate, and bright ambient light, respectively). (B) This fundamental correlation between ambient light (mean radiance) and its variability over space and time (SD of radiance) is apparent in a larger population of radiance recordings across different times of day (n = 126 independent recording epochs, each lasting 20 s; colored dots correspond to the data shown in the panel). As photon noise scales as the square root of mean photon flux, this corresponds to an increase in signal/noise for the visual input and therefore in the amount of visual information available to encode. (C) Our working hypothesis is that the measure of ambient light provided by ipRGCs is used as a signal to scale the tonic firing rate of RGCs and that this has the effect of increasing the number of spikes available to convey visual information at high irradiance [apparent as increased temporal structure in simulated raster plots (at Bottom) for repeats of the same visual stimulus (arrow)].
Fig. 2.
Fig. 2.
Increase in firing rates across RGC population correlates with irradiance. (A) Schematic of our ramp-plus-white noise (RAMP+WN) visual stimulation produced by a light source generating fast radiance fluctuations (WN) and passed through a slowly moving neutral-density filter wheel to produce a gradual change in irradiance (RAMP). These two stimulus components recapitulate the radiance SD and the radiance MEAN signals in Fig. 1C, respectively. (B) Irradiance values as function of time during the RAMP+WN stimulus (as semilog plot in Inset). (C) Time-averaged firing rate (mean ± SEM) as function of irradiance (0.5 log-units of irradiance per epoch) across the population of RGCs exposed to the RAMP+WN stimulus (solid line; n = 790), or control condition in which irradiance held constant (WN; dashed line; n = 309). Distribution of logarithmic transformed firing-rate ratios between the start and end of the ramp (log10frratio; Inset) is unimodal, and most units express an increase in firing [log10(frratio) > 0]. (D) STAs (mean ± SEM) for the white-noise stimulus in units with ON (Top; n = 406) or OFF (Bottom; n = 303) response polarity, across six epochs of the irradiance ramp (color code for lines at Left in log photons per square centimeter per second). (E) As in C, plotting ON and OFF units separately (gray and black lines, respectively). (F) The relationship between irradiance and time-averaged firing was captured for individual units as log10(frratio) and as the R2 of the log:linear relationship between firing rate and irradiance (Methods). Scatter plots for these parameters for ON and OFF units revealed that many more units with high R2 (>0.5) had increases (blue dots) than decreases (black dots) in firing rate (all units with R2 < 0.5 shown in gray). (G and H) As in F and C, but for RGCs presented with the RAMP stimulus without superimposed WN for all units and units with R2 > 0 (n = 455 and 124; gray and blue lines, respectively).
Fig. 3.
Fig. 3.
ipRGCs contribute to modulations in RGC-maintained activity. (A) Changes in firing rate induced by a gradual irradiance ramp (11–14.8 log photons⋅cm−2⋅s−1 over 13 min) were substantially deficient in Opn4−/− mice (black lines) compared with controls (blue lines). Statistically significant differences were determined after Bonferroni correction (P = 0.18, 0.25, 0.02, 0.004, and 3 × 10⁻⁹; zval = 1.33, 1,15, 2.28, 2.88, and 5.89, rank sum tests; n = 455 and 662, control and Opn4−/− mice, respectively). (B) Intravitreal injections of viral vector (AAV2-hsyn-DIO-hM3Dq-mCherry) in Opn4Cre/+;Z/EGFP mice (Inset) resulted in immunoreactivity for mCherry (red) in a subset of GFP-positive ipRGCs (green). Shown here for representative retinal whole mount. (Scale bar: 50 μm.) (C) Mean (±SEM) c-Fos–positive cells per millimeter length of retinal section after CNO administration (5 mg/kg, i.p.) was higher in hM3Dq-expressing (blue bar; n = 6) than control (black bar; n = 4) retinas in ganglion cell layer (GCL) and inner nuclear layer (INL). Unpaired t test; **P < 0.01. (D) Immunohistochemical staining of representative retinal sections showing c-Fos (green) expression in hM3Dq-expressing (Left) but not control (Right) retina held in dark but exposed to CNO extending beyond hM3Dq-expressing (mCherry immunoreactive, red) ipRGCs (arrow). (E) Same as C for INL. (F) Representative retinal section from a hM3Dq-expressing mouse following CNO administration stained for c-Fos (green) and RBPMS (purple) immunoreactivity showing all c-Fos–positive cells also positive for the ganglion cell marker RBPMS. Blue shows DAPI nuclear counterstain. (G) Mean (±SEM) c-Fos–positive cells per square millimeter in ipsilateral and contralateral dLGN after CNO administration (5 mg/kg, i.p.) in hM3Dq-expressing (blue bars; n = 6) and control (black bars; n = 6) mice (two-way ANOVA, *P < 0.05 and **P < 0.01). (H) Representative micrographs of coronal sections through lateral geniculate nucleus (approximate margins for dorsal and ventral subdivisions and intergeniculate leaflet shown with dotted lines) contralateral (Left) or ipsilateral (Right) to the eye injected with hM3Dq virus (Left) or vehicle control (Right) show c-Fos immunoreactivity (dark) in the former but not the latter following CNO administration. *P < 0.05, ***P < 0.0001.
Fig. 4.
Fig. 4.
Chemogenetic activation of ipRGCs enhances maintained firing across the RGC population. (A) Schematic of our visual-chemogenetic stimulus. A white-noise (WN) stimulus was presented at constant mean irradiance (11.5 log10 photons⋅cm−2⋅s−1) with timed CNO delivery. (B) Representative image for a whole-mount retina rec orded under our MEA system. mCherry fluorescence spanning large regions of the recording array could be observed. (C) Mean ± SEM change in time-averaged firing rate (ΔFR over mean before CNO administration) for hM3Dq-expressing (blue line) and control (black line) retinas following CNO application (5 µM) commencing at time 0. The top blue-black dashed line indicates significant differences in ΔFR (**P < 0.01, rank sum tests, Bonferroni’s correction). (D) The distribution of logarithmic ratios between firing rates (log10frratio) from hM3Dq-expressing retinas, before and after CNO delivery, is unimodal, and most units express an increase in firing rate (log10frratio > 0). (E) As in B, plotting ON and OFF units from hM3Dq retinas (lines above indicate significant increases in firing; P < 0.01, sign rank tests, Bonferroni’s correction). (F) Pie charts presenting percentage of units that showed increase, decrease, or no change in firing rate upon CNO application in hM3Dq (Left) and control (Right) retinas.
Fig. 5.
Fig. 5.
Impact of irradiance-driven increases in firing on neural coding. (A) Binarized trial bin counts for a representative unit from the RAMP+WN experiment to repeated presentations of the WN sequence. (B) Trial-to-trial reproducibility for units expressing increase in firing rates across the ramp were significantly higher in the last 40 trials (bright: 13.3–14.8 log10 photons⋅cm−2⋅s−1) compared with the initial 40 trials (dim: 11.8–13.3 log10 photons⋅cm−2⋅s−1). (C) As in B, but for information rate. (D) Firing and information rates are positively correlated (Left), and changes in firing rates across the ramp are predictive of changes in information rate (Right; Inset represents the shuffle test). (E) Schematic representation for the LNP model (Top) used to separately fit stimulus–response relations in dim- and bright-light conditions. STA (Bottom Left) and static nonlinearity (Bottom Right) in dim and bright conditions for a representative neuron. (F) Increases in response gain and baseline (G and B, respectively) were observed at high irradiance, while sensitivity and threshold (S and T, respectively) did not change (P ∼ 0 for G and B, P = 0.038 and 0.941 for S and T; n = 790; sign test). (G) Application of the model to reconstruct a stimulus based on firing patterns under bright (Top) and dim (Bottom) conditions, in the representative neuron [from E; colored and gray lines, reconstructed and original stimulus, respectively; correlation coefficients between reconstructed and original (ρorig-red) shown above]. (H) Histogram of differences in ρorig-red at high vs. low irradiance (Δρorig-red) in neurons showing increases in firing across the ramp, revealing a significant increase in ρorig-red at high irradiance (P ∼ 0; n = 385; sign test; dashed line shows mean). Inset shows quantiles for the distribution of ρorig-red for dim and bright condition. *P < 0.05, ****P < 0.0001.
Fig. 6.
Fig. 6.
Impact of ipRGC-driven increases in firing on neural coding. (A) As in Fig. 5A for a representative CNO-responsive unit from an hM3Dq-expressing retina; arrow to Right shows time of CNO administration. (B and C) Trial-to-trial reproducibility (B) and information rate (C) for the block of 40 trials after (“CNO”) than before (“pre”) CNO delivery in units expressing increase in firing rates post-CNO (P = 0.00014, P ∼ 0 for G and B, P = 0.433 and 0.229 for S and T; n = 393; sign test). (DH) As in Fig. 5 DH, but applied to CNO+WN experiments in hM3Dq retinas; accordingly, distribution of Δρorig-red in H is for neurons exhibiting CNO-related increases in firing. (I) Coding efficiency, calculated as bits per spike, was equivalent in “dim” vs. “bright” portions of the irradiance ramp (Left) but significantly reduced following CNO delivery (Right). ***P < 0.001, ****P < 0.0001 for rank sum test.

References

    1. Borst A, Haag J. Effects of mean firing on neural information rate. J Comput Neurosci. 2001;10:213–221. - PubMed
    1. Koch K, et al. Efficiency of information transmission by retinal ganglion cells. Curr Biol. 2004;14:1523–1530. - PubMed
    1. Spavieri DL, Jr, Eichner H, Borst A. Coding efficiency of fly motion processing is set by firing rate, not firing precision. PLoS Comput Biol. 2010;6:e1000860. - PMC - PubMed
    1. Wong KY. A retinal ganglion cell that can signal irradiance continuously for 10 hours. J Neurosci. 2012;32:11478–11485. - PMC - PubMed
    1. Brown TM, et al. Melanopsin contributions to irradiance coding in the thalamo-cortical visual system. PLoS Biol. 2010;8:e1000558. - PMC - PubMed

Publication types

LinkOut - more resources