. 2019 Feb;68(2):291-304.
doi: 10.2337/db18-0638. Epub 2018 Nov 28.

Estrogen Improves Insulin Sensitivity and Suppresses Gluconeogenesis via the Transcription Factor Foxo1

Affiliations

Estrogen Improves Insulin Sensitivity and Suppresses Gluconeogenesis via the Transcription Factor Foxo1

Hui Yan et al. Diabetes. 2019 Feb.

Abstract

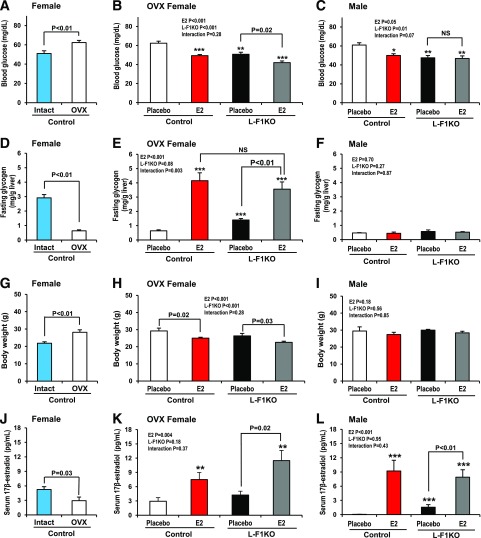
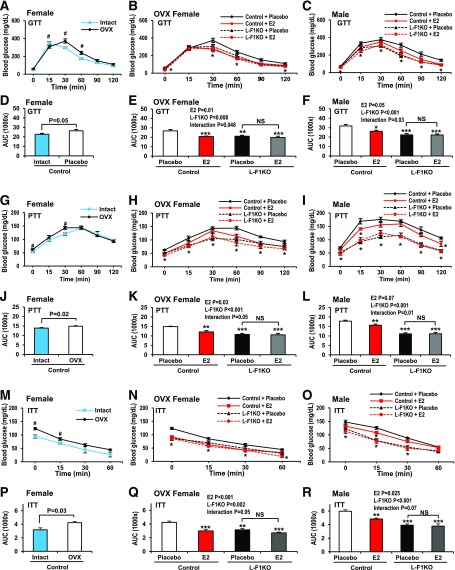
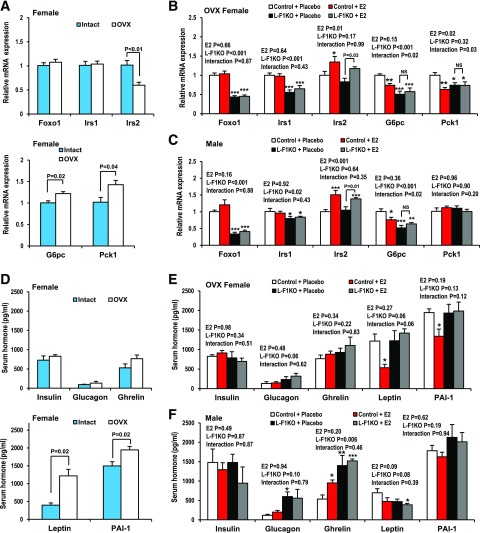
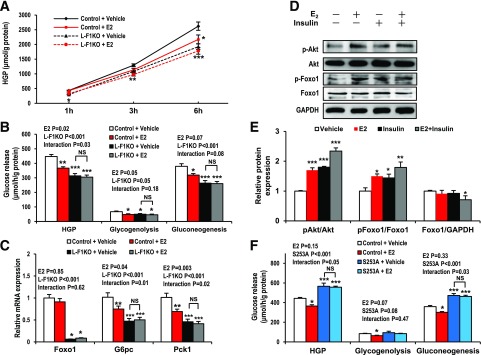
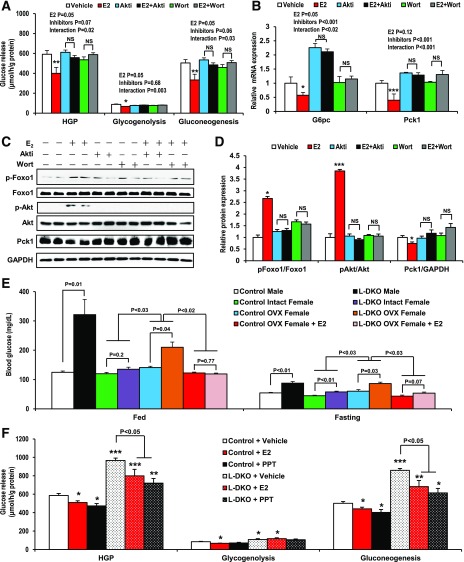
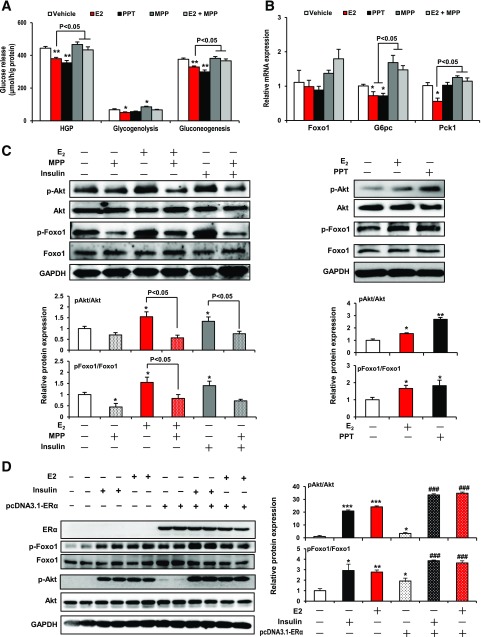
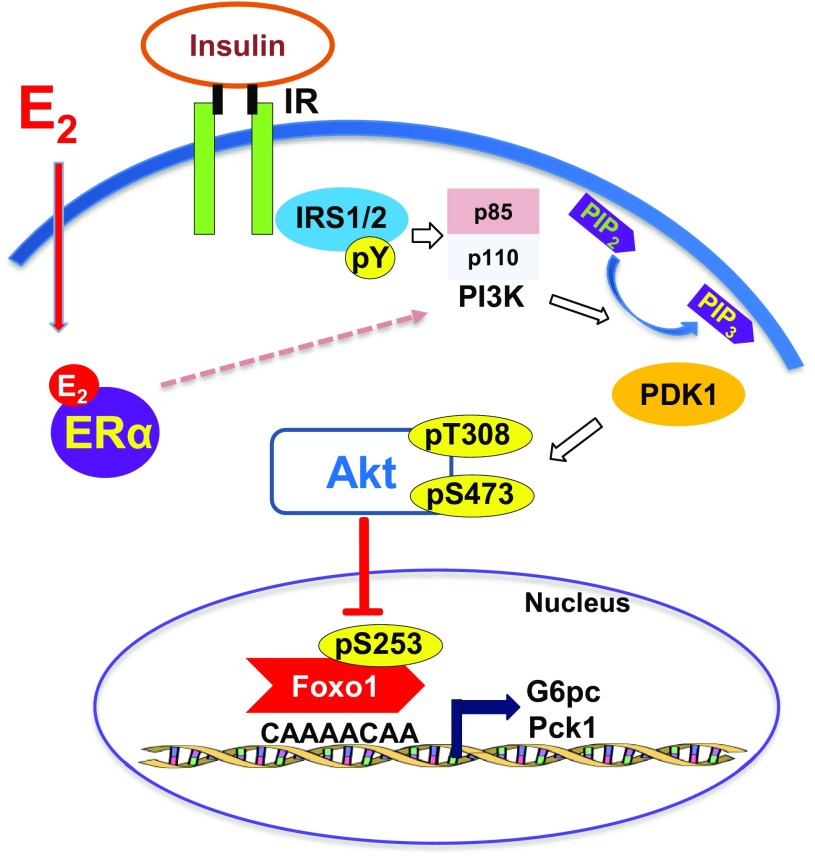
Premenopausal women exhibit enhanced insulin sensitivity and reduced incidence of type 2 diabetes (T2D) compared with age-matched men, but this advantage disappears after menopause with disrupted glucose homeostasis, in part owing to a reduction in circulating 17β-estradiol (E2). Fasting hyperglycemia is a hallmark of T2D derived largely from dysregulation of hepatic glucose production (HGP), in which Foxo1 plays a central role in the regulation of gluconeogenesis. Here, we investigated the action of E2 on glucose homeostasis in male and ovariectomized (OVX) female control and liver-specific Foxo1 knockout (L-F1KO) mice and sought to understand the mechanism by which E2 regulates gluconeogenesis via an interaction with hepatic Foxo1. In both male and OVX female control mice, subcutaneous E2 implant improved insulin sensitivity and suppressed gluconeogenesis; however, these effects of E2 were abolished in L-F1KO mice of both sexes. In our use of mouse primary hepatocytes, E2 suppressed HGP and gluconeogenesis in hepatocytes from control mice but failed in hepatocytes from L-F1KO mice, suggesting that Foxo1 is required for E2 action on the suppression of gluconeogenesis. We further demonstrated that E2 suppresses hepatic gluconeogenesis through activation of estrogen receptor (ER)α-phosphoinositide 3-kinase-Akt-Foxo1 signaling, which can be independent of insulin receptor substrates 1 and 2 (Irs1 and Irs2), revealing an important mechanism for E2 in the regulation of glucose homeostasis. These results may help explain why premenopausal women have lower incidence of T2D than age-matched men and suggest that targeting ERα can be a potential approach to modulate glucose metabolism and prevent diabetes.


Figures

Figure 1
Figure 1
Estrogen regulates glucose homeostasis in mice. A–C: Blood glucose level in control and L-F1KO mice of both sexes fasted for 16 h overnight. Fasting glucose was measured every week, and the data show the most representative measurement. D–F: Glycogen content in the liver of mice fasted for 16 h overnight. Glycogen content was normalized by weight of liver. G–I: Body weight at 8 weeks after E2 implantation in control and L-F1KO mice of both sexes fasted overnight. J–L: Serum E2 level at 8 weeks after E2 implantation in mice fasted overnight. All data are expressed as the mean ± SEM. For females, n = 4–7, *P < 0.05 vs. OVX control mice with placebo. For males, n = 4–5, *P < 0.05 vs. control mice with placebo. NS, not significant (P > 0.05). *P < 0.05; **P < 0.01; ***P < 0.001.
Figure 2
Figure 2
Estrogen improves insulin sensitivity and suppresses gluconeogenesis in mice. A–C: GTT was performed in control and L-F1KO mice of both sexes fasted for 16 h overnight. Glucose was administered at 2 g/kg body wt of mice by intraperitoneal injection after 16 h overnight fasting, and glucose level was measured at indicated time points. D–F: Area under the curve (AUC) of the GTT displayed in A–C, respectively. G–I: PTT was performed on mice fasted for 16 hours overnight. Pyruvate was administered at 2 g/kg body wt by intraperitoneal injection after overnight fasting, and glucose level was measured at indicated time points. J–L: Area under the curve of the PTT showed in G–I, respectively. M–O: ITT was performed on mice fasted for 5 h. Insulin was administered at 2 units/kg body wt by intraperitoneal injection, and glucose level was measured at indicated time points. P–R: Area under the curve of the ITT shown in M–O, respectively. All data are expressed as mean ± SEM. For females, n = 4–7, *P < 0.05 vs. OVX control mice with placebo. n = 4–7, #P < 0.05 vs. intact mice. For males, n = 4–5, *P < 0.05 vs. control mice with placebo. NS, not significant (P > 0.05). *P < 0.05; **P < 0.01; ***P < 0.001.
Figure 3
Figure 3
Estrogen suppresses expression of gluconeogenic genes in liver and influences serum hormone levels associated with glucose metabolism in mice. A–C: Relative mRNA expressions in the liver of control and L-F1KO mice of both sexes fasted for 16 hours overnight after 8 weeks of pellet implantation. D–F: Serum hormone levels in mice fasted for 16 h overnight. Blood samples were collected by cardiac puncture in euthanized mice. All data are expressed as the mean ± SEM. For females, n = 4–7, *P < 0.05 vs. OVX control mice on placebo. For males, n = 4–5, *P < 0.05 vs. control mice on placebo. *P < 0.05; **P < 0.01; ***P < 0.001.
Figure 4
Figure 4
Estrogen suppresses HGP and gluconeogenesis depending on hepatic Foxo1 in primary hepatocytes. A: HGP in primary hepatocytes from control and L-F1KO mice. HGP was measured at indicated time points after 0.1 μmol/L E2 stimulation, and normalized to total protein levels. B: Glucose production in primary hepatocytes from control and L-F1KO mice upon 0.1 μmol/L E2 stimulation in the presence (HGP) or absence (glycogenolysis) of pyruvate and lactate. The difference between these two values was interpreted to represent gluconeogenesis. C: Relative mRNA levels of gluconeogenic genes in primary hepatocytes from control and L-F1KO mice upon 0.1 μmol/L E2 stimulation for 3 h. D and E: Western blots (D) and corresponding quantification (E) of insulin signaling protein in hepatocytes from control mice upon 1 h stimulation of 0.1 μmol/L E2 or 0.1 μmol/L insulin. p-, phosphorylated. F: Glucose production in primary hepatocytes from control and Foxo1 S253A knock-in mice (S253A) upon 0.1 μmol/L E2 stimulation in the presence (HGP) or absence (glycogenolysis) of pyruvate and lactate (glycogenolysis). All data are expressed as the mean ± SEM. NS, not significant (P > 0.05). *P < 0.05, **P < 0.01, ***P < 0.001 vs. control + vehicle. n = 3 of each group.
Figure 5
Figure 5
Activation of Akt signaling is required for estrogen to suppress gluconeogenesis. A: Glucose release in primary hepatocytes from control mice in the presence (HGP) or absence (glycogenolysis) of pyruvate and lactate. Cells were treated with 10 μmol/L Akti or 0.2 μmol/L Wort 30 min prior to 0.1 μmol/L E2 stimulation. B: Relative mRNA levels of gluconeogenic genes in primary hepatocytes from control mice upon stimulation of 10 μmol/L Akti and 0.2 μmol/L Wort 30 min prior to 0.1 μmol/L E2. C and D: Western blots (C) and corresponding quantification (D) of insulin-signaling protein in hepatocytes from control mice upon stimulation of 10 μmol/L Akti and 0.2 μmol/L Wort 30 min prior to 0.1 μmol/L E2. p-, phosphorylated. E: Blood glucose levels of control and L-DKO mice in random-fed or fasted state upon OVX surgery and E2 implant. Blood glucose levels were measured in littermates of male, intact female, and OVX female mice at 12 weeks of age random fed or after 16 h overnight fast. F: Glucose production in primary hepatocytes from control and L-DKO mice upon 0.1 μmol/L E2 or 0.1 μmol/L ERα agonist PPT stimulation in the presence (HGP) or absence (glycogenolysis) of pyruvate and lactate. All data are expressed as the mean ± SEM. NS, not significant (P > 0.05). *P < 0.05, **P < 0.01, ***P < 0.001 vs. control + vehicle. n = 3 of each group.
Figure 6
Figure 6
ERα is required and sufficient to activate Akt-Foxo1 signaling and suppress gluconeogenesis in primary hepatocytes. A: Glucose production in primary hepatocytes from control mice in the presence (HGP) or absence (glycogenolysis) of pyruvate and lactate. Cells were treated with 1 μmol/L ERα antagonist MPP prior to stimulation of 0.1 μmol/L E2 or 0.1 μmol/L ERα agonist PPT. B: Relative mRNA levels of gluconeogenic genes in primary hepatocytes from control mice upon stimulation of 0.1 μmol/L E2, 1 μmol/L MPP, or 0.1 μmol/L PPT. C: Western blots and corresponding quantification of insulin-signaling protein in hepatocytes from control mice upon stimulation of 0.1 μmol/L E2, 1 μmol/L MPP, or 0.1 μmol/L PPT. D: Western blots and corresponding quantification of Foxo1 protein in HepG2 cells upon overexpression of ERα and stimulation of E2 or insulin. HepG2 cells were transfected with 10 µg plasmid DNA expressing green fluorescent protein (GFP) or ERα for 30 h, followed by 6 h starvation prior to 0.1 μmol/L E2 or 0.1 μmol/L insulin stimulation for 1 h. All data are expressed as mean ± SEM. *P < 0.05, **P < 0.01, ***P < 0.001 vs. control + vehicle. ###P < 0.001 vs. control + ERα overexpression. n = 3 of each group. p- or p, phosphorylated.
Figure 7
Figure 7
Schematic diagram represents the role of estrogen in the regulation of glucose metabolism. Estrogen suppresses hepatic gluconeogenesis and lowers blood glucose through interaction with ERα in a Foxo1-dependent manner. E2 inhibits Foxo1 and its target G6pc expression indirectly, depending on the activation of PI3K-Akt signaling. IR, insulin receptor; p, phosphorylated; PIP2, phosphatidylinositol (4,5)-bisphosphate; PIP3, phosphatidylinositol (3,4,5)-trisphosphate; PDK1, 3-phosphoinositide-dependent protein kinase 1; Y, tyrosin; T, threonine; S, serine.

Similar articles

Cited by

References

    1. Danaei G, Finucane MM, Lu Y, et al. .; Global Burden of Metabolic Risk Factors of Chronic Diseases Collaborating Group (Blood Glucose) . National, regional, and global trends in fasting plasma glucose and diabetes prevalence since 1980: systematic analysis of health examination surveys and epidemiological studies with 370 country-years and 2·7 million participants. Lancet 2011;378:31–40 - PubMed
    1. Salpeter SR, Walsh JM, Ormiston TM, Greyber E, Buckley NS, Salpeter EE. Meta-analysis: effect of hormone-replacement therapy on components of the metabolic syndrome in postmenopausal women. Diabetes Obes Metab 2006;8:538–554 - PubMed
    1. Misso ML, Murata Y, Boon WC, Jones ME, Britt KL, Simpson ER. Cellular and molecular characterization of the adipose phenotype of the aromatase-deficient mouse. Endocrinology 2003;144:1474–1480 - PubMed
    1. Louet J-F, LeMay C, Mauvais-Jarvis F. Antidiabetic actions of estrogen: insight from human and genetic mouse models. Curr Atheroscler Rep 2004;6:180–185 - PubMed
    1. Kim C, Kong S, Laughlin GA, et al. .; Diabetes Prevention Program Research Group . Reductions in glucose among postmenopausal women who use and do not use estrogen therapy. Menopause 2013;20:393–400 - PMC - PubMed

Publication types

MeSH terms