. 2019 Aug;68(8):1493-1503.
doi: 10.1136/gutjnl-2018-317071. Epub 2018 Nov 28.

Fine needle aspirates comprehensively sample intrahepatic immunity

Affiliations

Fine needle aspirates comprehensively sample intrahepatic immunity

Upkar S Gill et al. Gut. 2019 Aug.

Abstract

Objective: In order to refine new therapeutic strategies in the pipeline for HBV cure, evaluation of virological and immunological changes compartmentalised at the site of infection will be required. We therefore investigated if liver fine needle aspirates (FNAs) could comprehensively sample the local immune landscape in parallel with viable hepatocytes.

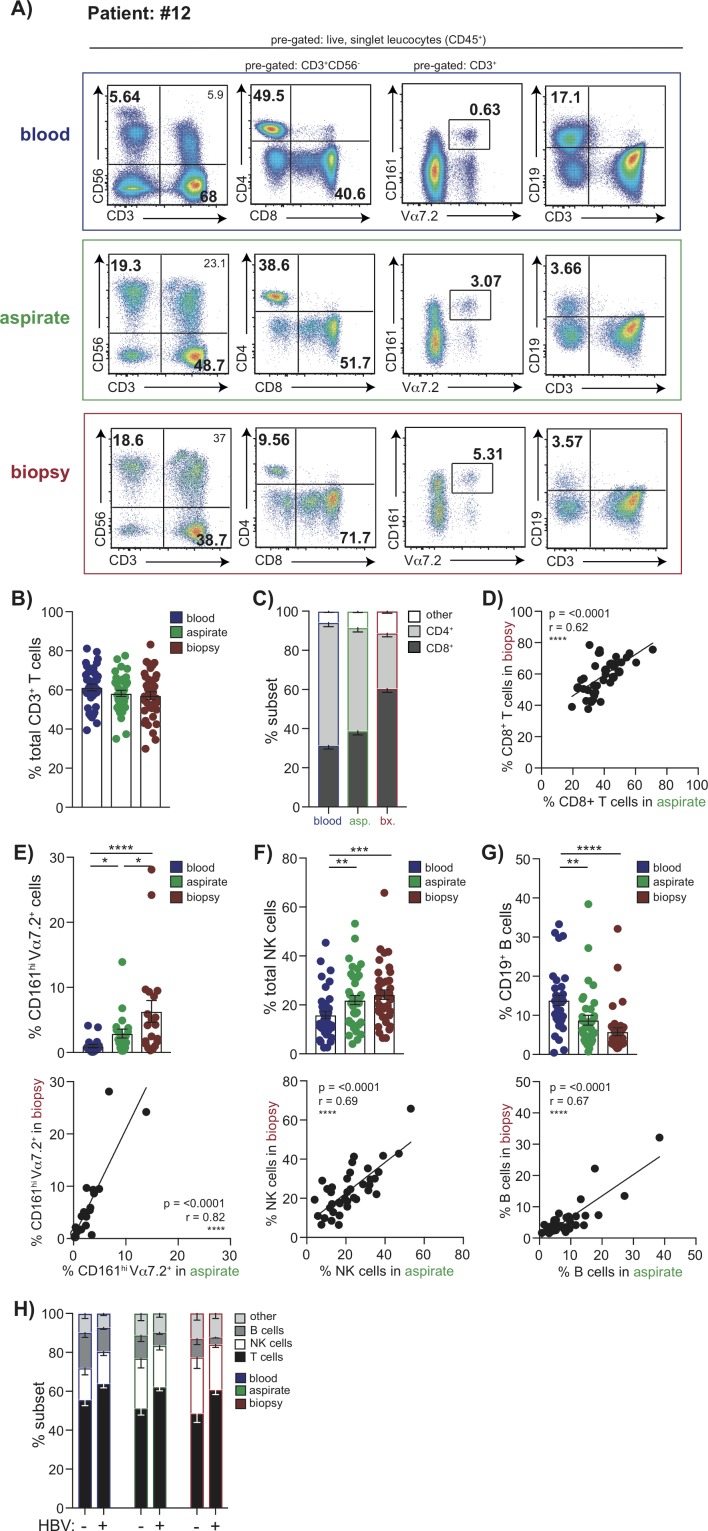
Design: Matched blood, liver biopsy and FNAs from 28 patients with HBV and 15 without viral infection were analysed using 16-colour multiparameter flow cytometry.

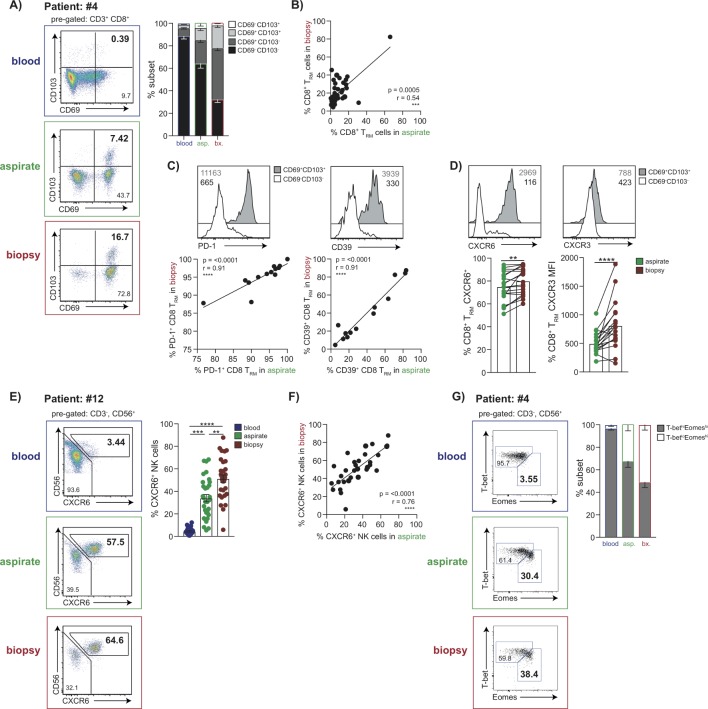
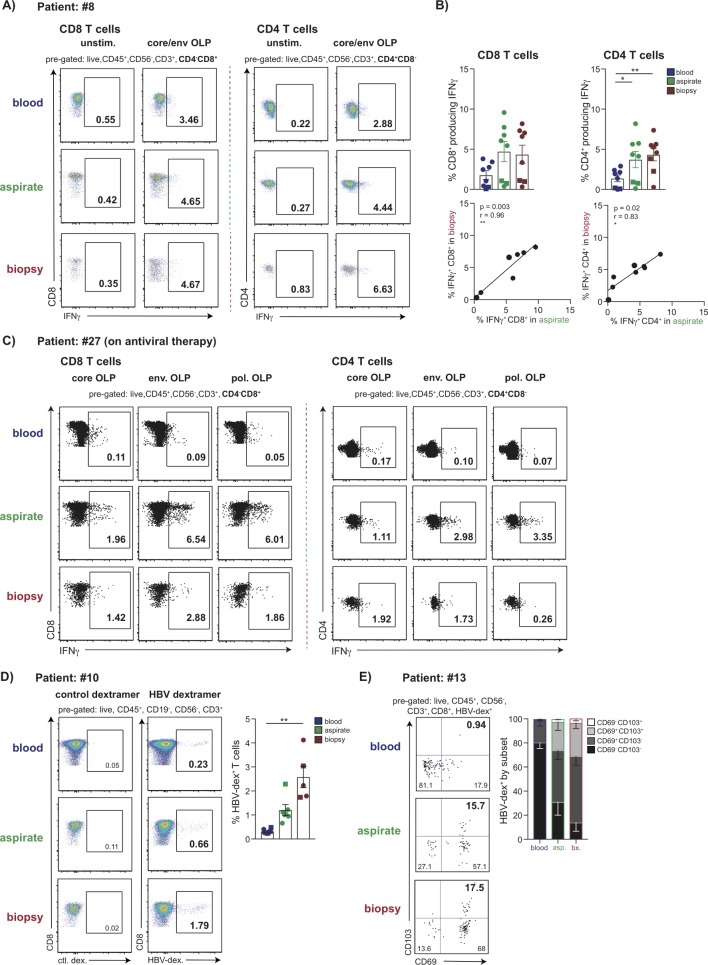
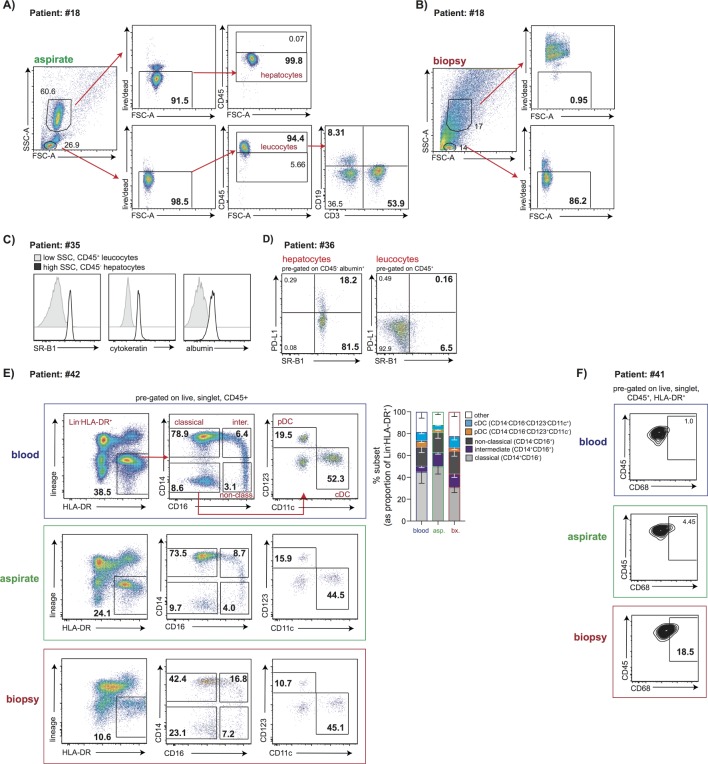
Results: The proportion of CD4 T, CD8 T, Mucosal Associated Invariant T cell (MAIT), Natural Killer (NK) and B cells identified by FNA correlated with that in liver biopsies from the same donors. Populations of Programmed Death-1 (PD-1)hiCD39hi tissue-resident memory CD8 T cells (CD69+CD103+) and liver-resident NK cells (CXCR6+T-betloEomeshi), were identified by both FNA and liver biopsy, and not seen in the blood. Crucially, HBV-specific T cells could be identified by FNAs at similar frequencies to biopsies and enriched compared with blood. FNAs could simultaneously identify populations of myeloid cells and live hepatocytes expressing albumin, Scavenger Receptor class B type 1 (SR-B1), Programmed Death-Ligand 1 (PD-L1), whereas hepatocytes were poorly viable after the processing required for liver biopsies.

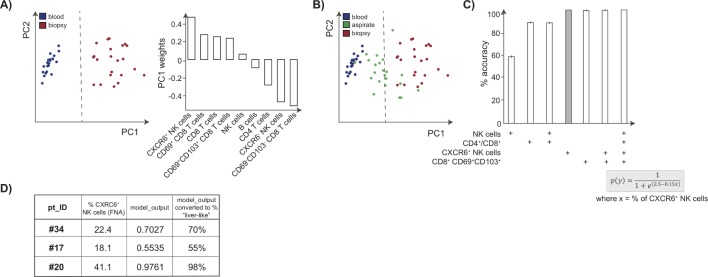
Conclusion: We demonstrate for the first time that FNAs identify a range of intrahepatic immune cells including locally resident sentinel HBV-specific T cells and NK cells, together with PD-L1-expressing hepatocytes. In addition, we provide a scoring tool to estimate the extent to which an individual FNA has reliably sampled intrahepatic populations rather than contaminating blood. The broad profiling achieved by this less invasive, rapid technique makes it suitable for longitudinal monitoring of the liver to optimise new therapies for HBV.

Keywords: HBV-specific T cells; fine needle aspirate; hepatitis B virus; hepatocytes; intrahepatic-immune monitoring; liver biopsy; tissue-resident immunity.


Conflict of interest statement

Competing interests: USG, NT, ARB, AAP, SY have no conflicts of interest to declare; LJP has participated in a Gilead advisory board; PTFK has collaborative grant funding from Gilead, participates in advisory board/provides consultancy to Gilead, Janssen and is an investigator for industry-led trials with Gilead, Janssen, Alere, Assembly Biosciences. MKM’s laboratory has collaborative grant funding from Gilead, Roche and Immunocore; MKM participates in advisory boards/provides consultancy to Gilead, Roche, Arbutus Biopharma, Immunocore, Janssen.

Figures

Figure 1
Figure 1
Global lymphocyte profiling of matched blood, FNA and liver biopsy samples. Multiparameter flow cytometric analysis of matched samples from blood (blue), FNA (green) and liver biopsy tissue (red) from the same individuals analysed in parallel. (A) Representative sequential gating strategy used to identify T cell, NK cell, MAIT cell and B cell subpopulations, pregated on live, singlet CD45 expressing leucocytes. Summary data of the frequency of (B) global CD3+ T cells, (C) CD4+ and CD8+ T cells using each sampling method (n=37). (D) Correlation of intrahepatic CD8+ T cell frequencies in FNA samples compared with biopsies. Summary frequencies and corresponding correlative analysis of FNA versus biopsy comparing intrahepatic populations of (E) MAIT cells (CD3+CD161hiV7.2α+; n=20), (F) NK cells (CD3CD56+; n=37) and (G) B cells (CD3CD19+; n=36). (H) Summary lymphocyte profiles of blood with corresponding FNA and biopsy comparing HBV-infected patients (n=22) versus non-HBV infected subjects (n=14). Error bars indicate means±SEM; p values were determined by a Friedman test (ANOVA) with a Dunn’s post hoc test for multiple comparisons, Spearman’s rank correlation coefficient or Mann-Whitney U-test; significant changes marked with asterisks, *p<0.05; **p<0.01; ***p<0.001, ****p<0.0001. ANOVA, analysis of variance; FNA, fine needle aspirate.
Figure 2
Figure 2
Identification of liver-resident T cell and NK cell populations by FNA compared with liver biopsy. (A) Representative flow cytometry plots depicting non-resident/liver-infiltrating CD8+ T cells (CD69CD103), CD69 single positive and liver-resident CD8+ T cells (CD69+CD103+CD8+ TRM) in matched blood, FNA and liver biopsy tissue and summary data (n=37) of the frequency of each subset. (B) Correlation of CD8+TRM frequencies in FNAs and biopsy samples. (C) Representative histograms of PD-1 and CD39 expression on CD8+TRM versus non-resident subsets and correlation of %PD-1 and %CD39 on CD8+TRM in FNAs and biopsies (n=13). (D) Representative histograms of CXCR6 and CXCR3 expression on CD8+ TRM versus non-resident subsets and correlation of their expression on CD8+ TRM in FNAs and biopsies (n=20). (E) Representative plots showing CXCR6 and CXCR6+ fractions of intrahepatic NK cells and summary data of frequency of %CXCR6+ liver-resident NK cells in blood, FNA and liver biopsy (n=32). (F) Correlation of CXCR6+ NK cell frequencies in FNAs and biopsies (n=32). (G) Representative plots of T-bet and Eomes expression on CXCR6+ NK cells and summary data of the proportion of liver-resident T-betloEomeshi versus liver-infiltrating T-bethiEomeslo NK cells in blood, FNAs and biopsies (n=10). Error bars indicate means±SEM; p values were determined by a Friedman test (ANOVA) with a Dunn’s post hoc test for multiple comparisons, Wilcoxon signed-rank t test or Spearman’s rank correlation coefficient; significant changes marked with asterisks, *p<0.05; **p<0.01; ***p<0.001, ****p<0.0001. ANOVA, analysis of variance; FNA, fine needle aspirate.
Figure 3
Figure 3
Detection of HBV-specific T cell populations in FNA and liver biopsy samples. (A) Representative plots showing the frequency of HBV-specific CD3+CD4-CD8+ and CD3+CD4+CD8- T cells (%IFN-γ presented minus paired unstimulated control) matched blood, FNA and liver biopsy tissue, measured by the production of IFN-γ by ICS following 16 hours stimulation with OLP spanning the core and envelope proteins. (B) Summary data of the frequency of HBV-specific CD4 and CD8 T cells (n=8) and their correlation in FNA and biopsy samples. (C) Representative plots showing the frequency of HBV-specific CD3+CD4-CD8+and CD3+CD4+CD8- T cells in matched blood, FNA and liver biopsy tissue, measured by the production of IFN-γ by ICS following 16 hours stimulation with OLP spanning the core, envelope and polymerase proteins in a virally suppressed patient on antiviral therapy (%IFN-γ presented minus paired unstimulated control). (D) Representative plots and summary data (n=6 for blood and FNA; n=5 for biopsy) of ex vivo staining with a panel of HLA-A2/HBV peptide dextramers (gated using an HLA-A2 restricted control dextramer loaded with an irrelevant peptide). (E) Representative plots and summary data (n=5) depicting the proportion of HBV-specific CD8+ T cells identified by ex vivo dextramer staining expressing residency markers CD69 and CD103. Circles in summary data depict treatment-naïve patients and squares indicate patients analysed during antiviral therapy. Error bars indicate means±SEM; p values were determined by a Wilcoxon signed-rank t test; significant changes marked with asterisks,*p<0.05; **p<0.01; ***p<0.001, ****p<0.0001. FNA, fine needle aspirate; ICS, intracellular cytokine staining; OLP, overlapping peptide
Figure 4
Figure 4
Using FNA samples to analyse viable hepatocytes and leucocytes in parallel. Representative gating strategy used to distinguish viable hepatocytes and leucocytes in the same staining panel using forward and side scatter, a live-dead stain and CD45 in (A) an FNA sample and (B) liver biopsy sample. The example shows additional staining for global B (CD19+) and T (CD3+) cells. (C) Representative histograms showing SR-B1, cytokeratin and albumin expression, respectively, on hepatocytes (high SSC, CD45; black open histograms) compared with leucocytes (low SSC, CD45+; grey filled histograms). (D) Representative flow cytometry plots of PD-L1 expression on CD45- albumin+SR-B1+hepatocytes compared with CD45+ leucocytes by FNA sampling. (E) Representative sequential gating strategy along with summary data (n=5) showing mononuclear phagocyte populations in blood, FNA and liver biopsy samples. Pregated on live, singlet CD45+ leucocytes, lineage(CD3,CD19,CD20,CD56,CD66b) HLA-DR+, populations of classical (CD14+CD16), intermediate (CD14+CD16+) and non-classical (CD14loCD16+) subsets. Populations of dendritic cells (DCs) identified as CD14CD16 populations; pDC (plasmatocytoid DC) identified as CD123+CD11c and cDC (classical DC) as CD123CD11c+. (F) Flow cytometry plot indicating CD68+ mononuclear phagocyte (pregated on live, singlet, CD45+, HLA-DR+) in blood, FNA and liver biopsy. FNA, fine needle aspirate; SSC, side scatter.
Figure 5
Figure 5
Frequencies of CXCR6+ NK cells accurately predict how well an FNA represents the intrahepatic compartment using analytical methods. (A) Visualisation of dimension reduction of analysed lymphocyte subsets (global CD4+ T cells, CD8+ T cells, NK cells, B cells, CXCR6±NK cells, and CD69+CD103+/CD69+ CD103 CD8 TRM cells), using PCA for blood samples (blue) and liver biopsy samples (red) including PC1 weights. (B) Logistic regression identifies the classification boundary that best separates liver from blood (dashed line). FNA samples (green) are projected on to the PCA visualisation to determine which side of the boundary they sit. (C) Model accuracy, with 95% CIs shown, obtained by bootstrapping using lymphocytic subsets as predictors of how ‘liver-like’ an FNA sample is; the equation used to score accuracy using %CXCR6+ NK cells is shown. (D) Table depicting demonstration of the utility of the FNA tool using three additional FNA samples. The proportion of CXCR6+ NK cells, and the resulting score indicates how well these FNAs had sampled the intrahepatic immune landscape. FNA, fine needle aspirate; PCA, principal component analysis; CI, confidence interval.

References

    1. Stanaway JD, Flaxman AD, Naghavi M, et al. . The global burden of viral hepatitis from 1990 to 2013: findings from the Global Burden of Disease Study 2013. Lancet 2016;388:1081–8. 10.1016/S0140-6736(16)30579-7 - DOI - PMC - PubMed
    1. Gill US, Bertoletti A. Clinical trial design for immune-based therapy of hepatitis B Virus. Semin Liver Dis 2017;37:085–94. 10.1055/s-0037-1600522 - DOI - PubMed
    1. Maini MK, Pallett LJ. Defective T-cell immunity in hepatitis B virus infection: why therapeutic vaccination needs a helping hand. Lancet Gastroenterol Hepatol 2018;3:192–202. 10.1016/S2468-1253(18)30007-4 - DOI - PubMed
    1. Durantel D, Zoulim F. New antiviral targets for innovative treatment concepts for hepatitis B virus and hepatitis delta virus. J Hepatol 2016;64(1 Suppl):S117–S131. 10.1016/j.jhep.2016.02.016 - DOI - PubMed
    1. Gill US, Pallett LJ, Kennedy PTF, et al. . Liver sampling: a vital window into HBV pathogenesis on the path to functional cure. Gut 2018;67:gutjnl-2017-314873–75. 10.1136/gutjnl-2017-314873 - DOI - PMC - PubMed

Publication types

MeSH terms