

Mechanisms of Abrupt Loss of Virus Control in a Cohort of Previous HIV Controllers
- PMID: 30487276
- PMCID: PMC6363998
- DOI: 10.1128/JVI.01436-18
Mechanisms of Abrupt Loss of Virus Control in a Cohort of Previous HIV Controllers
Abstract
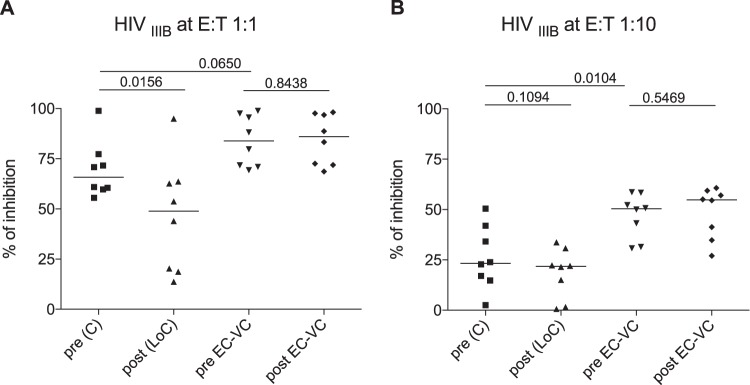
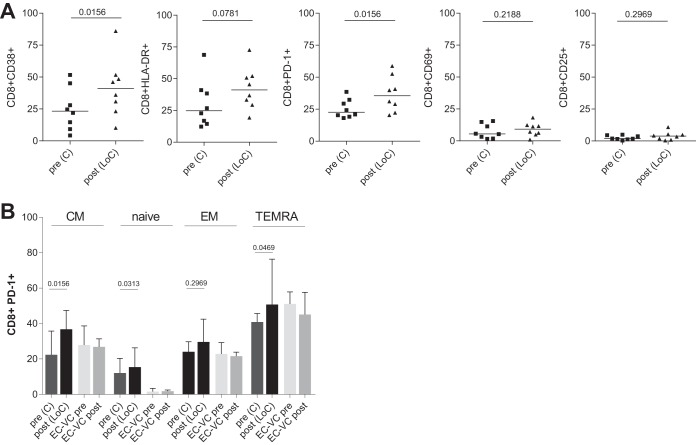
Elite and viremic HIV controllers are able to control their HIV infection and maintain undetectable or low-level viremia in the absence of antiretroviral treatment. Despite extensive studies, the immune factors responsible for such exclusive control remain poorly defined. We identified a cohort of 14 HIV controllers that suffered an abrupt loss of HIV control (LoC) to investigate possible mechanisms and virological and immunological events related to the sudden loss of control. The in-depth analysis of these subjects involved the study of cell tropism of circulating virus, evidence for HIV superinfection, cellular immune responses to HIV, as well as an examination of viral adaptation to host immunity by Gag sequencing. Our data demonstrate that a poor capacity of T cells to mediate in vitro viral suppression, even in the context of protective HLA alleles, predicts a loss of viral control. In addition, the data suggest that inefficient viral control may be explained by an increase of CD8 T-cell activation and exhaustion before LoC. Furthermore, we detected a switch from C5- to X4-tropic viruses in 4 individuals after loss of control, suggesting that tropism shift might also contribute to disease progression in HIV controllers. The significantly reduced inhibition of in vitro viral replication and increased expression of activation and exhaustion markers preceding the abrupt loss of viral control may help identify untreated HIV controllers that are at risk of losing control and may offer a useful tool for monitoring individuals during treatment interruption phases in therapeutic vaccine trials.IMPORTANCE A few individuals can control HIV infection without the need for antiretroviral treatment and are referred to as HIV controllers. We have studied HIV controllers who suddenly lose this ability and present with high in vivo viral replication and decays in their CD4+ T-cell counts to identify potential immune and virological factors that were responsible for initial virus control. We identify in vitro-determined reductions in the ability of CD8 T cells to suppress viral control and the presence of PD-1-expressing CD8+ T cells with a naive immune phenotype as potential predictors of in vivo loss of virus control. The findings could be important for the clinical management of HIV controller individuals, and it may offer an important tool to anticipate viral rebound in individuals in clinical studies that include combination antiretroviral therapy (cART) treatment interruptions and which, if not treated quickly, could pose a significant risk to the trial participants.
Keywords: HIV-1 control; HIV-1 progression; cell tropism; host genetics; in vitro virus inhibition; loss of control.
Copyright © 2019 Rosás-Umbert et al.
Figures
References
-
- Deeks SG, Walker BD, Cellerai C, Vallelian F, Bart PA, Pantaleo G, Lifson JD, O’Connor DH, Carrington M, Watkins DI. 2007. Human immunodeficiency virus controllers: mechanisms of durable virus control in the absence of antiretroviral therapy. Immunity 27:406–416. doi: 10.1016/j.immuni.2007.08.010. - DOI - PubMed
-
- Pereyra F, Addo MM, Kaufmann DE, Liu Y, Miura T, Rathod A, Baker B, Trocha A, Rosenberg R, Mackey E, Ueda P, Lu Z, Cohen D, Wrin T, Petropoulos CJ, Rosenberg ES, Walker BD. 2008. Genetic and immunologic heterogeneity among persons who control HIV infection in the absence of therapy. J Infect Dis 197:563–571. doi: 10.1086/526786. - DOI - PubMed
-
- Sáez-Cirión A, Sinet M, Shin SY, Urrutia A, Versmisse P, Lacabaratz C, Boufassa F, Avettand-Fènoël V, Rouzioux C, Delfraissy J-F, Barré-Sinoussi F, Lambotte O, Venet A, Pancino G, ANRS EP36 HIV Controllers Study Group. 2009. Heterogeneity in HIV suppression by CD8 T cells from HIV controllers: association with Gag-specific CD8 T cell responses. J Immunol 182:7828–7837. doi: 10.4049/jimmunol.0803928. - DOI - PubMed
-
- Fellay J, Shianna KV, Ge D, Colombo S, Ledergerber B, Weale M, Zhang K, Gumbs C, Castagna A, Cossarizza A, Cozzi-Lepri A, De Luca A, Easterbrook P, Francioli P, Mallal S, Martinez-Picado J, Miro JM, Obel N, Smith JP, Wyniger J, Descombes P, Antonarakis SE, Letvin NL, McMichael AJ, Haynes BF, Telenti A, Goldstein DB. 2007. A whole-genome association study of major determinants for host control of HIV-1. Science 317:944–947. doi: 10.1126/science.1143767. - DOI - PMC - PubMed
Publication types
MeSH terms
Substances
Grants and funding
LinkOut - more resources
Full Text Sources
Medical
Molecular Biology Databases
Research Materials
Miscellaneous
