. 2018 Dec 15;183(23):717.
doi: 10.1136/vr.104718. Epub 2018 Nov 28.

Further description of bovine tuberculosis trends in the United Kingdom and the Republic of Ireland, 2003-2015

Affiliations

Further description of bovine tuberculosis trends in the United Kingdom and the Republic of Ireland, 2003-2015

Simon J More et al. Vet Rec. .

Abstract

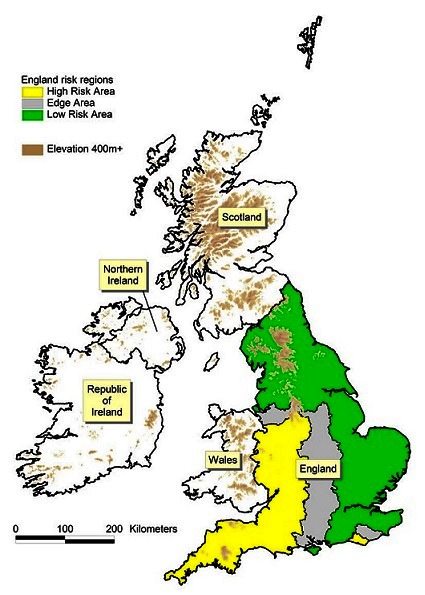
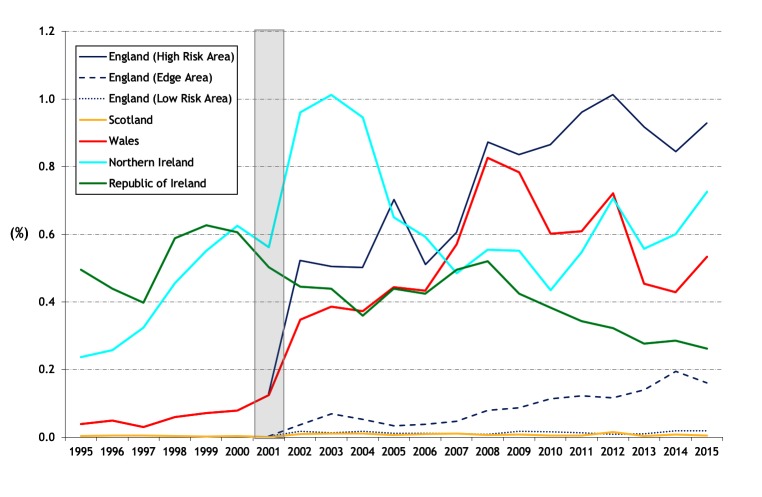
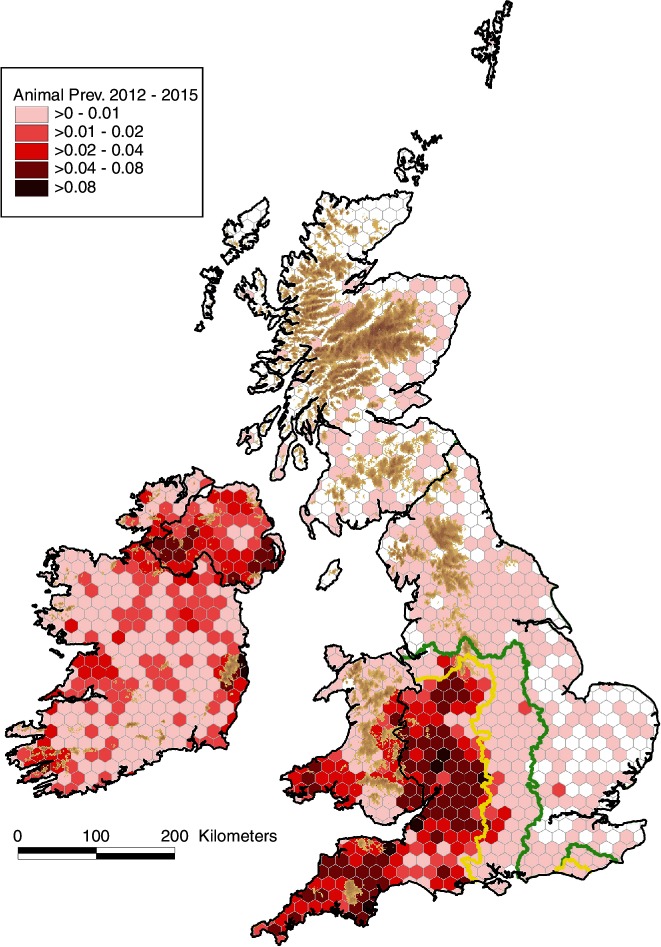
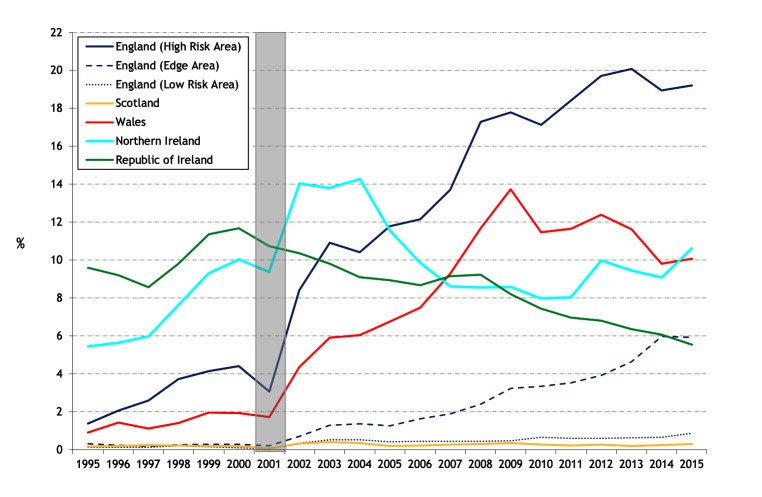
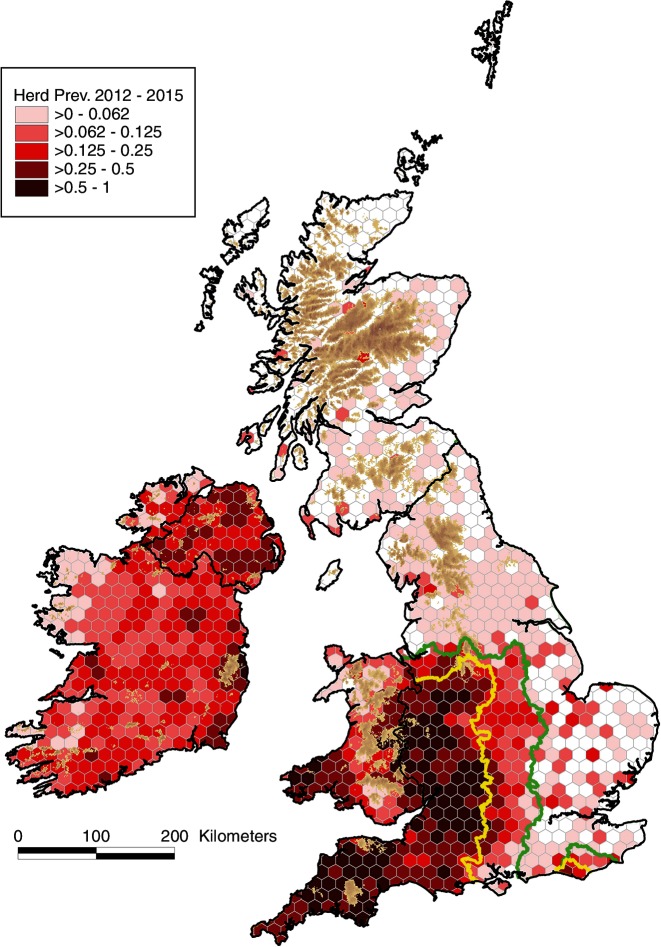
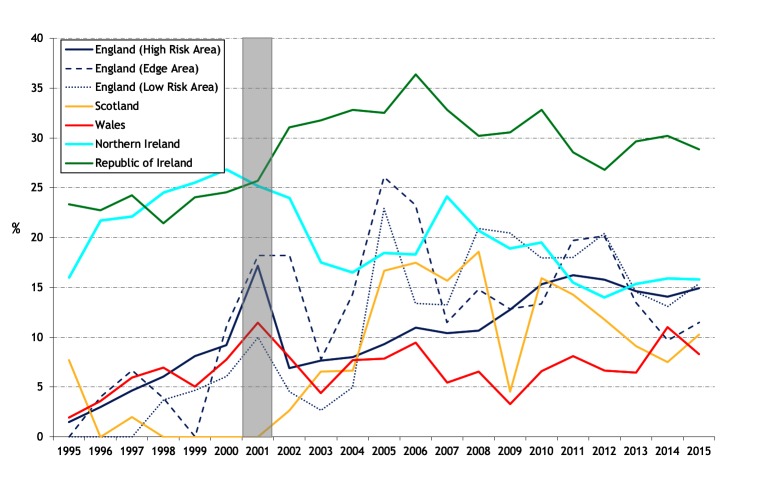
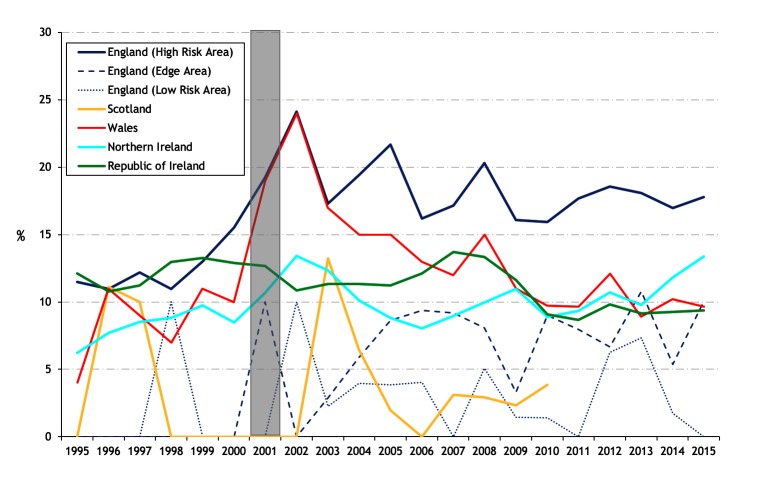
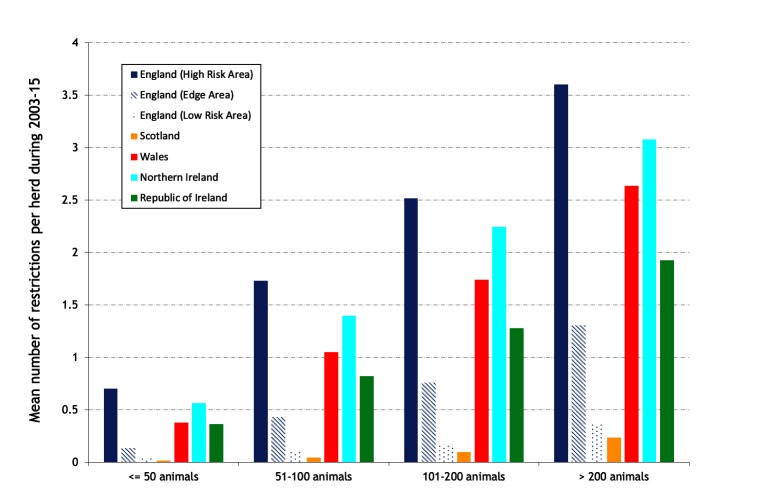
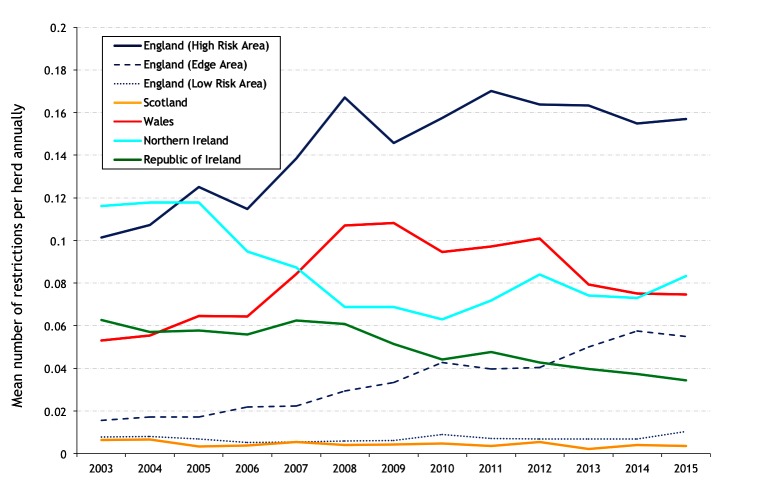
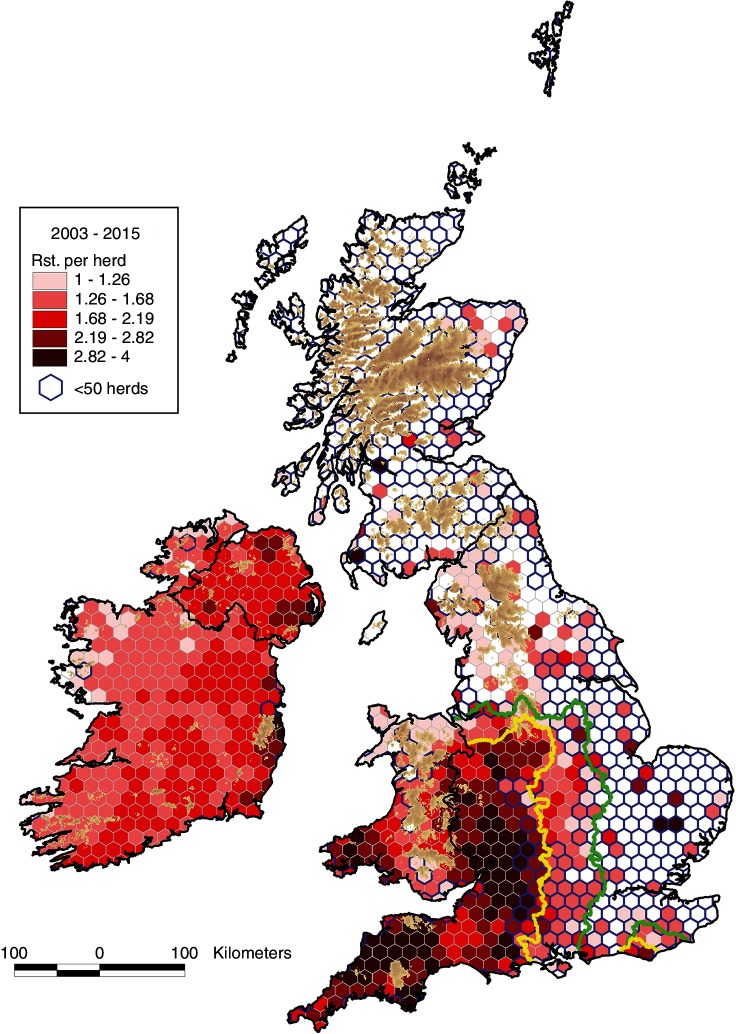
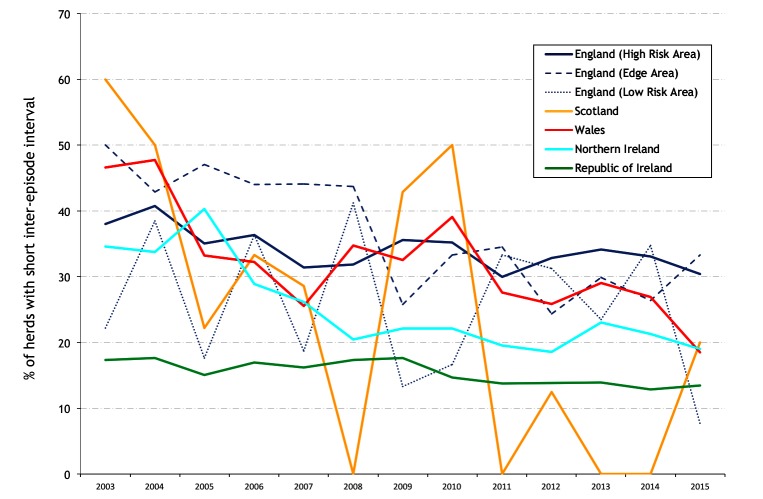
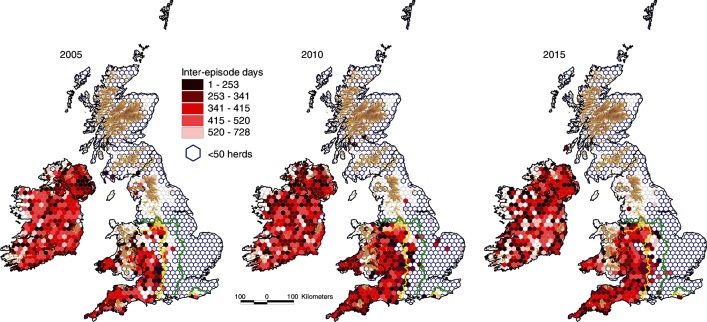
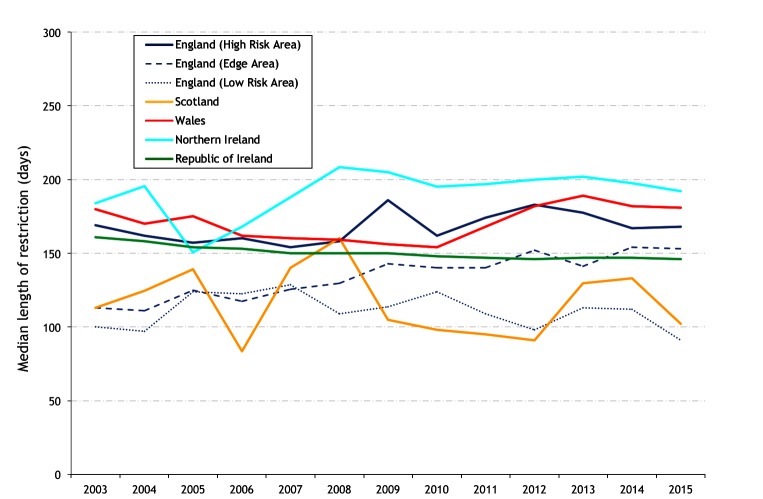
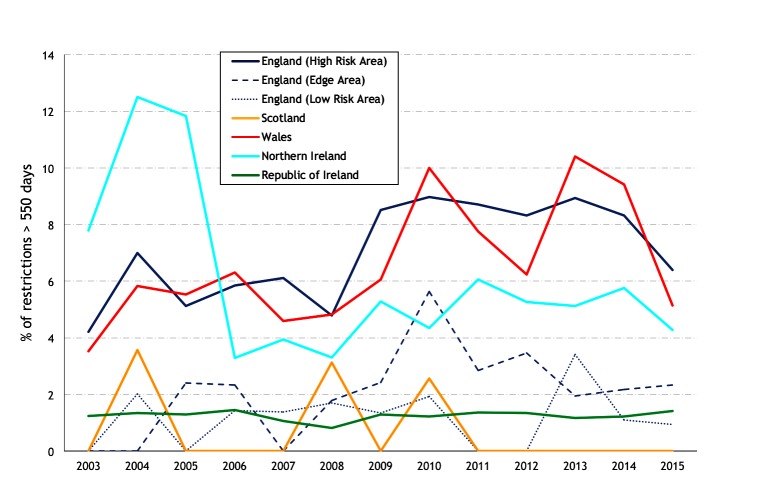
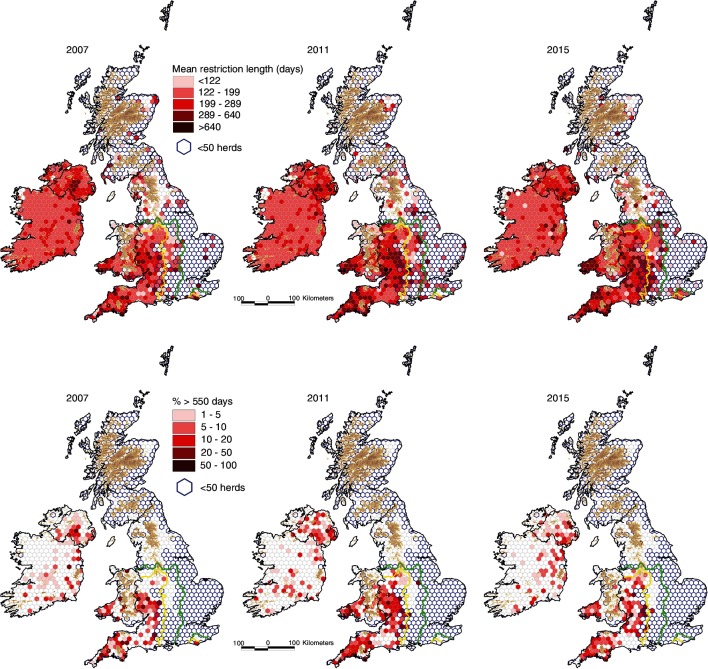
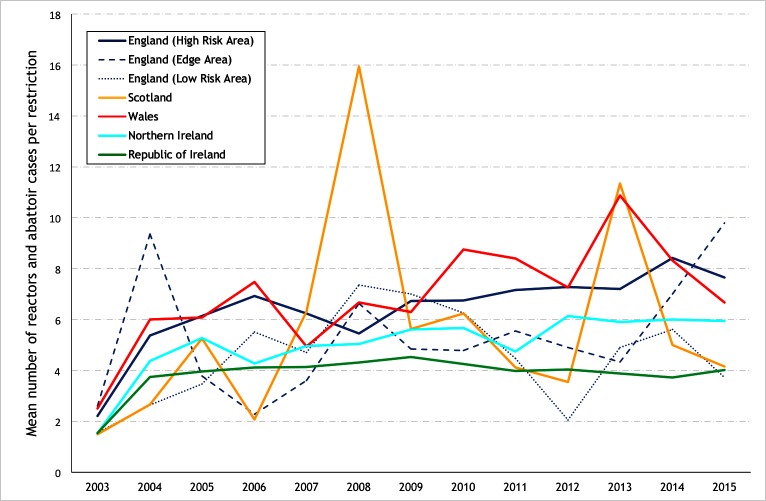
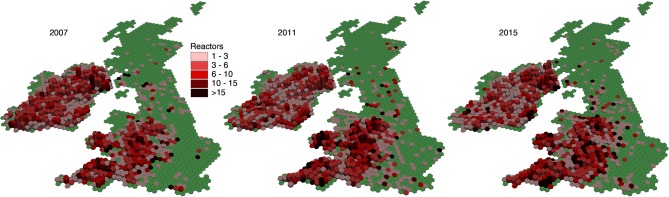
Extending on earlier work, trends in bovine tuberculosis (bTB) from 2003 to 2015 are described for the countries of the UK and the Republic of Ireland using standardised definitions and measures. Based on measures of animal and herd incidence, there remains a stable situation of extremely low prevalence in Scotland and the Low Risk Area of England, and a higher but ongoing reduction in prevalence in the Republic of Ireland. In Northern Ireland, there has been a rising bTB trend during 2010-2015, although not to levels experienced during 2002-2004. In the High Risk Area and Edge Area of England during 2010-2015, the rising bTB trends have continued but with some recent evidence of stabilisation. In Wales, prevalence has fallen subsequent to a peak in 2008. The paper considers country-level differences in the light of key policy changes, which are presented in detail. This work is unique, and will assist policymakers when critically evaluating policy options for effective control and eradication. Ongoing updates of this analysis would be useful, providing an evidence base for country-level comparison of bTB trends into the future. The use of multivariable analytical methods should be considered, but will rely on substantial sharing of raw data across the five countries.

Keywords: Republic of Ireland; United Kingdom; bovine tuberculosis; epidemiology; eradication.


Conflict of interest statement

Competing interests: None declared.

Figures

Figure 1
Figure 1
The UK and Republic of Ireland illustrating political boundaries and the bovine tuberculosis (bTB) risk areas (High Risk Area, Edge Area, Low Risk Area) in England.
Figure 2
Figure 2
Annual apparent animal prevalence. The risk areas in England are only presented from 2001 (a continuation of figure 17 from Abernethy et al’s study). The shaded area represents the duration of the foot and mouth epidemic.
Figure 3
Figure 3
Cumulative apparent animal prevalence, 2012–2015 (sum of reactors (2012–2015) per hexagon divided by the sum of the mean population per herd (2012–2015) per hexagon) (a continuation of figure 18 from Abernethy et al’s  study). The yellow and green lines delineate the boundaries between the High Risk Area and the Edge Area, and between the Edge Area and the Low Risk Area, respectively.
Figure 4
Figure 4
Standardised annual herd prevalence (a continuation of figure 9 from Abernethy et al’s study). The shaded area represents the duration of the foot and mouth epidemic.
Figure 5
Figure 5
Standardised annual herd incidence (a continuation of figure 11 from Abernethy et al’s study). The shaded area represents the duration of the foot and mouth epidemic.
Figure 6
Figure 6
Annual herd incidence density rate per 100 herd-years at risk.
Figure 7
Figure 7
Cumulative herd risk, 2012–2015 (count of herds with ≥1 reactor for the period 2012–2015 divided by count of active herds per hexagon 2012–2015) (a continuation of figure 14 from Abernethy et al’s  study). The yellow and green lines delineate the boundaries between the High Risk Area and the Edge Area, and between the Edge Area and the Low Risk Area, respectively.
Figure 8
Figure 8
Percentage of bovine tuberculosis (bTB) restrictions detected by abattoir surveillance (a continuation of figure 23 from Abernethy et al’s  study). The shaded area represents the duration of the foot and mouth epidemic.
Figure 9
Figure 9
Percentage of herds positive at the six-month post-restriction test. No data are presented for Scotland after 2010, where the six-month post-restriction test was abolished for OTFS (officially bTB free status suspended) unconfirmed episodes (a continuation of figure 25 from Abernethy et al’s study). The shaded area represents the duration of the foot and mouth epidemic.
Figure 10
Figure 10
Mean number of restrictions per study herd during 2003–2015, by herd size.
Figure 11
Figure 11
Mean number of restrictions per study herd annually.
Figure 12
Figure 12
Mean number of restrictions per study herd per hexagon during 2003–2015 for those study herds with at least one restriction during this period (total restrictions per hexagon for 2003–2015 divided by the number of herds with a restriction per hexagon 2003–2015). The yellow and green lines delineate the boundaries between the High Risk Area and the Edge Area, and between the Edge Area and the Low Risk Area, respectively.
Figure 13
Figure 13
Annual percentage of study herds restricted during the year of interest with a short interepisode interval (≤365 days).
Figure 14
Figure 14
Mean interepisode interval per hexagon during 2005, 2010 and 2015 for those study herds that were restricted during the year of interest with an interepisode interval up to 730 days. The yellow and green lines delineate the boundaries between the High Risk Area and the Edge Area, and between the Edge Area and the Low Risk Area, respectively.
Figure 15
Figure 15
Median restriction length for restrictions ending during the year of interest.
Figure 16
Figure 16
Percentage of restrictions more than 550 days in duration (prolonged restrictions).
Figure 17
Figure 17
Mean restriction length (top) and the percentage of prolonged restrictions (>550 days) (bottom), by hexagon during 2007, 2011 and 2015 (restriction length per hexagon divided by the number of restricted herd per hexagon 2007, 2011 and 2015 (top), percentage of restricted herds with a restriction length >550 days per hexagon 2007, 2011 and 2015 (bottom)). The yellow and green lines delineate the boundaries between the High Risk Area and the Edge Area, and between the Edge Area and the Low Risk Area, respectively.
Figure 18
Figure 18
Mean number of reactors and abattoir cases per restriction, limited to study herds with a restriction ending during the year of interest.
Figure 19
Figure 19
Mean number of reactors and abattoir cases per restriction per hexagon in 2007, 2011 and 2015. For each hexagon, colour is used to indicate the mean number of reactors and abattoir cases per restriction, and column height to reflect the total number of study herds with a restriction ending during the year of interest.

References

    1. Davidson JA, Loutet MG, O’Connor C, et al. . Epidemiology of Mycobacterium bovis Disease in Humans in England, Wales, and Northern Ireland, 2002-2014. Emerg Infect Dis 2017;23:377–86. 10.3201/eid2303.161408 - DOI - PMC - PubMed
    1. Jalava K, Jones JA, Goodchild T, et al. . No increase in human cases of Mycobacterium bovis disease despite resurgence of infections in cattle in the United Kingdom. Epidemiol Infect 2007;135:40–5. 10.1017/S0950268806006509 - DOI - PMC - PubMed
    1. Doran P, Carson J, Costello E, et al. . An outbreak of tuberculosis affecting cattle and people on an Irish dairy farm, following the consumption of raw milk. Ir Vet J 2009;62:390–7. 10.1186/2046-0481-62-6-390 - DOI - PMC - PubMed
    1. HEALTH PROTECTION SURVEILLANCE CENTRE. (2010) Guidelines on the prevention and control of tuberculosis in Ireland 2010 (amended 2014). https://www.hpsc.ie/a-z/vaccinepreventable/tuberculosistb/publications/F....
    1. ANON. Council Directive 64/432/EEC of 26 June 1964 on animal health problems affecting intra-Community trade in bovine animals and swine. Official Journal of the European Communities;1964:121:164–84 https://eur-lex.europa.eu/legal-content/EN/LSU/?uri=CELEX:31964L0432.

LinkOut - more resources