. 2018 Nov 28;9(1):5051.
doi: 10.1038/s41467-018-07360-1.

Preclinical development of a microRNA-based therapy for intervertebral disc degeneration

Affiliations

Preclinical development of a microRNA-based therapy for intervertebral disc degeneration

Ming-Liang Ji et al. Nat Commun. .

Abstract

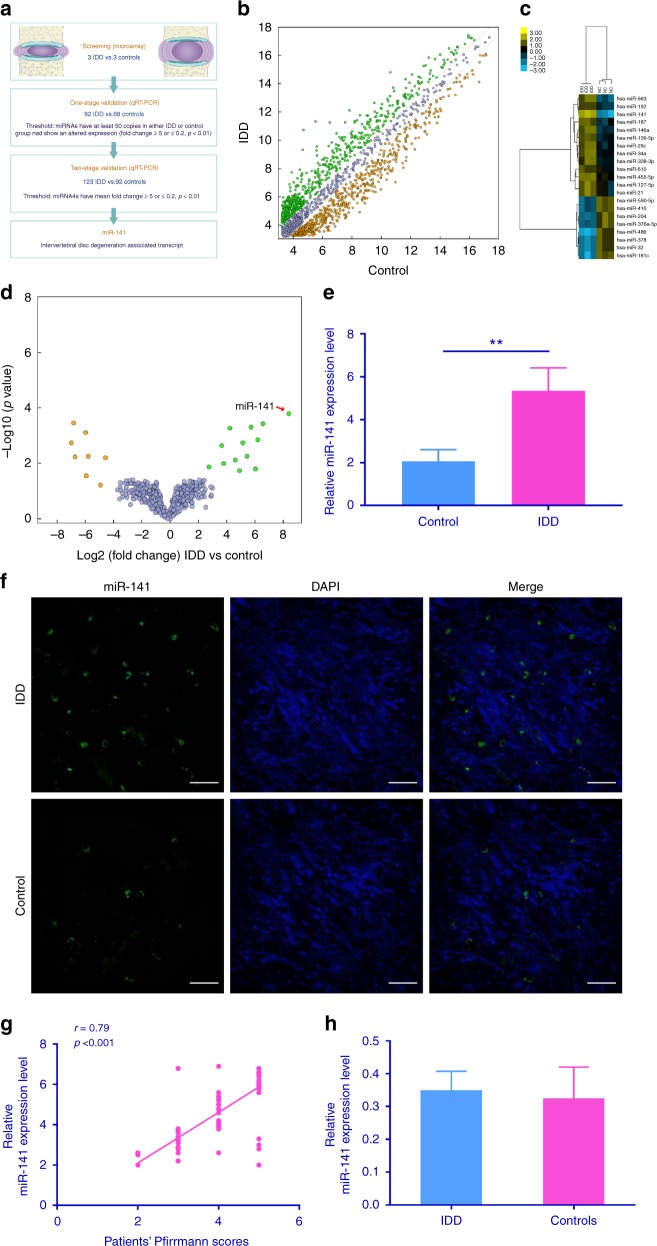
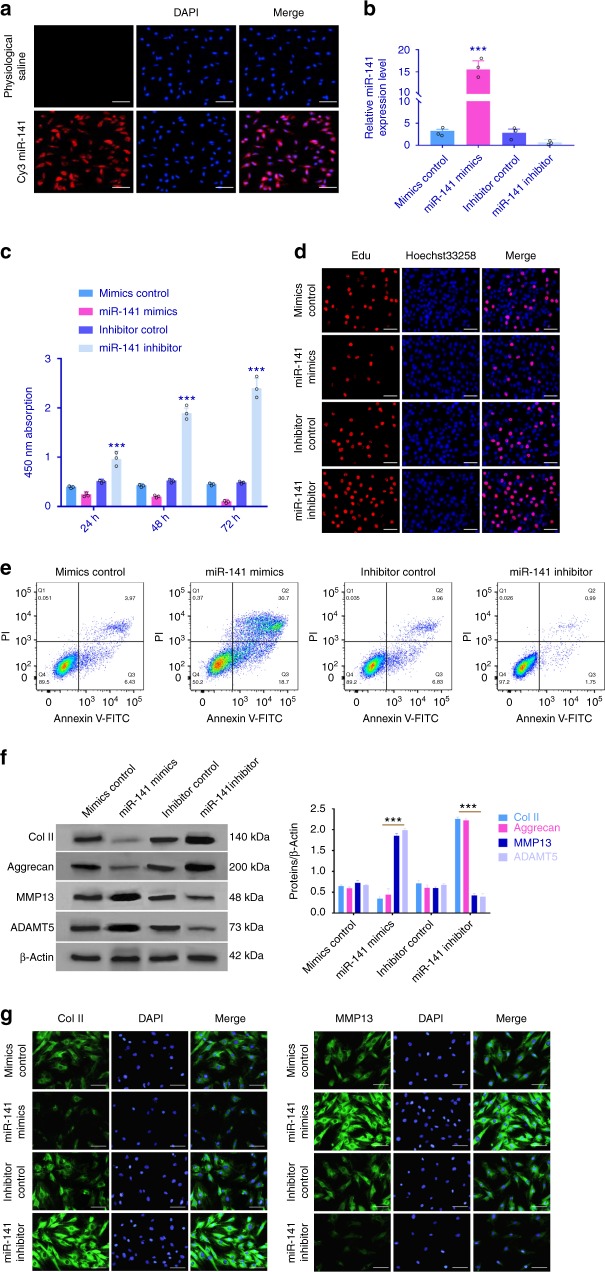
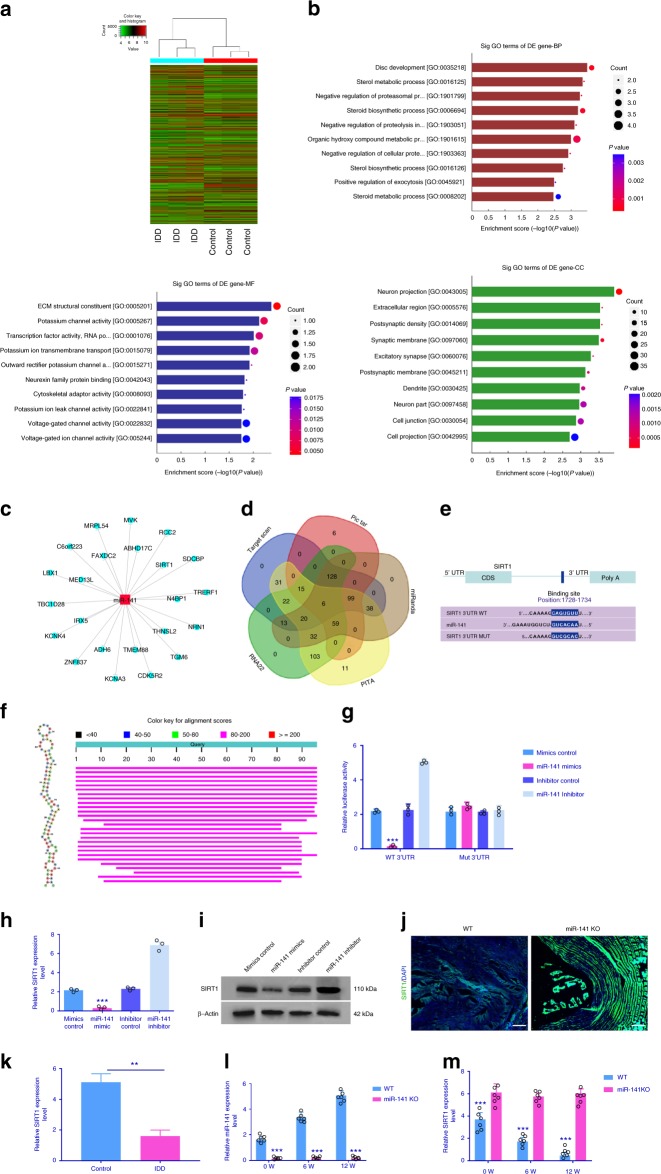
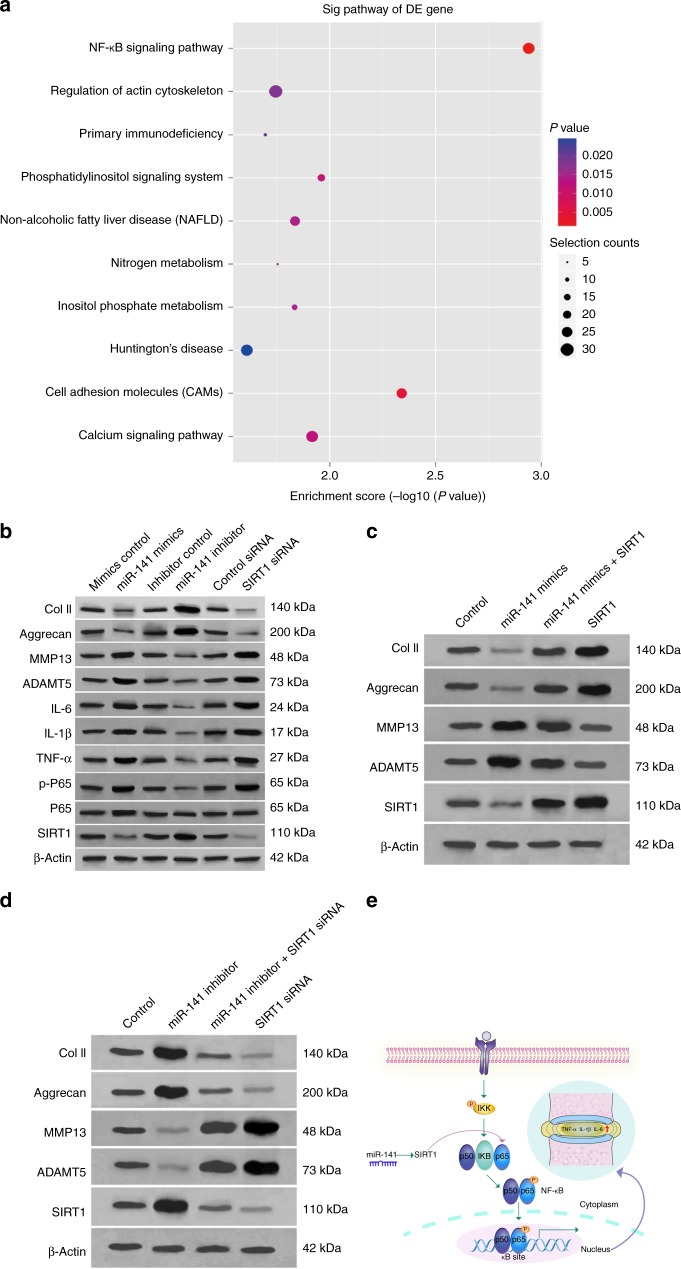
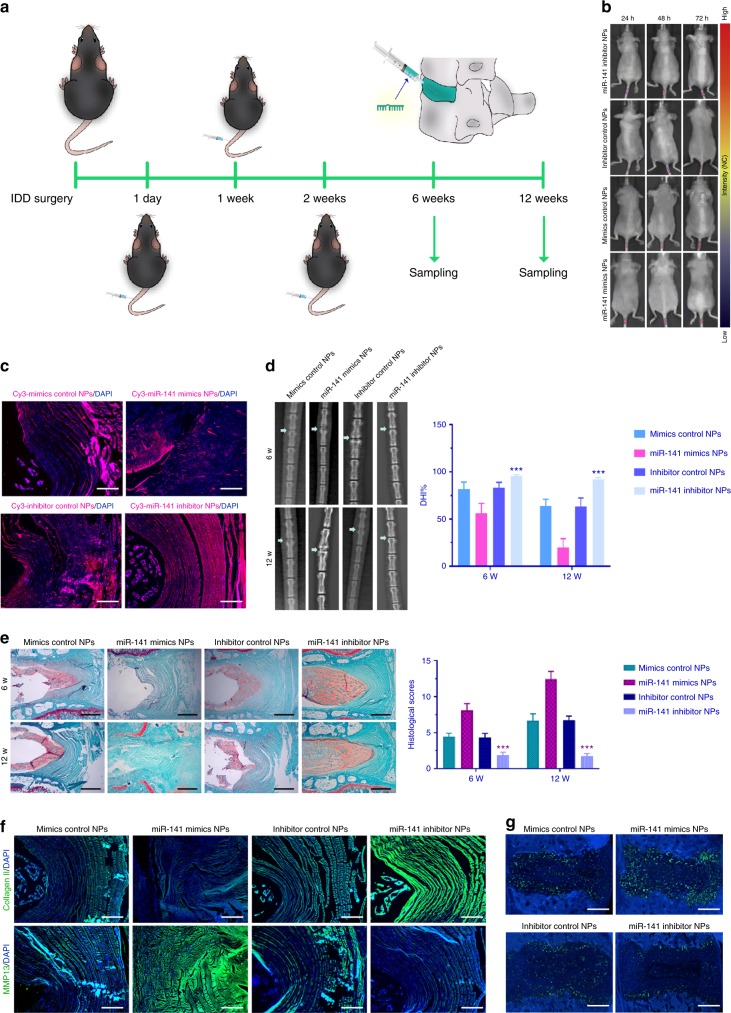
Understanding the molecular mechanisms regulating the maintenance and destruction of intervertebral disc may lead to the development of new therapies for intervertebral disc degeneration (IDD). Here we present evidence from miRNA microarray analyses of clinical data sets along with in vitro and in vivo experiments that miR-141 is a key regulator of IDD. Gain- and loss-of-function studies show that miR-141 drives IDD by inducing nucleus pulposus (NP) apoptosis. Furthermore, miR-141 KO in mice attenuated spontaneous and surgically induced IDD. Mechanistically, miR-141 promotes IDD development by targeting and depleting SIRT1, a negative regulator of NF-κB pathway. Therapeutically, upregulation or downregulation of miR-141 by nanoparticle delivery in IDD model aggravated or alleviated experimental IDD, respectively. Our findings reveal a novel mechanism by which miR-141, in part, promotes IDD progression by interacting with SIRT1/NF-κB pathway. Blockade of miR-141 in vivo may serve as a potential therapeutic approach in the treatment of IDD.


Conflict of interest statement

The authors declare no competing interests.

Figures

Fig. 1
Fig. 1
Identification of differentially expressed miRNAs in NP tissues from IDD patients. a Selection strategy of miRNAs in degenerative NP tissues derived from microarray-based profiling. b Scatter plot of miRNA expression profile between IDD patients and controls (green dots, upregulation more than two-fold; yellow dots, downregulation more than two-fold). c Heat map depicting 21 differentially expressed miRNAs (fold change >5 or <0.2, Benjamini–Hochberg-corrected p). d Volcano plot illustrating the biological and statistical significance of differential miRNA expression levels between IDD patients and controls. The negative Log10-adjusted P values (y axis) are plotted against the Log2 fold changes in expression (x axis). Green dots indicate the upregulated (right side) and yellow dots indicate downregulated (left side) miRNAs. miR-141 is indicated. e Compared with controls (n = 163), miR-141 expression level was upregulated in IDD patients (n = 208). **p < 0.01 by Mann–Whitney U test. f FISH analysis of NP tissues from IDD patients demonstrated increased level of miR-141. Scale bar = 25 μm. g The miR-141 expression level in NP tissues from IDD patients was positively correlated with the disc degeneration grade (n = 208; r = 0.79, p < 0.001). h Concerning miR-141 expression profile in bone surrounding disc, no significant difference was observed between IDD and controls. NP nucleus pulposus, IDD intervertebral disc degeneration, FISH fluorescence in situ hybridization. Data shown as mean and error bar represents s.e.m.
Fig. 2
Fig. 2
Genetic deletion of miR-141 suppresses spontaneous and surgically induced IDD. a Safranin O staining of intervertebral disc from 6-month-old mice (WT, n = 10; miR-141 KO, n = 10), 14-month-old mice (WT, n = 10; miR-141 KO, n = 10), 18-month-old mice (WT, n = 10; miR-141 KO, n = 10), and 22-month-old mice (WT, n = 10; miR-141 KO, n = 10). Scale bar = 50 μm. b The histological grades evaluated at 6, 14, 18, and 22 months in WT and miR-141 KO mice. ***p < 0.001 by unpaired two-sample Student’s t test. c HE and Safranin O staining of disc sections in WT and miR-141 KO mice obtained at 6 and 12 weeks after surgery (WT, n = 10; miR-141 KO, n = 10). HE, scale bar = 50 μm; Safranin O, scale bar = 50 μm. d Histological score of WT and miR-141 KO mice, as measured through Safranin O result. ***p < 0.001 unpaired two-sample Student’s t test. e Immunostaining for collagen II and MMP13 in discs of WT and miR-141 KO mice. Scale bar = 100 μm. Data shown as mean and error bar represents s.e.m.
Fig. 3
Fig. 3
In vitro study of miR-141. a miR-141 transfecting cultured primary human NP cells as confirmed by Cy3. Scale bar = 100 μm. b Forty-eight hours after transfection of miR-141 mimics or inhibitor and their negative control, the cells were used for the following experiments. Transfection efficiency of miR-141 was analyzed using qRT-PCR. n = 3 replicates per group, ***p < 0.001 by one-way ANOVA test followed by Tukey’s post hoc. c, d Cell proliferation was analyzed in miR-141 mimics or inhibitor transfected cultured primary human NP cells using CCK8 and EdU assays. n = 3 replicates per group, ***p < 0.001 by one-way ANOVA test followed by Tukey’s post hoc. Scale bar = 100 μm. e Analysis of NP cells apoptosis was assayed by FCM. n = 3 replicates per group. f The expression levels of Col II, aggrecan, MMP13, and ADAMT5 were detected by western blot. Quantitative analysis was shown on the right, and three independent repeats were performed in each experiment. ***p < 0.001 by one-way ANOVA test followed by Tukey’s post hoc. g The representative Col II and MMP13 were detected by the immunofluorescence. Scale bar = 25 μm. Data shown as mean and error bar represents s.e.m.
Fig. 4
Fig. 4
Identification of SIRT1 as a target of miR-141. a Microarray analysis showing genes that were differentially expressed between IDD and control. b Downregulated GO terms with the most significant p values for biological processes, molecular function, and cellular component. c Cytoscape was employed to confirm the target of miR-141. d Venn diagram displaying miR-141 computationally predicted to target SIRT1 by different algorithms. e Sequence alignment of a putative miR-141-binding site within the 3’UTR of SIRT1 mRNA shows a high level of sequence conservation and complementarity with miR-141. f High conservation of miR-141. g The wild- or mutant-type SIRT1 3’UTR reporter plasmid was co-transfected with miR-141 mimics or inhibitor into cultured primary human NP cells. Forty-eight hours after transfection, luciferase activity was measured. n = 3 replicates per group, ***p < 0.001 by one-way ANOVA test followed by Tukey’s post hoc. hj SIRT1 expression level was detected by qRT-PCR, western blot in primary human NP cells, and immunostaining. ***p < 0.001 by one-way ANOVA test followed by Tukey’s post hoc. Scale bar = 100 μm. k Compared with controls, SIRT1 expression level in IDD patients was lower. **p < 0.01 by Mann–Whitney U test. l, m MiR-141 level in NP tissues from miR-141 KO mice was lower than that in WT mice, while SIRT1 level in NP tissues from miR-141 KO mice was higher than that in WT mice. **p < 0.01 by Mann–Whitney U test. Data shown as mean and error bar represents s.e.m.
Fig. 5
Fig. 5
The modulation of miR-141 on SIRT1/NF-κB signaling pathway. a KEGG analysis demonstrating NF-κB pathway enriched in IDD. b Cultured primary human NP cells were transfected with miR-141 mimics, miR-141 inhibitor, their negative control, control siRNA, or SIRT1 siRNA for 72 h and then the levels of SIRT1, P65, p-P65, TNF-α, IL-1β, IL-6, Col II, aggrecan, MMP13, and ADAMTS-5 were measured by western blotting. c The rescue experiments was established in cultured primary human NP cells to validate the relationship between miR-141 and SIRT1. Inhibition of Col II and Aggrecan expression levels by miR-141 mimics was rescued by restoration of SIRT1 expression. In comparison, inhibition of MMP13 and ADAMT5 expression levels by SIRT1 overexpression was rescued by miR-141 mimics. d Upregulation of Col II and Aggrecan expression levels by miR-141 inhibitor was abolished by silencing of SIRT1 expression. In comparison, upregulation of MMP13 and ADAMT5 expression levels by silencing of SIRT1 was abolished by miR-141 inhibitor. e Schematic representation of mechanisms by which miR-141mediates IDD development. On the basis of findings described in the manuscript, miR-141 downregulates SIRT1 level in NP cells, leading to increased P65 and p-P65. This transcription factor, in turn, leads to increased levels of multiple pro-inflammatory cytokines (TNF-α, IL-1β, IL-6), decreased Col II and aggrecan levels, and increased levels of MMP13 and ADAMTS-5, which induces an imbalance between anabolic and catabolic activities of NP cells. These adverse factors initiate or accelerate IDD
Fig. 6
Fig. 6
Local delivery of miR-141 inhibitor NPs attenuated IDD development. a Overview of the experimental set-up with injections of miR-141 mimics, miR-141 inhibitor, or their negative control NPs at 1, 7, and 14 days after surgery. b In vivo time-dependent fluorescence image in mice at 24, 48, and 72 h after the administration of Cy3-miR-141 NPs. The color bar (from blue to red) indicates the change in fluorescence signal intensity from low to high. c Cy3-tagged miR-141 NPs analysis. Scale bar = 100 μm. d, e The intervertebral disc degeneration evaluated by X-ray and Safranin O staining. A significant increase in DHI% was noted at 6 and 12 weeks post-surgery in mice treated by miR-141 inhibitor NPs. Histological score showed a significant decrease in mice treated by miR-141 inhibitor NPs (6 and 12 weeks post-surgery). Scale bar = 50 μm. ***p < 0.001 by one-way ANOVA test followed by Tukey’s post hoc. n = 12 per group. f Immunostaining for Col II and MMP13 in IDD model treated by miR-141 NPs at 12 weeks. Scale bar = 100 μm. g Apoptotic activity determined by TUNEL staining of discs at 12 weeks. Scale bar = 100 μm. Data shown as mean and error bar represents s.e.m.

Similar articles

Cited by

References

    1. Abajobir AA, et al. Global, regional, and national incidence, prevalence, and years lived with disability for 328 diseases and injuries for 195 countries, 1990-2016: a systematic analysis for the Global Burden of Disease Study 2016. Lancet. 2017;390:1211–1259. doi: 10.1016/S0140-6736(17)32154-2. - DOI - PMC - PubMed
    1. Vos T, et al. Global, regional, and national incidence, prevalence, and years lived with disability for 301 acute and chronic diseases and injuries in 188 countries, 1990–2013: a systematic analysis for the Global Burden of Disease Study 2013. Lancet. 2015;386:743–800. doi: 10.1016/S0140-6736(15)60692-4. - DOI - PMC - PubMed
    1. Roberts S, et al. Histology and pathology of the human intervertebral disc. J. Bone Joint Surg. Am. 2006;88(S2):10–14. - PubMed
    1. Wang J, et al. TNF-α and IL-1β dependent induction of CCL3 expression by nucleus pulposus cells promotes macrophage migration through CCR1. Arthritis Rheum. 2013;65:832–842. doi: 10.1002/art.37819. - DOI - PMC - PubMed
    1. Lv F, et al. In search of nucleus pulposus-specific molecular markers. Rheumatology (Oxf.) 2014;53:600–610. doi: 10.1093/rheumatology/ket303. - DOI - PubMed

Publication types