. 2018 Nov 28;9(1):5052.
doi: 10.1038/s41467-018-07345-0.

Interethnic analyses of blood pressure loci in populations of East Asian and European descent

Fumihiko Takeuchi  1   2 Masato Akiyama  3 Nana Matoba  3 Tomohiro Katsuya  4   5 Masahiro Nakatochi  6 Yasuharu Tabara  7 Akira Narita  8 Woei-Yuh Saw  9   10 Sanghoon Moon  11 Cassandra N Spracklen  12 Jin-Fang Chai  9 Young-Jin Kim  11 Liang Zhang  13 Chaolong Wang  14   15   16 Huaixing Li  17 Honglan Li  18 Jer-Yuarn Wu  19   20 Rajkumar Dorajoo  14 Jovia L Nierenberg  21 Ya Xing Wang  22 Jing He  23 Derrick A Bennett  24 Atsushi Takahashi  3   25 Yukihide Momozawa  26 Makoto Hirata  27 Koichi Matsuda  28 Hiromi Rakugi  5 Eitaro Nakashima  29   30 Masato Isono  2 Matsuyuki Shirota  8 Atsushi Hozawa  8 Sahoko Ichihara  31 Tatsuaki Matsubara  32 Ken Yamamoto  33 Katsuhiko Kohara  34 Michiya Igase  35 Sohee Han  11 Penny Gordon-Larsen  36   37 Wei Huang  38 Nanette R Lee  39   40 Linda S Adair  36   37 Mi Yeong Hwang  11 Juyoung Lee  11 Miao Li Chee  13 Charumathi Sabanayagam  13   41   42 Wanting Zhao  13   15 Jianjun Liu  14   43 Dermot F Reilly  44 Liang Sun  17 Shaofeng Huo  17 Todd L Edwards  23 Jirong Long  23 Li-Ching Chang  19 Chien-Hsiun Chen  19 Jian-Min Yuan  45   46 Woon-Puay Koh  9   47 Yechiel Friedlander  48 Tanika N Kelly  21 Wen Bin Wei  49 Liang Xu  22 Hui Cai  23 Yong-Bing Xiang  18 Kuang Lin  24 Robert Clarke  24 Robin G Walters  24 Iona Y Millwood  24   50 Liming Li  51   52 John C Chambers  53 Jaspal S Kooner  54 Paul Elliott  55   56   57   58   59 Pim van der Harst  60 International Genomics of Blood Pressure (iGEN-BP) ConsortiumZhengming Chen  24 Makoto Sasaki  61 Xiao-Ou Shu  23 Jost B Jonas  22   62 Jiang He  21   63 Chew-Kiat Heng  64   65 Yuan-Tsong Chen  19 Wei Zheng  23 Xu Lin  17 Yik-Ying Teo  9   10   66 E-Shyong Tai  9   15   43 Ching-Yu Cheng  13   41   42 Tien Yin Wong  13   41   42 Xueling Sim  9 Karen L Mohlke  12 Masayuki Yamamoto  8 Bong-Jo Kim  11 Tetsuro Miki  35 Toru Nabika  67 Mitsuhiro Yokota  68 Yoichiro Kamatani  3   69 Michiaki Kubo  70 Norihiro Kato  71   72
Collaborators, Affiliations

Interethnic analyses of blood pressure loci in populations of East Asian and European descent

Fumihiko Takeuchi et al. Nat Commun. .

Abstract

Blood pressure (BP) is a major risk factor for cardiovascular disease and more than 200 genetic loci associated with BP are known. Here, we perform a multi-stage genome-wide association study for BP (max N = 289,038) principally in East Asians and meta-analysis in East Asians and Europeans. We report 19 new genetic loci and ancestry-specific BP variants, conforming to a common ancestry-specific variant association model. At 10 unique loci, distinct non-rare ancestry-specific variants colocalize within the same linkage disequilibrium block despite the significantly discordant effects for the proxy shared variants between the ethnic groups. The genome-wide transethnic correlation of causal-variant effect-sizes is 0.898 and 0.851 for systolic and diastolic BP, respectively. Some of the ancestry-specific association signals are also influenced by a selective sweep. Our results provide new evidence for the role of common ancestry-specific variants and natural selection in ethnic differences in complex traits such as BP.


Conflict of interest statement

The authors declare no competing interests.

Figures
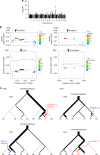
Fig. 1
Fig. 1
Interethnic heterogeneity of genetic impact of SBP. a Manhattan plot showing results for genome-wide scan of genetic impact heterogeneity. The genetic impact at transethnic SNPs were compared between two populations of different ancestries using GWAS data sets. b Regional plots on 12q24 and 10q21, where there were multiple SNPs with significant (P < 5×10⁻⁸) evidence for interethnic heterogeneity (see Supplementary Data 6). Bordered circles represent SNPs with significant interethnic heterogeneity. Transethnic SNPs were plotted in two panels at each locus; genetic impacts of each SNP are denoted separately for Europeans (EUR, top panel) and East Asians (EAS, bottom panel) on 12q24 (left) and 10q21 (right) such that genetic impacts in Europeans are positive. In the individual regional plots, the correlation of ancestry-specific sentinel SNP to other SNPs at the locus is shown on a scale from minimal (blue) to maximal (red); the sentinel SNPs thus benchmarked are rs3184504 (EUR specific) and rs671 (EAS specific) on 12q24 and rs4590817 (EUR specific) and rs145193831 (EAS specific) on 10q21. The position of ancestry-specific sentinel SNP is indicated by an arrow head. c Phylogenetic relationships of ancestry-specific sentinel SNPs with transethnic haplotypes detectable in Europeans (top) and East Asians (bottom) on 12q24 (left) and 10q21 (right). Each node corresponds to a haplotype and the SNPs appear on the edges. The edge width reflects the haplotype frequency in the corresponding ethnic groups. At each locus, blood pressure increasing and decreasing haplotypes and derived, ancestry-specific alleles are colored in red and blue, respectively
Fig. 2
Fig. 2
Transethnic genetic correlation and SNP-based heritability. SNP-based heritability of SBP, DBP and other complex disease and phenotype traits is shown separately for East Asians (EAS) and Europeans (EUR) by using the published GWAS summary statistics (Supplementary Table 6). The whiskers are 95% confidence intervals of each value
Fig. 3
Fig. 3
Distribution of SNP effect-size in GWAS and power of GWAS. They are compared between East Asians and Europeans for DBP, low-density lipoprotein cholesterol (LDL-C), type 2 diabetes (T2D), body mass index (BMI) and height. a Distribution of SNP effect-size in actual GWAS conducted in East Asians (x-axis) and Europeans (y-axis). The effect-size of an SNP was standardized such that each of the trait and allele has a unit variance. The standardized effect-size equals the genetic impact. A positive effect-size indicates a higher trait value for the ALT allele compared to the REF allele of the 1000 Genomes (1000G) phase-3 data set. The horizontal and vertical bars to the bottom and right of the plots indicate the range of effect-sizes, in which genome-wide significant SNPs are localized. b The expected numbers of genome-wide significant loci detectable in a single GWAS and their interethnic overlap. The number of SNPs was scaled to 1000G SNPs even for GWAS in which HapMap-derived SNPs were assayed. SNPs located ≤500 kb were regarded to be at the same susceptibility locus. The numbers of loci were inferred from the heritability model shown in Supplementary Fig. 13, where true observable effect-sizes were computed based on 100 trials of random sampling under the assumed heritability parameters (see Methods)
Fig. 4
Fig. 4
Interethnic compatibility of GWAS results for DBP, LDL-C, T2D, BMI, and height. Each point in the plots represents a sentinel SNP with genome-wide significance in the GWAS summary statistics (Supplementary Table 6), plotted with its standardized effect-size (in y-axis) against minor allele frequency (in x-axis) for East Asians (EAS in the left column) and Europeans (EUR in the right column). SNPs specific to either of the ethnic groups are colored in red; ancestry-specific association was defined such that the sentinel SNPs at the corresponding loci reached genome-wide significance (P < 5×10⁻⁸) in one ethnic group but were non-polymorphic or rare (MAF < 0.05) in another ethnic group
Fig. 5
Fig. 5
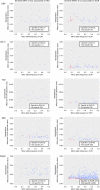
Examples of positive selection in East Asians. Selected haplotype forms are shown at five loci positively selected in East Asians. The five loci are near the following SNPs (or genes): a rs12748152 (ZDHHC18), b rs17031005 (THADA), c rs3868143 (KCTD19), d rs1548740 (TANC2) and e rs4253772 (PPARA). Selected haplotypes were identified by haploPS at five sentinel SNPs out of 63 ancestry-specific loci that were identified for complex traits. In the five chromosomal regions each containing the SNP (or locus) of interest, haploPS analyses were performed across a range of core haplotype frequencies from 5 to 95%, with a frequency step size of 5%, in East Asians (including JPT, MAS, CHB, CHS and CHD) as well as Europeans (CEU) and Nigerians in West Africa (YRI) of the HapMap Phase III populations. This yielded the longest haplotype exclusively in East Asians and provided an estimate for the selected allele in its respective population, as shown in the top of each panel. For each locus, haploPS additionally located on the haplotype form on which the advantageous allele is likely to reside; each nucleotide was colored differently, adenine in green, cytosine in blue, guanine in yellow and thymine in red. In each panel, the red vertical bar indicates the position of target SNP, and gene locations (green horizontal bars) are superimposed at the bottom. At two loci, proxy SNPs in complete LD (r2 = 1.00 in EAS) with the sentinel SNPs were used for the analysis; rs3868143 and rs1548740 were used instead of rs11862222 and rs56174355, respectively, because of the genotype data unavailability

References

    1. GBD 2016 Risk Factors Collaborators. Global, regional, and national comparative risk assessment of 84 behavioural, environmental and occupational, and metabolic risks or clusters of risks, 1990-2016: a systematic analysis for the Global Burden of Disease Study 2016. Lancet390, 1345–1422 (2017). - PMC - PubMed
    1. Forouzanfar MH, et al. Global burden of hypertension and systolic blood pressure of at least 110 to 115 mm Hg, 1990−2015. JAMA. 2017;317:165–182. doi: 10.1001/jama.2016.19043. - DOI - PubMed
    1. International Consortium for Blood Pressure Genome-Wide Association Studies et al. Genetic variants in novel pathways influence blood pressure and cardiovascular disease risk. Nature478, 103−109 (2011). - PMC - PubMed
    1. Ehret GB, et al. The genetics of blood pressure regulation and its target organs from association studies in 342,415 individuals. Nat. Genet. 2016;48:1171–1184. doi: 10.1038/ng.3667. - DOI - PMC - PubMed
    1. Surendran P, et al. Trans-ancestry meta-analyses identify rare and common variants associated with blood pressure and hypertension. Nat. Genet. 2016;48:1151–1161. doi: 10.1038/ng.3654. - DOI - PMC - PubMed

Publication types