. 2018 Nov 28;9(1):5026.
doi: 10.1038/s41467-018-07313-8.

The Trithorax protein Ash1L promotes myoblast fusion by activating Cdon expression

Affiliations

The Trithorax protein Ash1L promotes myoblast fusion by activating Cdon expression

Ilaria Castiglioni et al. Nat Commun. .

Abstract

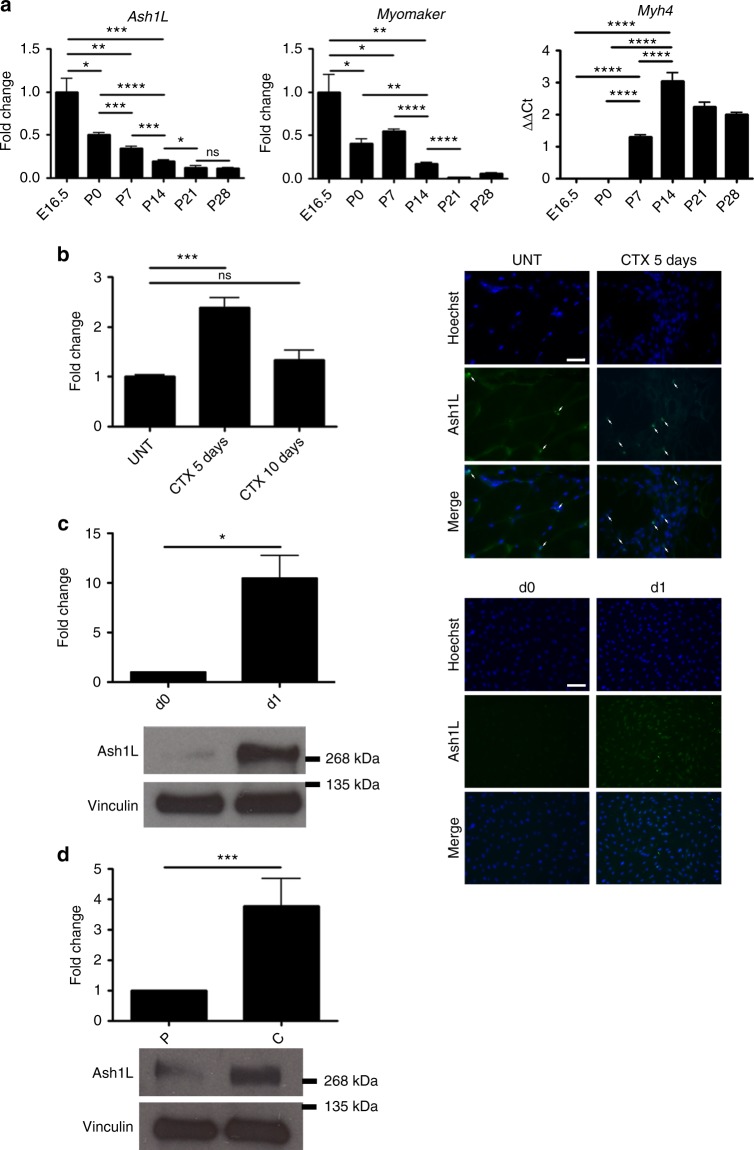
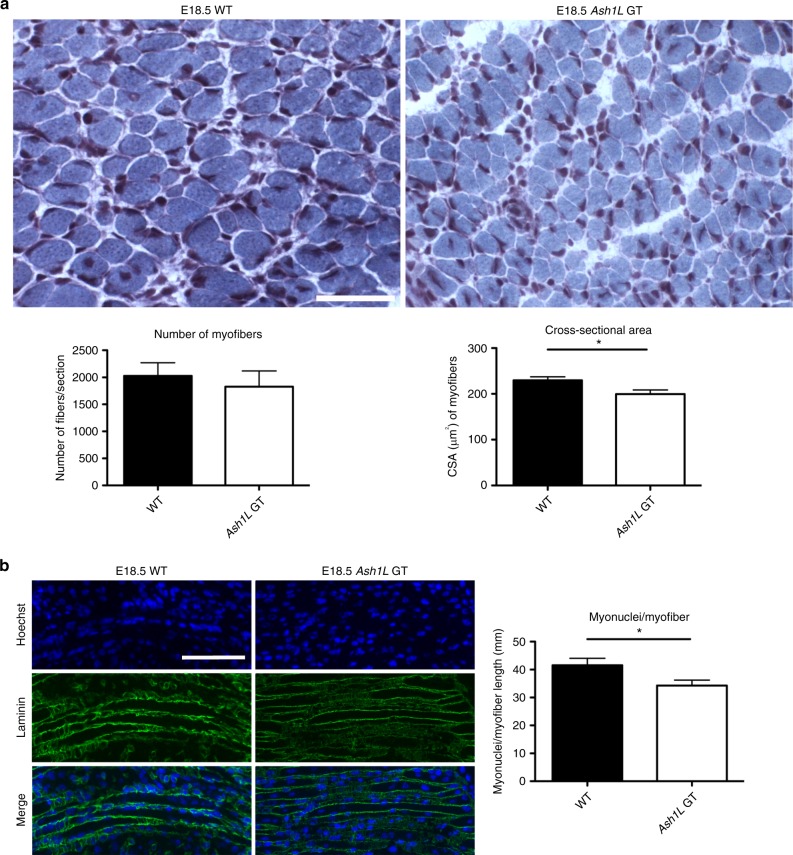
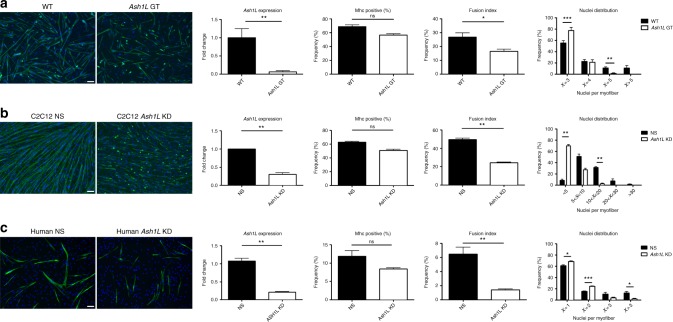
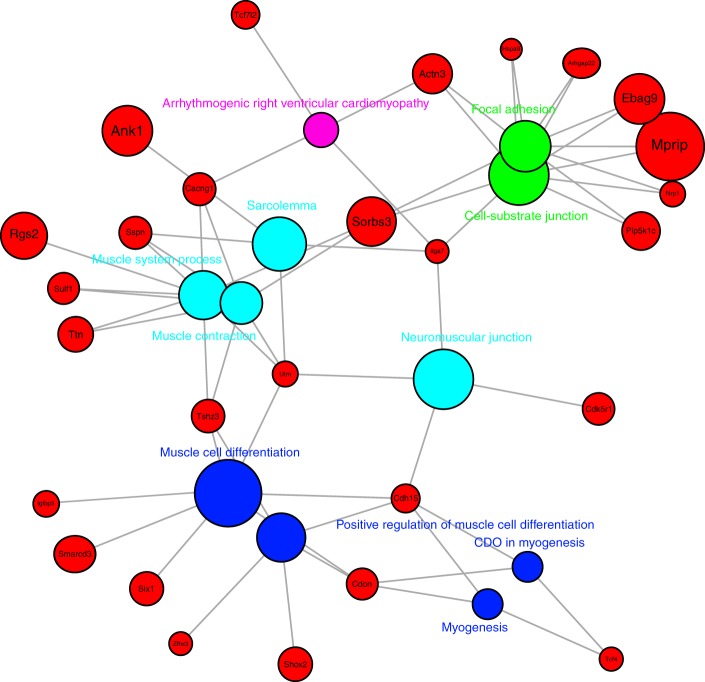
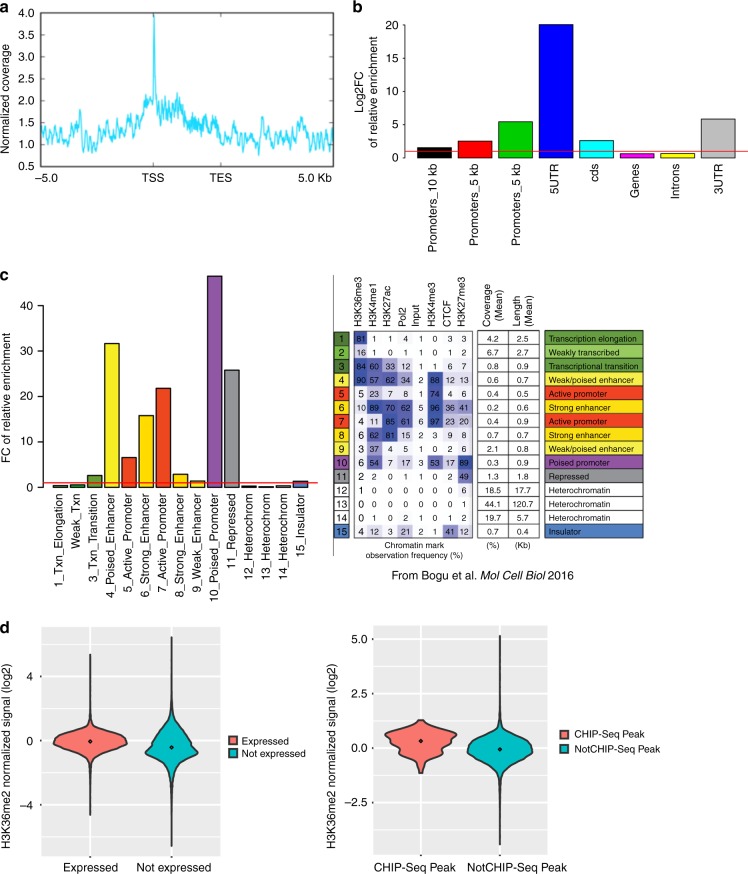
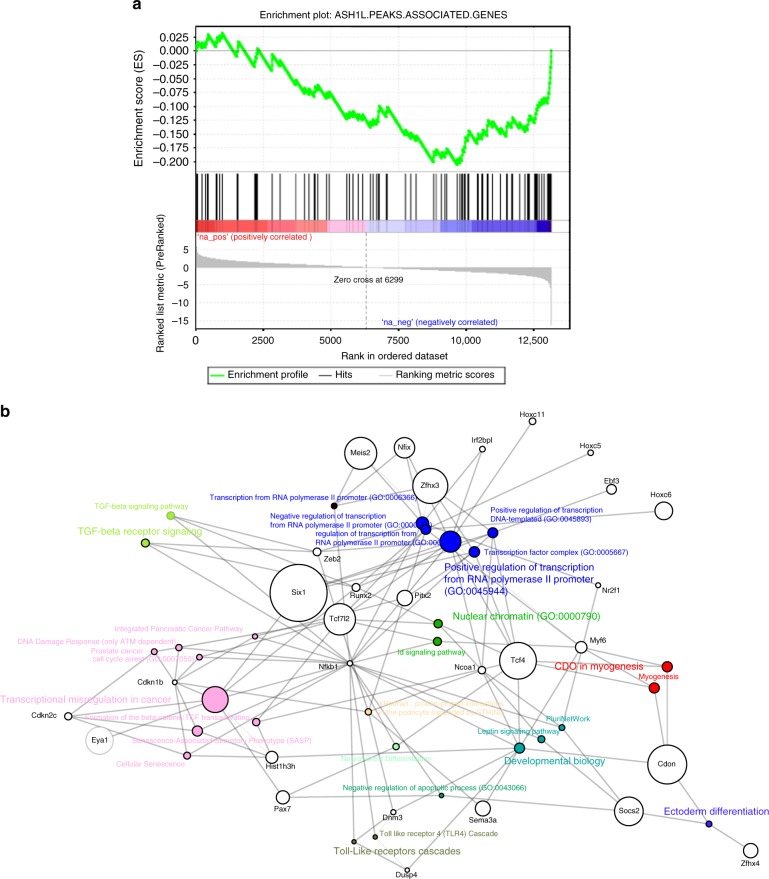
Myoblast fusion (MF) is required for muscle growth and repair, and its alteration contributes to muscle diseases. The mechanisms governing this process are incompletely understood, and no epigenetic regulator has been previously described. Ash1L is an epigenetic activator belonging to the Trithorax group of proteins and is involved in FSHD muscular dystrophy, autism and cancer. Its physiological role in skeletal muscle is unknown. Here we report that Ash1L expression is positively correlated with MF and reduced in Duchenne muscular dystrophy. In vivo, ex vivo and in vitro experiments support a selective and evolutionary conserved requirement for Ash1L in MF. RNA- and ChIP-sequencing indicate that Ash1L is required to counteract Polycomb repressive activity to allow activation of selected myogenesis genes, in particular the key MF gene Cdon. Our results promote Ash1L as an important epigenetic regulator of MF and suggest that its activity could be targeted to improve cell therapy for muscle diseases.


Conflict of interest statement

The authors declare no competing interests.

Figures

Fig. 1
Fig. 1
Correlation between Ash1L expression and myoblast fusion. a Ash1L expression during muscle development. RT-qPCR analysis on muscle tissue from hindlimbs of mice from the embryonic stage E16.5 to adulthood (p28). Expression analysis of Myomaker, as a positive fusion gene, and adult myosin (Myh4) as a positive control for adult stages. Unpaired two-tailed t test. Confidence intervals 95%. n = 6. b Ash1L expression in regenerating muscle tissue. RT-qPCR analysis of Ash1L expression in tibialis anterior of wild-type adult mice, untreated (UNT), or 5 and 10 days after cardiotoxin (CTX) injection (left panel). Immunofluorescence for Ash1L (in green) and nuclear staining (Hoechst), in transverse cryosections from the tibialis anterior muscles of injured wild-type mice, 5 days after cardiotoxin injection (CTX 5 days) compared to untreated controls (Unt). Scale bar, 50 μm. Magnification ×65. Arrows indicate the Ash1L-positive nuclei. Unpaired two-tailed t test. Confidence intervals 95%. n = 4. c Ash1L protein level during in vitro muscle differentiation. Immunoblot of C2C12 cells at days 0 and 1, and densitometric analysis of Ash1L signal relative to vinculin as housekeeping protein (left panel). Immunofluorescence for Ash1L (in green) and nuclear staining (Hoechst), in C2C12 cells at days 0 and 1 of in vitro muscle differentiation. Scale bar, 100 μm. Magnification ×20. Paired two-tailed t test. Confidence intervals 95%. Data are the mean for three independent experiments. d Ash1L protein level in proliferating myoblasts vs. confluent cells. Comparison between proliferating myoblasts (P) and confluent cells (C). Paired two-tailed t test. Confidence intervals 95%. Data are the mean for three independent experiments. Source data are provided as a Source Data file. *p ≤ 0.05, **p ≤ 0.01, ***p ≤ 0.001, ****p ≤ 0.0001. NS not significant
Fig. 2
Fig. 2
Ash1L GT mice display muscle hypoplasia. a Gomori-trichrome staining of transverse cryosections from wild-type (WT) and Ash1L GT mice, at embryonic stage E18.5 (upper panel). Quantification of: the total number of myofibers and myofibers cross-sectional area (CSA) (lower panel). n = 3. Scale bar, 100 µm, magnification ×20. Unpaired two-tailed t test. Confidence intervals 95%. Results come from six biological replicates. b Immunofluorescence for laminin (in green) and nuclear staining (Hoechst) in longitudinal cryosections from wild-type (WT) and Ash1L GT mice, at the embryonic stage of E18.5 (left panel). Quantification of the number of myonuclei normalized on myofiber length in mm (myonuclei/myofibers) (right panel). Scale bar, 100 µm, magnification ×20. Unpaired two-tailed t test. Confidence intervals 95%. Results come from seven biological replicates. Source data are provided as a Source Data file. *p ≤ 0.05
Fig. 3
Fig. 3
Effects of Ash1L ablation on myoblast fusion. a Primary myoblasts isolated from Ash1L GT mice display a fusion defect. Immunofluorescence for myosin heavy chain (in green) and nuclear staining (Hoechst) in primary cultures from wild-type (WT) and Ash1L GT mice at E18.5 stage, after inducing differentiation for 48 h. Scale bar, 100 µm. RT-qPCR analysis of Ash1L expression, validating Ash1L ablation in GT mice compared to wild-type mice. Percentage of Mhc-positive cells, calculated in comparison with the total number of nuclei. Fusion index, calculated as the number of nuclei present in myotubes (Mhc-positive and containing at least three nuclei) in comparison with the total number of nuclei. Nuclei distribution, calculated as the frequency of Mhc-positive cells containing the indicated number of nuclei. Unpaired two-tailed t test. Confidence intervals 95%. Results come from five biological replicates. b Ash1L knockdown leads to a muscle fusion defect. Immunofluorescence for myosin heavy chain and nuclear staining in C2C12 cells transfected with non-targeting (NS) and Ash1L siRNAs (Ash1L KD) and differentiated for 3 days. Scale bar, 100 µm. Ash1L expression, percentage of Mhc-positive cells, fusion index, and nuclei distribution evaluated as described above. Unpaired two-tailed t test. Confidence intervals 95%. Results come from three biological replicates. c Muscle fusion defect upon Ash1L knockdown is conserved in human. Immunofluorescence for myosin heavy chain and nuclear staining in human primary myoblast transfected with non-targeting (human NS) and Ash1L siRNAs (human Ash1L KD) and differentiated for 4 days. Scale bar, 100 µm. Ash1L expression, percentage of MHC-positive cells, fusion index, and nuclei distribution evaluated as described above. Unpaired two-tailed t test. Confidence intervals 95%. Results come from three healthy subjects. Source data are provided as a Source Data file. *p ≤ 0.05, **p ≤ 0.01, ***p ≤ 0.001. NS not significant
Fig. 4
Fig. 4
Pathways significantly downregulated by Ash1L ablation. Bipartite graph showing significantly enriched categories (KEGG, Biocarta, WikiPathways, Reactome, GO BP/MF/CC) (FDR <0.05, Z-score <−1.75, and n ≥ 3) and their associated genes within the 100 downregulated genes (FDR <0.1) in Ash1L KD myoblasts. The size of the gene nodes is proportional to the log 2 FC of downregulation, while the size of the category nodes is proportional to the significance of enrichment (−log 10 Adj. p value)
Fig. 5
Fig. 5
Distribution of Ash1L peaks and overlapping between Ash1L and Polycomb targets. a Ash1L ChIP-seq signal distribution over the scaled gene bodies (3 kb) of its targets showing enrichment around the TSS. One representative replicate of the three is shown. b Relative enrichment (log 2 FC) of Ash1l ChIP-seq peaks in classically defined genomic regions (promoters, 5′-UTR, CDS, genes, introns, and 3′-UTR). c Relative enrichment (FC) of Ash1L ChIP-seq peaks in genome-wide chromatin segments as found in Bogu et al. (right panel reproduced with permission from American Society for Microbiology) in a union of mouse tissues using chromHMM tool. d Violin plots of normalized H3K36me2 signal over gene bodies of either expressed/unexpressed in myoblasts (left panel) or Ash1L peaks/not Ash1L peaks genes (right panel). Signal has been normalized against H3 ChIP control sample and three replicates averaged. Mann–Whitney p value was used for comparison
Fig. 6
Fig. 6
Identification of direct Ash1L targets. a Gene set enrichment analysis enrichment plot for Ash1L ChIP-seq peak-associated genes (n = 146, 96 expressed in myoblasts) obtained from the gene list pre-ranked according to the log 2 FC in myoblast KD vs. NS RNA-seq experiment. The leading edge analysis identified 45 genes as significantly downregulated and correlated to Ash1L binding. b Bipartite graph showing significantly enriched categories (KEGG, Biocarta, WikiPathways, Reactome, GO BP/MF/CC) (FDR <0.05, Z-score <−1.75, and n ≥ 3) and their associated genes within the 45 direct targets identified with the GSEA analysis in a. The size of the gene nodes is proportional to the log 2 FC of downregulation, while the size of the category nodes is proportional to the significance of enrichment (−log 10 Adj. p value)
Fig. 7
Fig. 7
The fusion gene Cdon is a direct target of Ash1L. Cdon expression positively correlates with Ash1L during muscle development (a) and regeneration (b). RT-qPCR analysis on muscle tissue from hindlimbs of mice from the embryonic stage E16.5 to adulthood and in tibialis anterior of wild-type adult mice, untreated (UNT), or 5 and 10 days after cardiotoxin (CTX) injection. Unpaired two-tailed t test. Confidence intervals 95%. n = 6 (a), n = 4 (b). c Cdon protein level during in vitro muscle differentiation and in proliferating myoblasts vs. confluent cells. Immunoblot of C2C12 cells at days 0 and 1, and densitometric analysis of Cdon signal relative to vinculin as housekeeping protein (left panel). Comparison between proliferating myoblasts (P) and confluent cells (C) (right panel). Paired two-tailed t test. Confidence intervals 95%. Data are the mean for three independent experiments. d RT-qPCR analysis comparing Cdon expression in the presence and absence of Ash1L in three different models: muscle tissue from hindlimbs of wild-type (WT) and Ash1L GT embryos at E18.5, C2C12 cells transfected with non-targeting (NS) or Ash1L siRNAs (Ash1L KD), and human primary cells transfected with non-targeting or Ash1L siRNAs, and collected at day 1 of differentiation. Unpaired two-tailed t test. Confidence intervals 95%. n = 6 (muscle tissue), four independent experiments (C2C12 cells), and three independent healthy subjects (human samples). e Western blotting analysis showing Cdon downregulation in muscle tissue from hindlimbs of Ash1L GT embryos at E18.5 compared to wild type (WT), and in C2C12 cells transfected with Ash1L siRNAs (Ash1L KD) compared to control (NS). Densitometric analysis of both Ash1L and Cdon signals relative to vinculin as housekeeping protein are reported on the right. Paired one-tailed t test. Confidence intervals 95%. n = 3 (muscle tissue), three independent experiments (C2C12 cells). f Ash1L specifically binds to Cdon genomic region. Genome browser representation of Ash1L ChIP-seq peaks (from three replicates), at Cdon genomic region. Relative positions of both positive and negative regions are shown at the bottom (left). Chromatin immunoprecipitation on C2C12 cells transfected with non-targeting (NS) or Ash1L siRNAs (Ash1L KD), and fixed at day 1 of differentiation, using Ash1L antibody and IgG as a negative control. qPCR analysis on positive and negative regions according to ChIP-sequencing results (right). Unpaired two-tailed t test. Confidence interval 95%. n = 3. Source data are provided as a Source Data file. *p ≤ 0.05, **p ≤ 0.01, ***p ≤ 0.001
Fig. 8
Fig. 8
Cdon expression rescues fusion defects caused by Ash1L knockdown. a Immunofluorescence for myosin heavy chain and nuclear staining in C2C12 cells treated with two consecutive rounds of transient transfections: non-targeting (NS) or Ash1L siRNAs (Ash1L KD), and empty vector (EV) or Cdon-expressing vector (Cdon OE), before inducing differentiation for 3 days (left). Scale bar, 100 µm. b RT-qPCR analysis of Ash1L and Cdon expression in C2C12 cells transfected with: empty vector plus non-targeting siRNAs (EV + NS), empty vector plus Ash1L siRNAs (EV + Ash1L KD), Cdon-expressing vector plus non-targeting siRNAs (Cdon OE + NS), and Cdon-expressing vector +Ash1L siRNAs (Cdon OE + Ash1L KD). c Fusion index and nuclei distribution for each condition were calculated as described for Fig. 3. Unpaired two-tailed t test. Confidence intervals 95%. n = 3. Source data are provided as a Source Data file. *p ≤ 0.05, **p ≤ 0.01, ***p ≤ 0.001. NS not significant

References

    1. Hernandez JM, Podbilewicz B. The hallmarks of cell-cell fusion. Development. 2017;144:4481–4495. doi: 10.1242/dev.155523. - DOI - PubMed
    1. Schwartz YB, et al. Alternative epigenetic chromatin states of polycomb target genes. PLoS Genet. 2010;6:e1000805. doi: 10.1371/journal.pgen.1000805. - DOI - PMC - PubMed
    1. Raj I, et al. Structural basis of egg coat-sperm recognition at fertilization. Cell. 2017;169:1315–1326 e1317. doi: 10.1016/j.cell.2017.05.033. - DOI - PMC - PubMed
    1. Ohto U, et al. Structure of IZUMO1-JUNO reveals sperm-oocyte recognition during mammalian fertilization. Nature. 2016;534:566–569. doi: 10.1038/nature18596. - DOI - PubMed
    1. Pajcini KV, Pomerantz JH, Alkan O, Doyonnas R, Blau HM. Myoblasts and macrophages share molecular components that contribute to cell–cell fusion. J. Cell Biol. 2008;180:1005–1019. doi: 10.1083/jcb.200707191. - DOI - PMC - PubMed

Publication types