. 2018 Nov 28;9(1):5034.
doi: 10.1038/s41467-018-07368-7.

Disease-associated genotypes of the commensal skin bacterium Staphylococcus epidermidis

Affiliations

Disease-associated genotypes of the commensal skin bacterium Staphylococcus epidermidis

Guillaume Méric et al. Nat Commun. .

Abstract

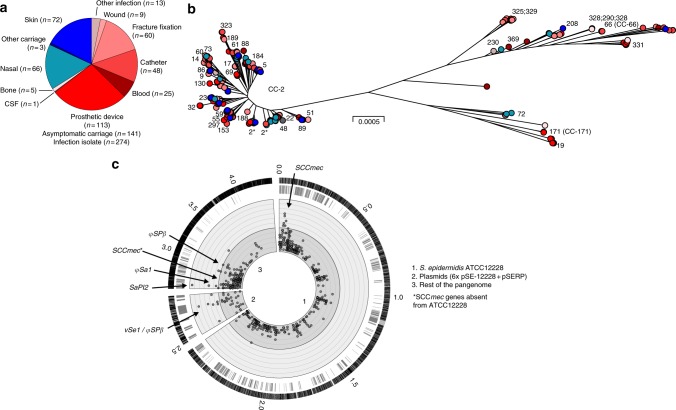
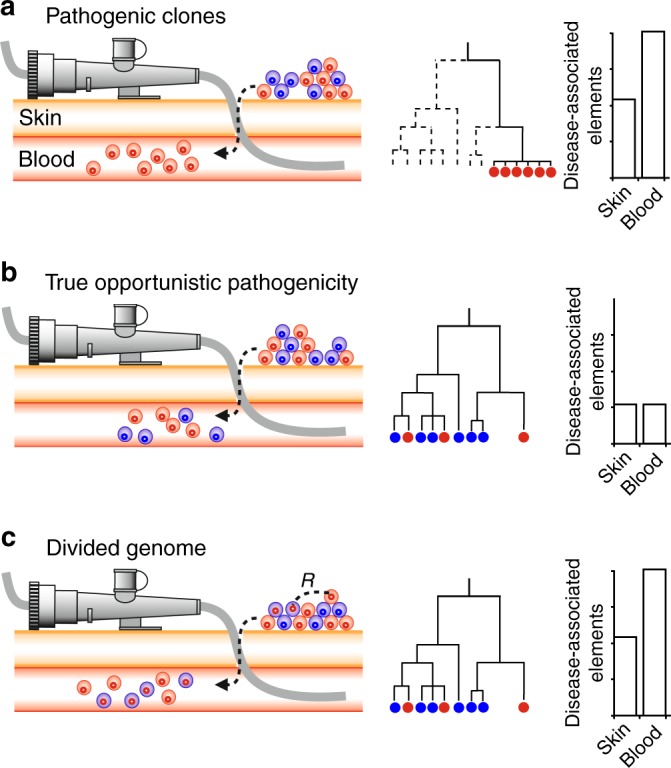
Some of the most common infectious diseases are caused by bacteria that naturally colonise humans asymptomatically. Combating these opportunistic pathogens requires an understanding of the traits that differentiate infecting strains from harmless relatives. Staphylococcus epidermidis is carried asymptomatically on the skin and mucous membranes of virtually all humans but is a major cause of nosocomial infection associated with invasive procedures. Here we address the underlying evolutionary mechanisms of opportunistic pathogenicity by combining pangenome-wide association studies and laboratory microbiology to compare S. epidermidis from bloodstream and wound infections and asymptomatic carriage. We identify 61 genes containing infection-associated genetic elements (k-mers) that correlate with in vitro variation in known pathogenicity traits (biofilm formation, cell toxicity, interleukin-8 production, methicillin resistance). Horizontal gene transfer spreads these elements, allowing divergent clones to cause infection. Finally, Random Forest model prediction of disease status (carriage vs. infection) identifies pathogenicity elements in 415 S. epidermidis isolates with 80% accuracy, demonstrating the potential for identifying risk genotypes pre-operatively.


Conflict of interest statement

The authors declare no competing interests.

Figures

Fig. 1
Fig. 1
Phenotype correlated GWAS and risk prediction. Genome-wide association studies (GWAS) can identify numerous SNPs associated with complex traits but these can be difficult to interpret. For example, pathogenicity is multifactorial, potentially involving genes underlying phenotypes that promote transmission, virulence, immune evasion, antimicrobial resistance etc. In some bacteria, specific phenotypes known to contribute to pathogenicity can be measured in laboratory assays, providing a basis for quantitative analysis of disease dynamics. We developed a method in which k-mers from a primary GWAS analysis (asymptomatic carriage vs. infection isolates) were correlated with data from four relevant phenotype assays: biofilm formation (blue); cell toxicity (yellow); methicillin resistance (red); IL-8 production by host cells (purple). Using Fisher’s exact test, k-mers from primary GWAS were correlated with laboratory phenotype using a 2 × 2 table in which rows indicated presence/absence of the k-mer and columns indicated upper and lower percentile in the laboratory phenotype assay. The resulting P-values, derived for each k-mer, help to link k-mers in the primary GWAS with quantifiable pathogenicity-related phenotypes. Patterns of k-mer presence and absence can be used as classifiers in a random forest model to identify the best predictors of infection
Fig. 2
Fig. 2
Population structure and genome-wide association study of S. epidermidis pathogenicity. a Isolation source of 274 infection and 141 asymptomatic carriage isolates. Shades of red correspond to the broad infection phenotype, shades of blue to the broad asymptomatic carriage phenotype. b Phylogenetic tree of 415 S. epidermidis isolates, reconstructed using an approximation of the maximum-likelihood algorithm (FastTree2) from a core genome alignment (n = 1946 genes shared by all isolates). Colours correspond to those used in panel A. Numbers correspond to sequence-types (STs) according to the Miragaia MLST scheme (https://pubmlst.org/sepidermidis/). c Pangenomic position of GWAS results. Ticks in the outer ring represent the pangenomic position of genes in the S. epidermidis ATCC12228 reference genome, seven plasmid genomes, and the rest of the pangenome inferred in this study. Ticks in the second layer show the position of genes containing associated k-mers in the GWAS. Grey circles are shown for the most statistically associated (lowest p-value) k-mer mapping to that gene. The threshold for significance (Fisher exact test) was P-value = 0.0001 (inner circle). Concentric rings emanating from this threshold correspond to incremental reductions in P-values from 1 × 10-4 to 5 × 10-7 (dark grey rings) and values < 5 × 10-7 (light grey rings). The position of genes in well-known pathogenicity islands (SCCmec, φSPβ, φSa1, SaPI2, vSe1/ φSPβ) is indicated
Fig. 3
Fig. 3
Correlation of pathogenicity-associated genotypes with in vitro pathogenicity-related phenotypes. ae Distribution of scores for five in vitro phenotypes between asymptomatic carriage (red, n = 44) and infection S. epidermidis isolates (blue, n = 36): a interleukin-8 (IL-8) quantification in HaCaT keratinocytes and d in whole human blood serum, b biofilm formation, c cytotoxicity using a vesicle assay (comparing 17 asymptomatic with 31 infection isolates), and e methicillin resistance (defined as growth at a concentration of > 0.25 mg/L). The mean and s.d. error bars are shown for A-D with P-value determined using two tailed t test, n.s. indicates not significant. Two-tailed Fishers exact test was used to determine significant difference (P-value) in methicillin resistance (e). f Manhattan plot of Fisher’s exact test P-values correlating the prevalence of each GWAS-associated k-mer with high and low percentiles of four in vitro phenotype scores performed on the same S. epidermidis isolates used for GWAS. The red dotted line indicates the lower threshold for statistical significance used in the GWAS. The blue dotted line indicates a cut-off for top correlation values. Top values mapped to 61 genes. gk Identification of predictive genotypes for pathogenicity in S. epidermidis using random forest (RF) models. g Importance of the top 1000 (of 1900) k-mer predictors from the primary GWAS; h predictor importance (left y-axis) among the top 20 phenotype correlated predictors. The red dotted line shows the classification accuracy (right y-axis) of the sub-models in which only the corresponding top predictors are included. i Predictor importance of the four laboratory phenotype-specific k-mers included in the final model. j Change in risk score for a specific k-mer profile when the colour-indicated k-mer is present (y-axis) compared to absent (x-axis). A point above the diagonal implies that the risk score is increased when the k-mer is present. k ROC curve showing the overall performance of the classifier
Fig. 4
Fig. 4
Comparison of allelic variation and consistency index for core genes and genes containing GWAS pathogenicity elements. a The number of alleles per locus and b consistency indices to a core phylogeny, were calculated for each gene alignment for core genes and those containing pathogenicity-associated elements that correlated with secondary in vitro phenotypes using R and the phangorn package. The left y-axis indicates the number of core genes (black line), the right y-axis indicates the number of genes containing associated and correlated k-mers (blue line). For the consistency index, the two distributions were significantly different (two-tailed Mann–Whitney test; P = 0.002, Mann–Whitney U = 15.50)
Fig. 5
Fig. 5
Contrasting models of S. epidermidis infection and associated variation in conceptual genomic data. Each panel summarises scenarios for subcutaneous colonization from the primary commensal skin environment to the blood (left), and the impact on an S. epidermidis population of two clones (blue and red circles) and their genomes (internal circles) which may be enriched for putative pathogenicity-associated genes (red) or not (blue). Genealogical reconstructions of isolates sampled from infected blood are shown in the middle column. The prevalence of disease determinants in the genome of isolates from skin and blood are shown on the right. a Proliferation of pathogenic clones: clones with genomes enriched for pathogenicity determinants proliferate in the blood and other strains do not, observed as a discrete pathogen lineage on the tree. b True opportunistic pathogenicity: multiple genetically divergent clones proliferate in the blood and disease determinants are equally distributed among the genomes of isolates from the skin and the blood (or would be undetectable). c Divided genomes: horizontal gene transfer (R) spreads pathogenicity determinants into multiple genomic backgrounds allowing divergent clones to colonize the blood successfully

References

    1. Karlowsky JA, et al. Prevalence and antimicrobial susceptibilities of bacteria isolated from blood cultures of hospitalized patients in the United States in 2002. Ann. Clin. Microbiol. Antimicrob. 2004;3:7. doi: 10.1186/1476-0711-3-7. - DOI - PMC - PubMed
    1. Hall KK, Lyman JA. Updated review of blood culture contamination. Clin. Microbiol. Rev. 2006;19:788–802. doi: 10.1128/CMR.00062-05. - DOI - PMC - PubMed
    1. Piette A, Verschraegen G. Role of coagulase-negative staphylococci in human disease. Vet. Microbiol. 2009;134:45–54. doi: 10.1016/j.vetmic.2008.09.009. - DOI - PubMed
    1. Banerjee SN, et al. Secular trends in nosocomial primary bloodstream infections in the United States, 1980-1989. National nosocomial infections surveillance system. Am. J. Med. 1991;91:86S–89S. doi: 10.1016/0002-9343(91)90349-3. - DOI - PubMed
    1. Weinstein MP, et al. The clinical significance of positive blood cultures in the 1990s: a prospective comprehensive evaluation of the microbiology, epidemiology, and outcome of bacteremia and fungemia in adults. Clin. Infect. Dis.: Off. Publ. Infect. Dis. Soc. Am. 1997;24:584–602. doi: 10.1093/clind/24.4.584. - DOI - PubMed

Publication types

MeSH terms