. 2018 Nov 28;9(1):5031.
doi: 10.1038/s41467-018-07478-2.

Selective expansion of myeloid and NK cells in humanized mice yields human-like vaccine responses

Affiliations

Selective expansion of myeloid and NK cells in humanized mice yields human-like vaccine responses

Florian Douam et al. Nat Commun. .

Abstract

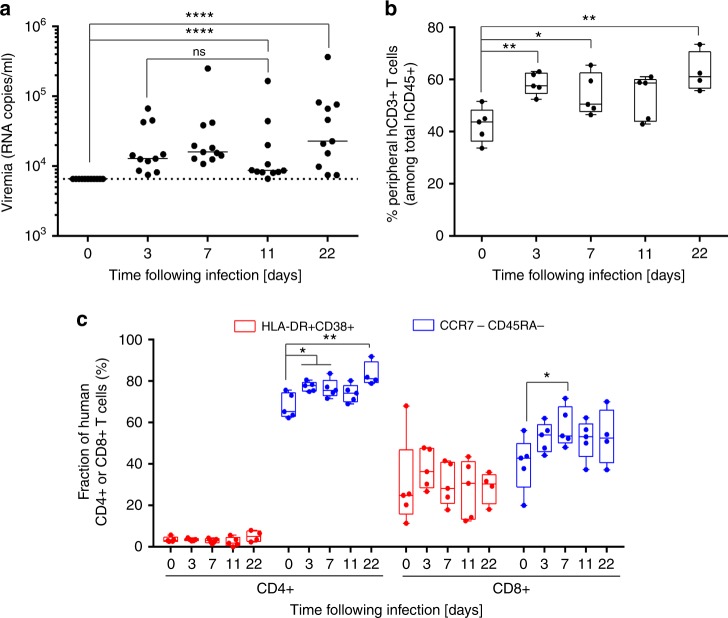
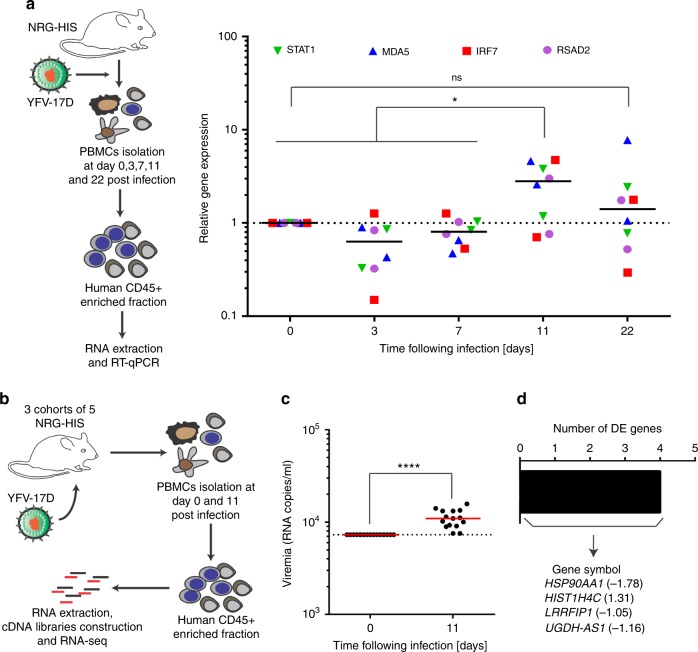
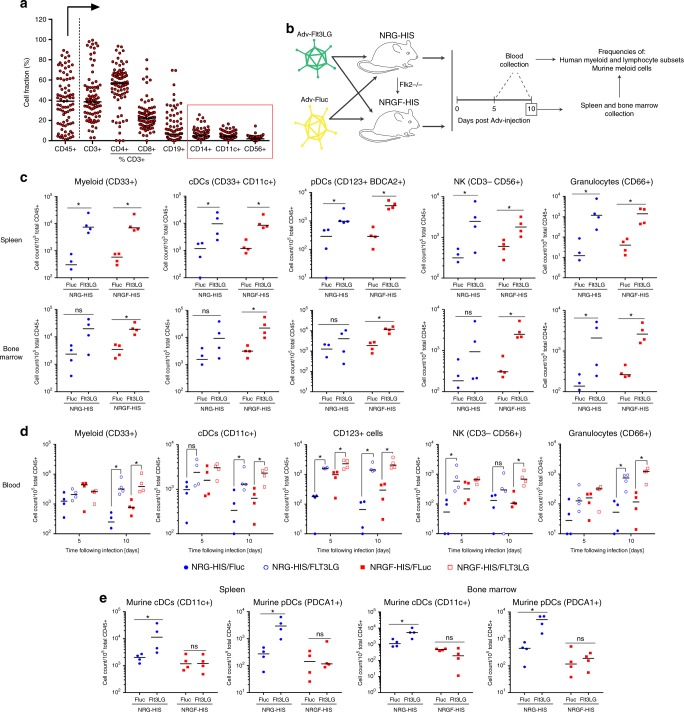
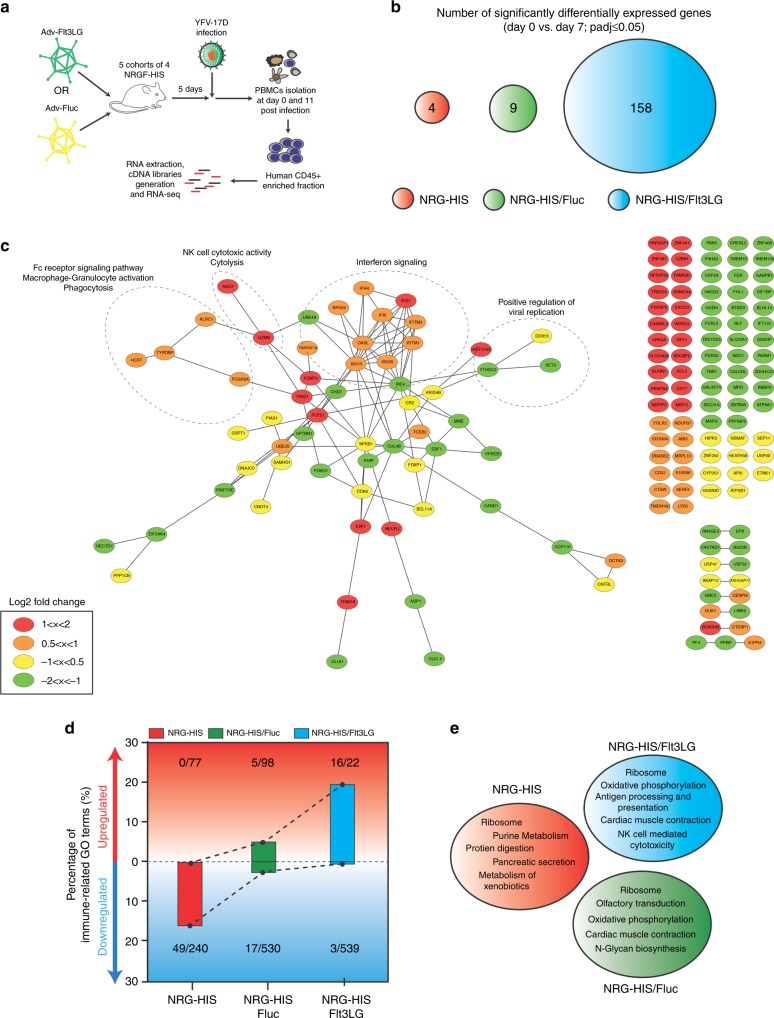
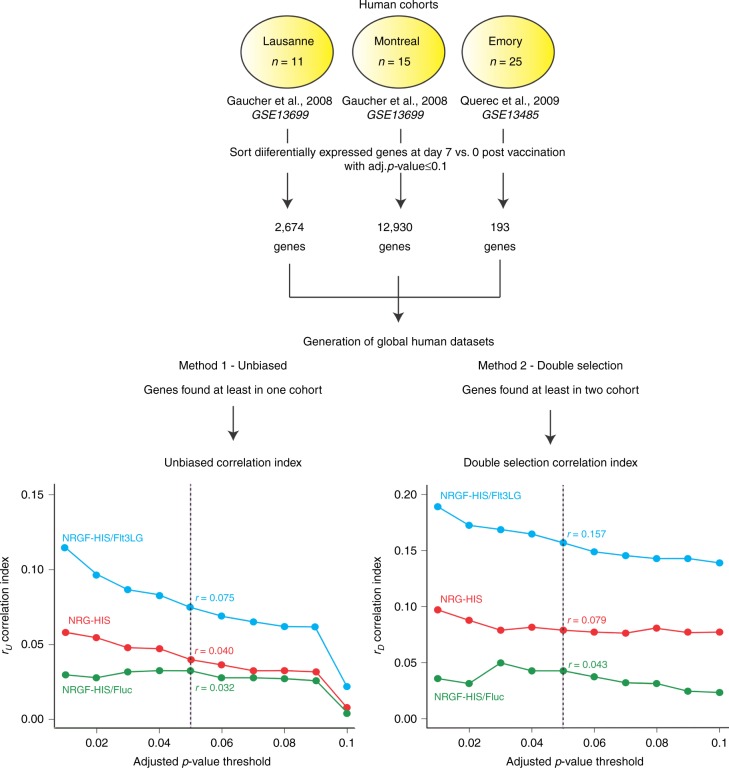
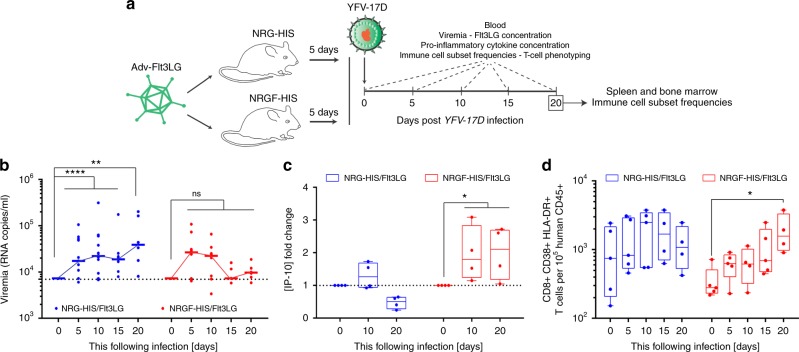
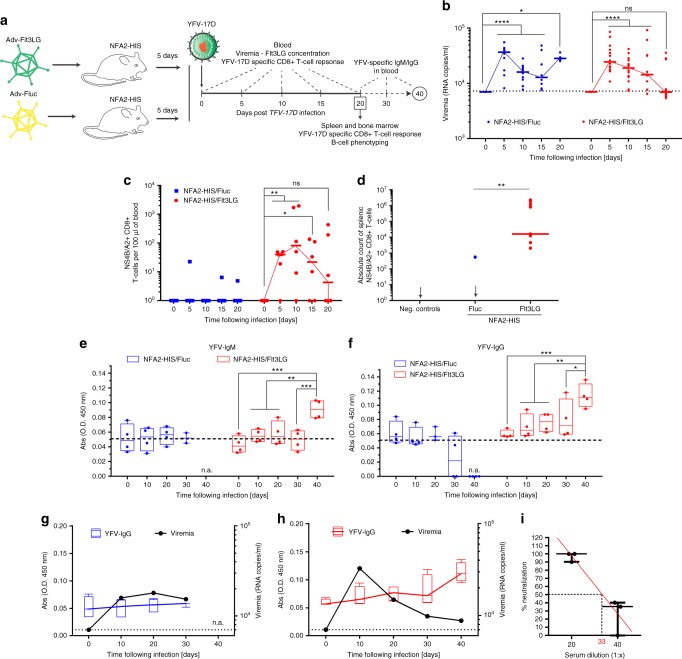
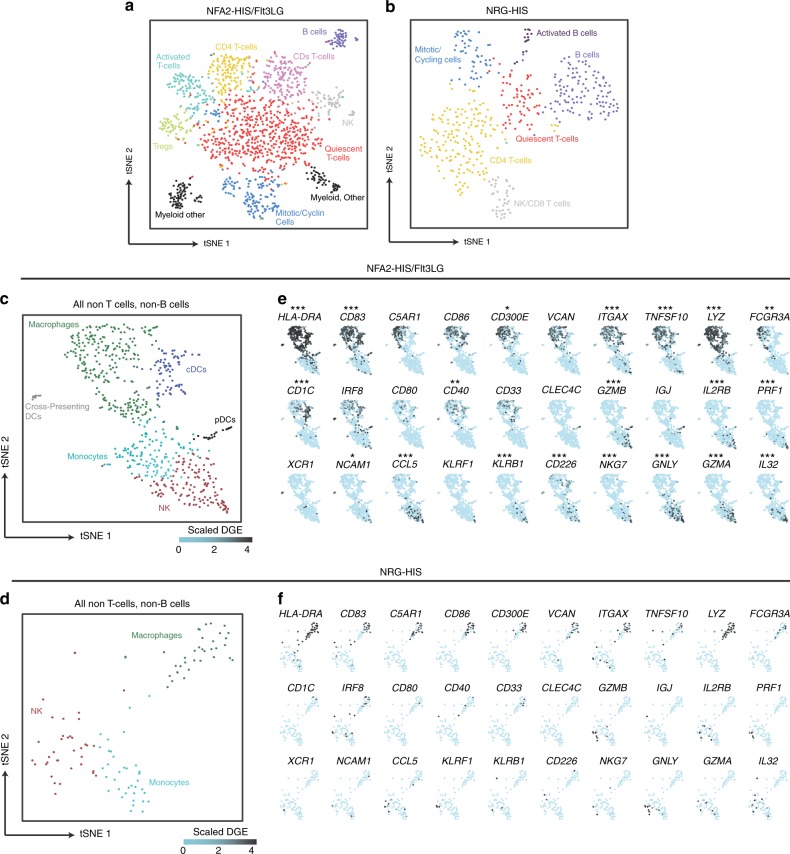
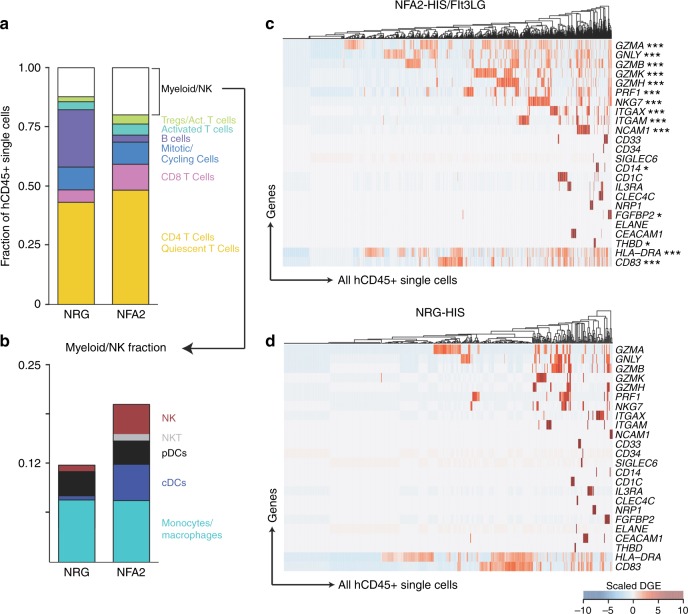
Mice engrafted with components of a human immune system have become widely-used models for studying aspects of human immunity and disease. However, a defined methodology to objectively measure and compare the quality of the human immune response in different models is lacking. Here, by taking advantage of the highly immunogenic live-attenuated yellow fever virus vaccine YFV-17D, we provide an in-depth comparison of immune responses in human vaccinees, conventional humanized mice, and second generation humanized mice. We demonstrate that selective expansion of human myeloid and natural killer cells promotes transcriptomic responses akin to those of human vaccinees. These enhanced transcriptomic profiles correlate with the development of an antigen-specific cellular and humoral response to YFV-17D. Altogether, our approach provides a robust scoring of the quality of the human immune response in humanized mice and highlights a rational path towards developing better pre-clinical models for studying the human immune response and disease.


Conflict of interest statement

The authors declare no competing interests.

Figures

Fig. 1
Fig. 1
NRG-HIS mice do not clear YFV-17D infection. a YFV-17D serum viremia in the peripheral blood of NRG-HIS mice over the course of infection. (+) RNA copies per ml were quantified by RT-qPCR. Limit of detection (dotted line) is shown. Horizontal lines represent median viremia at each time point (n = 12). ****p ≤ 0.0001, ns non-significant (Wilcoxon–Mann–Whitney test). b Percentage of peripheral human CD3+ T cells among the total human CD45+ cell population in the blood of NRG-HIS mice over the course of YFV-17D infection. Bounds of box and whiskers represent the min-to-max fraction of peripheral human CD3+ T cell among total human CD45+ at each time point. Medians are indicated in each box as center line (n = 5) *p ≤ 0.05, **p ≤ 0.01 (Student’s t test). c Fraction of peripheral human CD4+ and CD8+ T cells co-expressing HLA-DR and CD38 (red) or lacking expression of both CCR7 and CD45RA (blue) in the blood of NRG-HIS mice over the course of YFV-17D infection. Bounds of box and whiskers represent the min-to-max fraction of human CD4+ or CD8+ T cell for each marker combination and time point. Medians are indicated in each box as center line (n = 5). *p ≤ 0.05, **p ≤ 0.01 (Student’s t test)
Fig. 2
Fig. 2
Limited transcriptomic response to YFV-17D infection in NRG-HIS mice. a Relative expression of a set of four anti-viral genes (green, STAT1; blue, MDA5; red, IRF7; and purple, RSAD2) in the PBMCs of NRG-HIS mice following infection with YFV-17D. Expression of each gene was assessed by RT-qPCR in human peripheral CD45+ cells at different time points post infection (day 0, 3, 7, 11, and 22 post infection). Each dot represents the average expression of a given gene within a cohort of 4 NRG-HIS mice. For each time point, the grand median is shown and represent the median of the cumulated expression of the four genes. Dotted line represents the gene expression level at baseline (n = 2 cohorts of four NRG-HIS mice each). *p ≤ 0.05, ns non-significant (two-way ANOVA). b Schematic representation of the procedure to characterize the PBMC transcriptomic signature of NRG-HIS mice following YFV-17D infection. c YFV-17D serum viremia at days 0 and 11 post infection in the NRG-HIS mice used for transcriptomic profiling. (+) RNA copies per ml were quantified by RT-qPCR. Red horizontal lines represent median viremia at each time point. Limit of detection (dotted line) is shown (n = 15). ****p 0.001 (Wilcoxon–Mann–Whitney test). d Number of significantly differentially expressed (DE) genes (padj ≤ 0.05) in the PBMCs of NRG-HIS mice following YFV-17D infection. The names of the only four DE genes is depicted, followed with their respective log2 fold change
Fig. 3
Fig. 3
Selective expansion of human myeloid cells and NK cells in humanized mice. a Immune system reconstitution in NRG-HIS mice. Frequency of each cell fraction is shown as a percentage of CD45+ cells, with the exception of CD4+ and CD8+ T cells, which are displayed as a percentage of CD3+ T cells. The frequencies of important myeloid subsets (CD14+ monocytes and CD11c+ dendritic cells) and CD56+ NK cells are highlighted by a red box. Medians are shown for each cell subset frequency as horizontal black line (n = 82). b Schematic representation of the experimental procedure employed to evaluate the ability of NRGF-HIS mice to selectively expand human myeloid cell subsets. 1011 AdV-Fluc or 1010 AdV-Flt3LG particles were injected into NRG-HIS or NRGF-HIS mice, and immune cell expansion was examined at day 5 and 10 post Adv-injection. c, d Expansion of human immune cell subsets in the spleen (c), bone marrow (c) or blood (d) of NRG-HIS and NRGF-HIS mice. NRG-HIS (blue circle) and NRGF-HIS (red square) mice were injected with AdV-Fluc (closed circle/square in panel c) or AdV-Flt3LG (open circle/square in panel c). e Expansion of murine cDCs and pDCs in the spleen and bone marrow of NRG-HIS and NRGF-HIS mice following injection with AdV-Flt3LG or AdV-Fluc. For panels (ce), medians are shown as horizontal black lines for each experimental condition (n = 4 per group). *p ≤ 0.05, ns non-significant (Wilcoxon–Mann–Whitney test). cDCs conventional dendritic cells, pDCs plasmacytoid dendritic cells, NK natural killer cells
Fig. 4
Fig. 4
NRGF-HIS/Flt3LG mice display an extensive transcriptomic signature. a Schematic representation of the experimental procedure to characterize the PBMC transcriptomic signature of NRGF-HIS mice following YFV-17D infection. b Number of significantly DE genes (padj ≤ 0.05) at day 11 post YFV-17D infection (versus day 0, prior infection) in the PBMCs of NRG-HIS (red), NRGF-HIS/Fluc (green), and NRGF-HIS/Flt3LG (blue) mouse PBMCs upon YFV-17D infection. c Protein–protein network of significantly DE (padj ≤ 0.05) in NRGF-HIS mice following YFV-17D infection. Each gene is colored based on its log2FC (1 < x < 2, red; 0.5 < x < 1, orange; −1 < x < −0.5, yellow; −2 < x < −1, green). Areas enriched with genes related to a specific biological process are highlighted by a dotted circle or ellipse. d Frequencies of upregulated (red area) or downregulated (blue area) immune-related GO terms among all statistically significant GO terms (p ≤ 0.05) in NRG-HIS (red), NRGF-HIS/Fluc (green), and NRGF-HIS/Flt3LG (blue) mice following replicate analysis. Total count of immune-related GO-terms out of all significant GO terms (displayed as immune-related/all) are also reported. Dotted lines between the bars symbolize the progressive enhancement of human immune functionality across our humanized mice models. e KEGG pathway enrichment analysis of the transcriptomes of NRG-HIS (red), NRGF-HIS/Fluc (green), and NRGF-HIS/Flt3LG (blue) mouse PBMCs following replicate analysis. For each experimental setting or mouse model, the top five upregulated KEGG pathways are listed (q value ≤ 0.06)
Fig. 5
Fig. 5
Human-like transcriptomic response to YFV-17D infection in NRGF-HIS/Flt3LG. Differentially expressed genes from PBMCs of three YFV-17D human vaccinee cohorts (Lausanne, n = 11; Montreal, n = 15; Emory, n = 25) were used to generate two global human transcriptomic datasets: an unbiased dataset (all differentially expressed genes (padj ≤ 0.1) found in at least one cohort) and an double-selection dataset (all differentially expressed genes (padj ≤ 0.1) found in at least two cohorts). For a given human global dataset (unbiased, left; double selection, right) and padj threshold (starting at padj ≤ 0.1 with 0.01 increment), the Spearman rho correlation index was computed for each humanized mouse model transcriptomic dataset (NRG-HIS, NRGF-HIS/Fluc, and NRGF-HIS/Flt3LG) and plotted as function of the padj threshold. The Spearman rho correlation index for the unbiased and double selection method are respectively referred as rU and rD. The definitive correlation indexes for the unbiased and double selection method, referred as rU and rD at padj = 0.05 (rU,q=0.05 and rD,q=0.05) respectively, are indicated on each graph and for each humanized mouse model. See Methods for more details
Fig. 6
Fig. 6
Improved control of infection and T-cell activation in NRGF-HIS/Flt3LG mice. a Schematic representation of the NRG-HIS and NRGF-HIS mice time course infection experiment. b YFV-17D serum viremia in the peripheral blood of NRG-HIS (blue, n = 12) and NRGF-HIS (red, n = 8) mice over the course of infection. (+) RNA copies per ml were quantified by RT-qPCR. Limit of detection (dotted line) is shown. Horizontal lines represent median viremia at each time point. **p ≤ 0.01, ****p ≤ 0.0001, ns non-significant (Wilcoxon–Mann–Whitney test). c IP-10 concentration fold-change in the serum of NRG-HIS (blue) and NRGF-HIS (red) mice over the course of infection. Bounds of box and whiskers represent the min-to-max concentration of IP-10 at each time point. Medians are indicated in each box as center line (n = 4–5 per group). *p ≤ 0.05, ***p ≤ 0.001, ns non-significant (Wilcoxon–Mann–Whitney test). d Frequencies of human CD3+ CD8+ HLA-DR+ CD38+ T cells in the blood of NRG-HIS (blue) and NRGF-HIS (red) mice over the course of YFV-17D infection. Bounds of box and whiskers represent the min-to-max frequencies of CD8+ HLA-DR+ CD38+ T cell at each time point. Medians are indicated in each box as center line (n = 5 per group). *p ≤ 0.05 (two-way ANOVA)
Fig. 7
Fig. 7
NFA2-HIS/Flt3LG mice mount YFV-specific cellular and humoral response. a Schematic representation of the NFA2-HIS mice time course infection experiment. b YFV-17D serum viremia in the peripheral blood of NFA2-HIS/Fluc (blue, n = 10) and NFA2-HIS/Flt3LG (red, n = 14) mice over the course of infection. (+) RNA copies per ml were quantified by RT-qPCR. Limit of detection (dotted line) is shown. Horizontal lines represent median viremia at each time point. *p ≤ 0.05, ****p ≤ 0.0001, ns non-significant (Wilcoxon–Mann–Whitney test). c Absolute cell count of peripheral YFV-specific CD8+ T cells (NS4B/A2+) in the blood of NFA2-HIS/Fluc and NFA2-HIS/Flt3LG mice over the course of YFV-17D infection. Cell counts are shown as per 100 μl of total blood. Horizontal lines represent median cell count at each time point (n = 4–6). *p ≤ 0.05, **p ≤ 0.01, ns non-significant (Wilcoxon–Mann–Whitney test). d Absolute count of YFV-specific CD8+ T cells (NS4B/A2+) in the spleen of NFA2-HIS/Fluc and NFA2-HIS/Flt3LG mice at day 20 post infection. Negative controls represent one non-infected NFA2-HIS/Flt3LG mouse and two infected NRGF-HIS/Flt3LG mice (that do not express HLA-A2). Horizontal lines represent median cell count (n = 4–11). **p ≤ 0.01 (Wilcoxon–Mann–Whitney test). e, f Relative concentration of human anti-YFV-17D IgM (e) and IgG (f) antibodies in the serum of NFA2-HIS/Fluc (blue, n = 4) and NFA2-HIS/Flt3LG mice (red, n = 4) over a 6-weeks course of infection. **p ≤ 0.01, ***p ≤ 0.001, ns non-significant (Wilcoxon–Mann–Whitney test). n.a. non applicable as no mice were analyzed at the time of serum collection. g, h Correlation between YFV-17D viremia (black line) and YFV-IgG relative concentration (colored box and whisker) in the serum of NFA2-HIS/Fluc (g) and NFA2-HIS/Flt3LG (h) over a 6-weeks course of infection (n = 4 per group). Medians in each box and whisker are connected together by a colored line (blue for NFA2-HIS/Fluc and red for NFA2-HIS/Flt3LG). Viremia limit of detection (dotted line) is shown. n.a. non applicable as no mice in the control group were alive  at the time of serum collection. For panels (eh), bounds of box and whiskers represent the min-to-max absorbance value at each time point. Medians are indicated in each box as center line. i Quantification of YFV-neutralizing activity in the serum of NFA2-NRGF-HIS/Flt3LG mice. Serum neutralizing activity is represented as percentage of YFV-17D infection inhibition (% neutralization). Medians with ranges (min-to-max percentage of neutralization) for both serum dilution are shown (n = 3). A linear regression (red line) of the average neutralization activity is shown and was used to determine the median neutralization titer (50% inhibition, red number on the x-axis)
Fig. 8
Fig. 8
Improved human immune system complexity in NFA2-HIS/Flt3LG. a, b 1297 and 457 single cells from the CD45+ compartment in NFA2-HIS/Flt3LG (a) and NRG-HIS (b) mouse spleens respectively, 6 weeks post infection. Single cells are plotted using t-stochastic neighbor embedding (tSNE). Significant clusters were defined using a shared nearest neighbor modularity based clustering algorithm. Clusters identified by defining significantly differentially expressed genes in each cluster using a likelihood ratio test for single-cell gene expression and annotating by literature-supported gene expression programs or subpopulation defining genes (see Methods section). c, d CD3-CD79-TCR-BCR- single cells from both CD45+ and CD33+ compartments in spleens from two NFA2-HIS/Flt3LG (c) and NRG-HIS (d) mice are plotted as a tSNE. Clustering and annotation are completed as described in (a, b). e, f Cluster-defining genes over CD3-CD79-TCR-BCR- single cells from NFA2-HIS/Flt3LG (e) and NRG-HIS (f) mice are represented as a projected color scale on the tSNE calculated in (c) and (d), respectively. Scaled digital gene expression is represented as a color map from light blue (low gene expression) to black (high gene expression), and these values are projected onto the single cell point. The expression of these genes in NFA2-HIS/Flt3LG mice (e) was compared to the expression in NRG-HIS mice (f), and significantly differentially expressed genes are shown in (e) (*p ≤ 0.05, ***p ≤ 0.001; Benjamini–Hochberg adjusted p-value). Tregs regulatory T cells, NK natural killer cells, DCs dendritic cells, cDCs conventional dendritic cells, pDCs plasmacytoid dendritic cells
Fig. 9
Fig. 9
ScRNA-Seq-based measurement of the myeloid and NK cell engraftment. a, b Chart bart displaying the fraction of human cell subsets within the hCD45+ compartment in both NRG-HIS and NFA2-HIS/Flt3LG mouse spleens (a). The fraction of multiple myeloid and NK subsets is highlighted within a second chart bart (b). Cell subsets are colored as in Fig. 8a, c. c, d Heatmap of all hCD45+ single cells in NFA2-HIS/Flt3LG (c) and NRG-HIS (d) mice over myeloid, DC, NK, and granulocyte subpopulation-defining genes. Differentially expressed genes between NRG-HIS and NFA2-HIS/Flt3LG mice are shown in (c) (*p ≤ 0.05, **p ≤ 0.01, ***p ≤ 0.001; Benjamini–Hochberg adjusted p-values). Tregs regulatory T cells, NK natural killer cells, NKT natural killer T cells, DCs dendritic cells, cDCs conventional dendritic cells, pDCs plasmacytoid dendritic cells

Similar articles

Cited by

References

    1. Mestas J, Hughes CC. Of mice and not men: differences between mouse and human immunology. J. Immunol. 2004;172:2731–2738. doi: 10.4049/jimmunol.172.5.2731. - DOI - PubMed
    1. Douam F, et al. Genetic dissection of the host tropism of human-tropic pathogens. Annu. Rev. Genet. 2015;49:21–45. doi: 10.1146/annurev-genet-112414-054823. - DOI - PMC - PubMed
    1. Akondy RS, et al. The yellow fever virus vaccine induces a broad and polyfunctional human memory CD8+ T cell response. J. Immunol. 2009;183:7919–7930. doi: 10.4049/jimmunol.0803903. - DOI - PMC - PubMed
    1. Ellebedy AH, et al. Defining antigen-specific plasmablast and memory B cell subsets in human blood after viral infection or vaccination. Nat. Immunol. 2016;17:1226–1234. doi: 10.1038/ni.3533. - DOI - PMC - PubMed
    1. Miller JD, et al. Human effector and memory CD8+ T cell responses to smallpox and yellow fever vaccines. Immunity. 2008;28:710–722. doi: 10.1016/j.immuni.2008.02.020. - DOI - PubMed

Publication types