

Thermodynamic phases in two-dimensional active matter
- PMID: 30487582
- PMCID: PMC6261958
- DOI: 10.1038/s41467-018-07491-5
Thermodynamic phases in two-dimensional active matter
Abstract
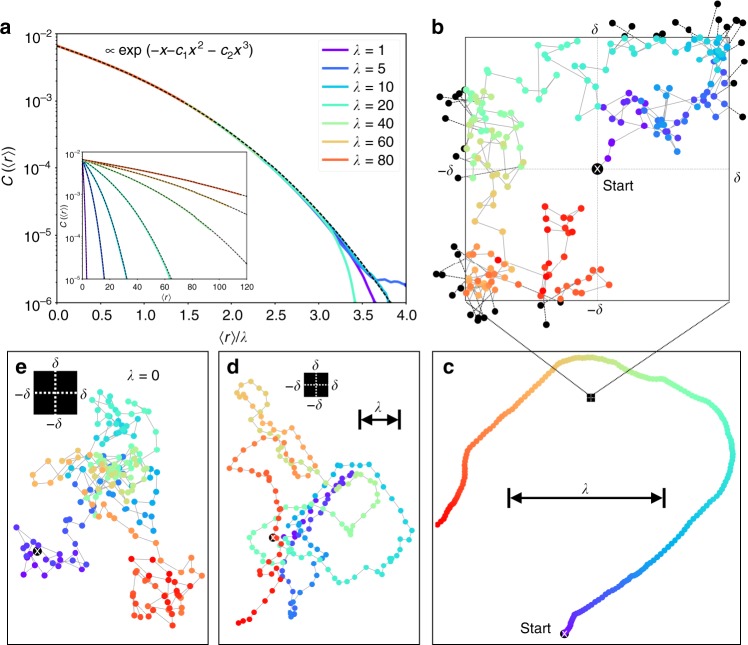
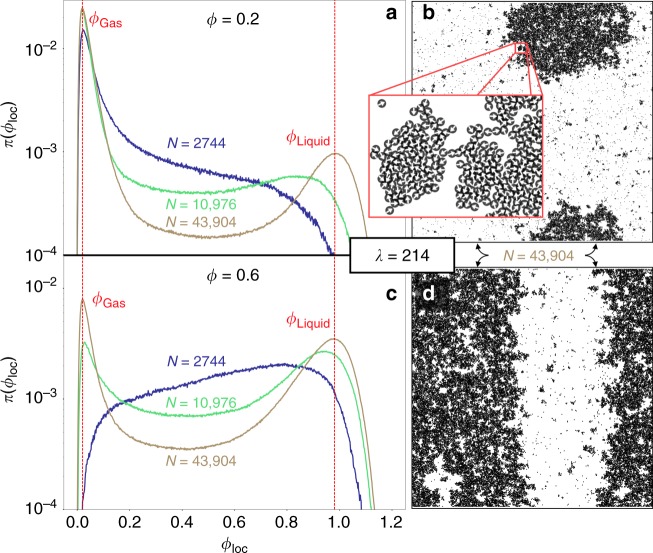
Active matter has been much studied for its intriguing properties such as collective motion, motility-induced phase separation and giant fluctuations. However, it has remained unclear how the states of active materials connect with the equilibrium phases. For two-dimensional systems, this is also because the understanding of the liquid, hexatic, and solid equilibrium phases and their phase transitions is recent. Here we show that two-dimensional self-propelled point particles with inverse-power-law repulsions moving with a kinetic Monte Carlo algorithm without alignment interactions preserve all equilibrium phases up to very large activities. Furthermore, at high activity within the liquid phase, a critical point opens up a gas-liquid motility-induced phase separation region. In our model, two-step melting and motility-induced phase separation are thus independent phenomena. We discuss the reasons for these findings to be common to a wide class of two-dimensional active systems.
Conflict of interest statement
The authors declare no competing interests.
Figures


Similar articles
-
A kinetic-Monte Carlo perspective on active matter.J Chem Phys. 2019 Apr 14;150(14):144113. doi: 10.1063/1.5085828. J Chem Phys. 2019. PMID: 30981254
-
Full Phase Diagram of Active Brownian Disks: From Melting to Motility-Induced Phase Separation.Phys Rev Lett. 2018 Aug 31;121(9):098003. doi: 10.1103/PhysRevLett.121.098003. Phys Rev Lett. 2018. PMID: 30230874
-
Cell Division and Motility Enable Hexatic Order in Biological Tissues.Phys Rev Lett. 2024 May 24;132(21):218402. doi: 10.1103/PhysRevLett.132.218402. Phys Rev Lett. 2024. PMID: 38856284 Free PMC article.
-
Characterization of van der Waals type bimodal,- lambda,- meta- and spinodal phase transitions in liquid mixtures, solid suspensions and thin films.Adv Colloid Interface Sci. 2018 Mar;253:66-116. doi: 10.1016/j.cis.2018.01.002. Adv Colloid Interface Sci. 2018. PMID: 29422417 Review.
-
Microscopic Swarms: From Active Matter Physics to Biomedical and Environmental Applications.Micromachines (Basel). 2022 Feb 13;13(2):295. doi: 10.3390/mi13020295. Micromachines (Basel). 2022. PMID: 35208419 Free PMC article. Review.
Cited by
-
Hydrodynamic effects on the liquid-hexatic transition of active colloids.Eur Phys J E Soft Matter. 2022 Sep 13;45(9):75. doi: 10.1140/epje/s10189-022-00230-1. Eur Phys J E Soft Matter. 2022. PMID: 36098879 Free PMC article.
-
Emergence and melting of active vortex crystals.Nat Commun. 2021 Sep 24;12(1):5630. doi: 10.1038/s41467-021-25545-z. Nat Commun. 2021. PMID: 34561437 Free PMC article.
-
Motility-induced coexistence of a hot liquid and a cold gas.Nat Commun. 2024 Apr 13;15(1):3206. doi: 10.1038/s41467-024-47533-9. Nat Commun. 2024. PMID: 38615122 Free PMC article.
-
Entropy Production in a System of Janus Particles.Entropy (Basel). 2025 Jan 23;27(2):112. doi: 10.3390/e27020112. Entropy (Basel). 2025. PMID: 40003109 Free PMC article.
-
Energetic Variational Modeling of Active Nematics: Coupling the Toner-Tu Model with ATP Hydrolysis.Entropy (Basel). 2025 Jul 27;27(8):801. doi: 10.3390/e27080801. Entropy (Basel). 2025. PMID: 40870273 Free PMC article.
References
-
- Cates ME, Tailleur J. Motility-induced phase separation. Annu. Rev. Condens. Matter Phys. 2015;6:219–244. doi: 10.1146/annurev-conmatphys-031214-014710. - DOI
-
- Mermin ND, Wagner H. Absence of ferromagnetism or antiferromagnetism in one- or two-dimensional isotropic Heisenberg models. Phys. Rev. Lett. 1966;17:1133–1136. doi: 10.1103/PhysRevLett.17.1133. - DOI
-
- Zahn K, Lenke R, Maret G. Two-stage melting of paramagnetic colloidal crystals in two dimensions. Phys. Rev. Lett. 1999;82:2721–2724. doi: 10.1103/PhysRevLett.82.2721. - DOI
Publication types
LinkOut - more resources
Full Text Sources
