

Nanofocusing of X-ray free-electron laser using wavefront-corrected multilayer focusing mirrors
- PMID: 30487583
- PMCID: PMC6262013
- DOI: 10.1038/s41598-018-35611-0
Nanofocusing of X-ray free-electron laser using wavefront-corrected multilayer focusing mirrors
Abstract
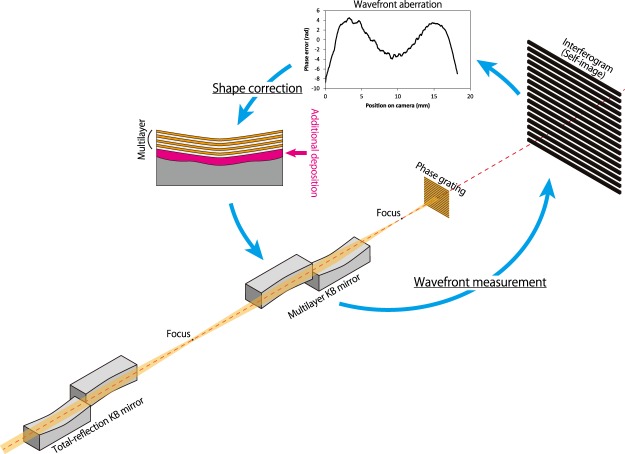
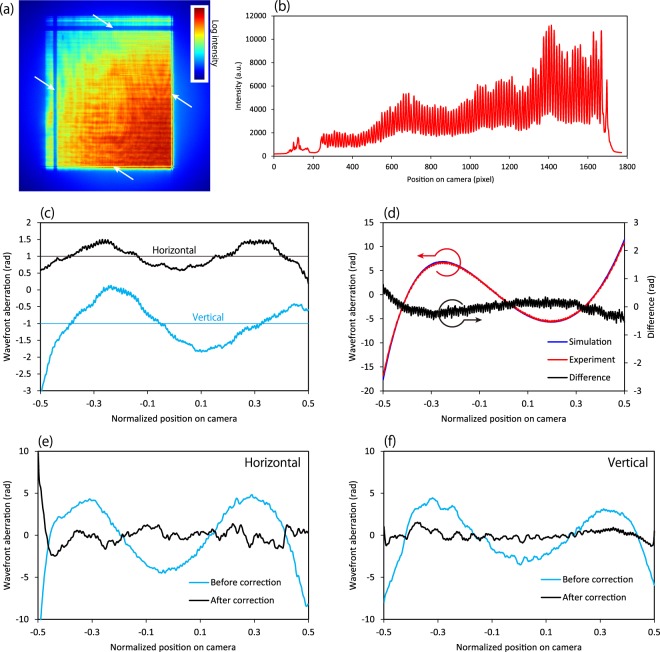
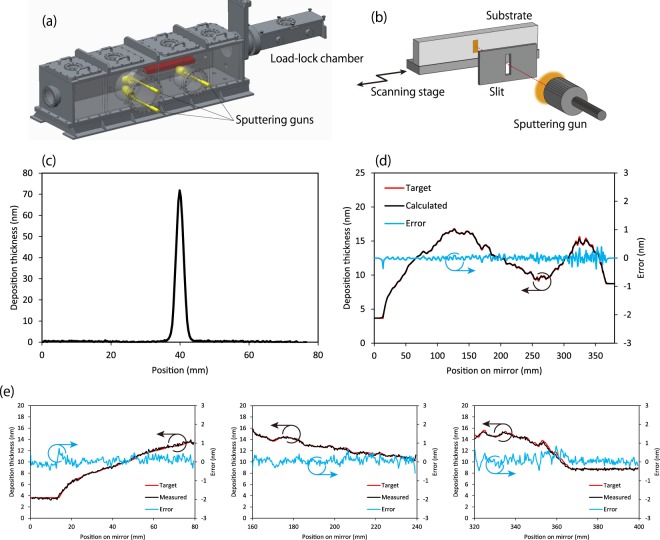
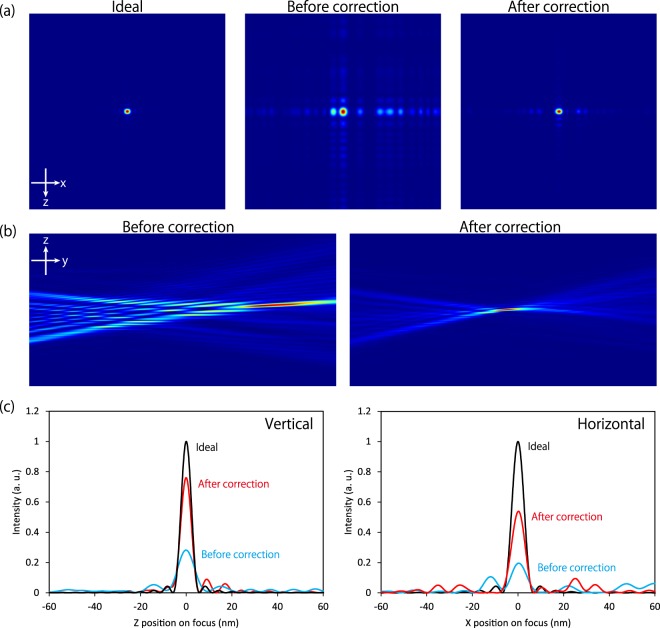
A method of fabricating multilayer focusing mirrors that can focus X-rays down to 10 nm or less was established in this study. The wavefront aberration induced by multilayer Kirkpatrick-Baez mirror optics was measured using a single grating interferometer at a photon energy of 9.1 keV at SPring-8 Angstrom Compact Free Electron Laser (SACLA), and the mirror shape was then directly corrected by employing a differential deposition method. The accuracies of these processes were carefully investigated, considering the accuracy required for diffraction-limited focusing. The wavefront produced by the corrected multilayer focusing mirrors was characterized again in the same manner, revealing that the root mean square of the wavefront aberration was improved from 2.7 (3.3) rad to 0.52 (0.82) rad in the vertical (horizontal) direction. A wave-optical simulator indicated that these wavefront-corrected multilayer focusing mirrors are capable of achieving sub-10-nm X-ray focusing.
Conflict of interest statement
The authors declare no competing interests.
Figures


References
-
- Ayvazyan V, et al. First operation of a free-electron laser generating GW power radiation at 32 nm wavelength. Eur. Phys. J. D. 2006;37:297–303. doi: 10.1140/epjd/e2005-00308-1. - DOI
-
- Shintake T, et al. A compact free-electron laser for generating coherent radiation in the extreme ultraviolet region. Nat. Photonics. 2008;2:555–559. doi: 10.1038/nphoton.2008.134. - DOI
-
- Allaria E, et al. Highly coherent and stable pulses from the FERMI seeded free-electron laser in the extreme ultraviolet. Nat. Photonics. 2012;6:699–704. doi: 10.1038/nphoton.2012.233. - DOI
-
- Emma P, et al. First lasing and operation of an ångstrom-wavelength free-electron laser. Nat. Photonics. 2010;4:641–647. doi: 10.1038/nphoton.2010.176. - DOI
-
- Ishikawa T, et al. A compact X-ray free-electron laser emitting in the sub-ångström region. Nat. Photonics. 2012;6:540–544. doi: 10.1038/nphoton.2012.141. - DOI
Grants and funding
- JP23226004/Japan Society for the Promotion of Science (JSPS)
- JP16H06358/Japan Society for the Promotion of Science (JSPS)
- JP17H01073/Japan Society for the Promotion of Science (JSPS)
- JP16J009530/Japan Society for the Promotion of Science (JSPS)
- JP23226004/Japan Society for the Promotion of Science (JSPS)
LinkOut - more resources
Full Text Sources
Other Literature Sources
