. 2018 Dec;564(7735):263-267.
doi: 10.1038/s41586-018-0753-3. Epub 2018 Nov 28.

Trophoblast organoids as a model for maternal-fetal interactions during human placentation

Affiliations

Trophoblast organoids as a model for maternal-fetal interactions during human placentation

Margherita Y Turco et al. Nature. 2018 Dec.

Abstract

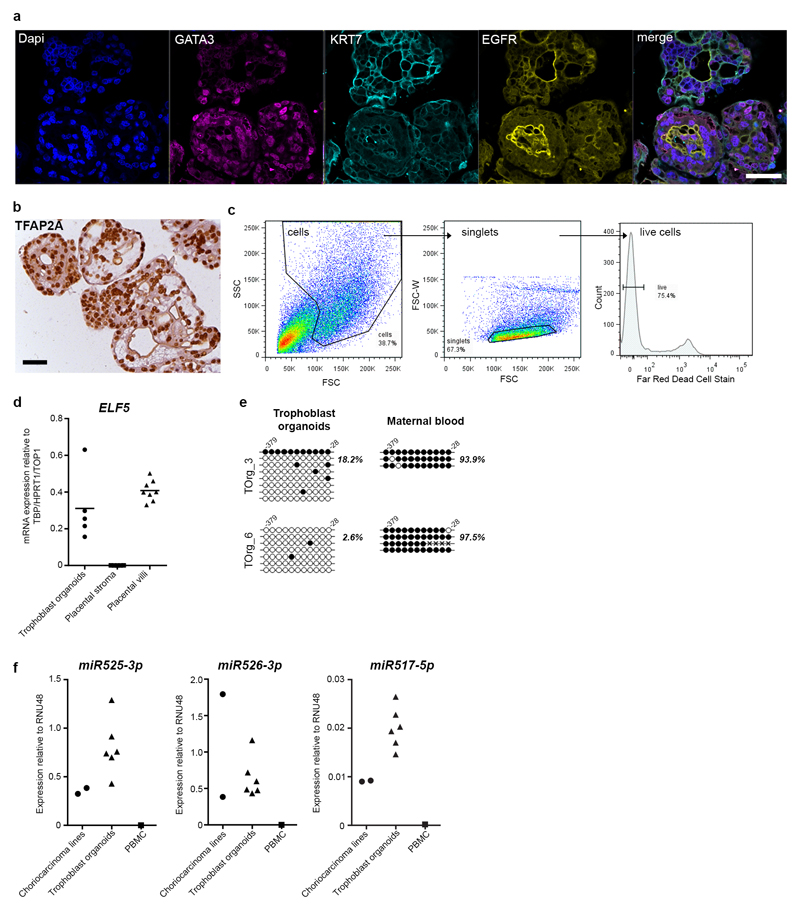
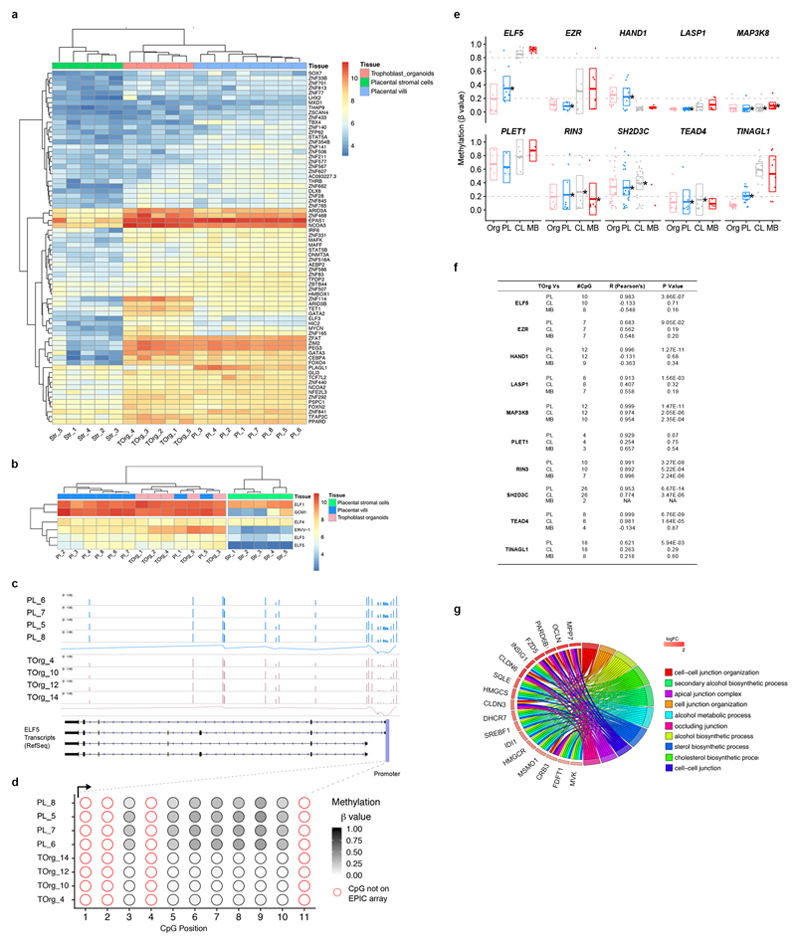
The placenta is the extraembryonic organ that supports the fetus during intrauterine life. Although placental dysfunction results in major disorders of pregnancy with immediate and lifelong consequences for the mother and child, our knowledge of the human placenta is limited owing to a lack of functional experimental models1. After implantation, the trophectoderm of the blastocyst rapidly proliferates and generates the trophoblast, the unique cell type of the placenta. In vivo, proliferative villous cytotrophoblast cells differentiate into two main sub-populations: syncytiotrophoblast, the multinucleated epithelium of the villi responsible for nutrient exchange and hormone production, and extravillous trophoblast cells, which anchor the placenta to the maternal decidua and transform the maternal spiral arteries2. Here we describe the generation of long-term, genetically stable organoid cultures of trophoblast that can differentiate into both syncytiotrophoblast and extravillous trophoblast. We used human leukocyte antigen (HLA) typing to confirm that the organoids were derived from the fetus, and verified their identities against four trophoblast-specific criteria3. The cultures organize into villous-like structures, and we detected the secretion of placental-specific peptides and hormones, including human chorionic gonadotropin (hCG), growth differentiation factor 15 (GDF15) and pregnancy-specific glycoprotein (PSG) by mass spectrometry. The organoids also differentiate into HLA-G+ extravillous trophoblast cells, which vigorously invade in three-dimensional cultures. Analysis of the methylome reveals that the organoids closely resemble normal first trimester placentas. This organoid model will be transformative for studying human placental development and for investigating trophoblast interactions with the local and systemic maternal environment.


Conflict of interest statement

Competing interests The authors declare no competing interests.

Figures

Extended Data Figure 1
Extended Data Figure 1. Staining for signalling pathways in first trimester placenta and decidua.
a, IHC of first trimester placenta (6-8 weeks g.a.) for effectors of major signalling pathways (i) WNT signalling, non-phosphorylated (p)-β-catenin (S33/S37/T41), (ii) TGFβ signalling through p-SMAD 2 (S465/467)/Smad3 (S423/425), (iii) MAPK signalling through p-ERK 1/2 (T202/Y204) and (iv) p-STAT3 (Y705) signalling. Scale bars, 50μm. Representative images from n=8, for each antibody. BMP signalling through SMAD1/5/8 was not possible to assess by IHC. VCT and CCC displayed membrane-localised staining of non-p β-catenin, whereas p-Erk1/2 was mostly cytoplasmic in both cell types. Cytoplasmic and nuclear signals for p-Erk1/2 were detected in EVT. P-SMAD 2/3 staining also showed stronger nuclear signals in EVT, suggesting a role for TGFβ signalling in differentiation in accordance with previous report. Phosphorylated nuclear STAT3 was detected only in EVT, again indicating involvement in their differentiation. SCT was negative for all these signals. b, Summary of findings from a. Trophoblast cells from different regions of the placenta are represented as a circle with nucleus (small inner circle). Black indicates strong staining, grey indicates faint staining and white not detected. Thicker circles indicate staining localized to cell membrane. c,In situ hybridization for LGR5 on first trimester placental villi. LGR5 transcripts are detected in VCT. Stroma is negative. Positive control probe is for UBIQUITIN (UBC). Negative control probe is for the bacterial gene dapB. Nuclei are counterstained in Haematoxylin. Images are at x10 magnification. Representative images from n=2. d, IHC for Rspondin-1 on early first trimester (6-8 weeks g.a.) and late first trimester (10-12 weeks g.a.) decidual samples. Representative images from n=2 for each tissue type. Images are at x20 magnification. SCT, syncytiotrophoblast; VCT, villous cytotrophoblast; CCC, cytotrophoblast cell columns; EVT, extravillous trophoblast; UG, uterine glands.
Extended Data Figure 2
Extended Data Figure 2. Culture components tested for the establishment of long-term organoid cultures of trophoblast from human placentas.
a, Growth factors (HGF, PGE2, Y-27632, Nicotinamide) were added as supplements to basal trophoblast organoid medium (TOM) that contains EGF, CHIR99021, Rspondin-1, A83-01, FGF2 (Supplementary Table 1a,b). Bright field images of placental digests at passage 1, day 7. The cystic structures that appear with the addition of Nicotinamide (red asterisks) are contaminating maternal glandular organoids. Representative images from n=2. Conditions containing factors that did not show growth are not included. Scale bars in upper and lower rows, 500μm. b, Trophoblast organoid cultures at passage 2 and at passage 10 with continuous culture. Representative images from n=3. Scale bars, 500μm. c, Analysis of genetic stability of cultures (n=2) with comparative genomics hybridization (CGH) array. Shown is a representative whole-genome array CGH plot generated with Agilent Cytogenomics software. Genomic DNA from late passage (p8) trophoblast organoids is compared to genomic DNA from early passage (p2). Each spot is a single probe. Plotted are the log ratios of the average signal intensity of each probe on the Y-axis along its position on the chromosomes (1-22, X and Y) on the x-axis. A log signal ratio of 0 represents equivalent copy number the samples. No significant DNA copy number abnormalities were identified. d, Live imaging of trophoblast organoid cultures (n=2) passaged >6 months and then frozen/thawed and exposed to Mitotracker Red. Functional mitochondria are visible showing that the cells are healthy (white arrowheads). Scale bars, whole organoid 50μm; Individual cells 10μm. e, Organoids derived from the same placental cell isolate using either trophoblast organoid medium (TOM) or Decidual organoid medium (ExM) demonstrating that matched placental (fetal) and decidual (maternal) organoids can be derived from the one sample. Representative bright field images from n=3. Scale bars, 500μm.
Extended Data Figure 3
Extended Data Figure 3. Trophoblast organoids retain characteristic features of first trimester trophoblast in vivo.
a, Representative images of positive staining for GATA3, KRT7, EGFR and DAPI on trophoblast organoids by confocal microscopy (representative image from n=3). EGFR stains both VCT and the surface of SCT as in vivo. The basement membrane is around the outside of the organoids with formation of syncytial masses in the centre. Scale bar, 50μm. b, IHC for transcription factor TFAP2A shows uniform expression on trophoblast organoids (representative image from n=20). Scale bars, 50μm. c, Gating strategy used for flow cytometric analysis of single, live cells from trophoblast organoids. d, Quantitative RT-PCR (qPCR) analysis of ELF5 in trophoblast organoids (n=5) compared to whole placental villi (n=8) and stromal cells isolated from the placenta (n=5). Graph shows expression levels relative to the geometric mean of three housekeeping genes TBP, TOP1 and HPRT1. The mean ELF5 expression is shown for each sample group. Source Data File 2. e, Bisulfite sequencing of the ELF5 promoter region (-379bp to -28bp upstream of the transcription start site) of trophoblast organoids from two different placentas (TOrg 3, 6) and matched maternal blood leukocytes (positive control). The relative % of methylated cytosine residues (filled circles) are indicated. f, qPCR analysis for miR525-3p, miR526-3p and miR517-5p from C19MC miRNA cluster on trophoblast organoids (n=6), JEG-3 and JAR (positive controls) and peripheral blood monocytes (PBMC, low expression/negative control). Graph shows relative expression levels of each organoid culture to housekeeping gene RNU48. Source Data File 1.
Extended Data Figure 4
Extended Data Figure 4. Hierarchical clustering of microarray data comparing placental villi, trophoblast organoids and placental stromal cells.
a, Unsupervised hierarchical clustering analysis of global gene expression profiles by microarray of first trimester placental villi (Pl)(n=8), trophoblast organoids (TOrg)(n=5), placental stromal cells (Str)(n=5) and decidual organoids (DOrg)(n=3). Analysis was based on 12673 probes. The expression profiles of trophoblast organoids cluster with first trimester placental samples whilst decidual organoids and placental stromal cells cluster in a separate tree. b, Top 20 genes contributing to PC1 and PC2 in the PCA plot from Fig. 2e. The top genes contributing to PC1 are all trophoblast-specific genes such as CGB3, GATA3 and PSG6 indicating that these genes separate the trophoblast organoid and placental villous samples from the two potentially-contaminating, non-trophoblast samples (decidual organoids and placental stroma). The top genes contributing to PC2 are epithelial genes such as CLDN3, TACSTD2 and KRT23. The organoids only contain trophoblast, but cells of the villous core (stromal, Hofbauer and endothelial cells) are also present in the placental samples. c, IHC of placental villi and trophoblast organoids stained for KRT23 showing expression in all trophoblast cells in vivo and in vitro. Experiment repeated independently 3 times. Scale bar, 50μm. Higher power in insets scale bar, 20μm. d, Clustered heatmap of differentially expressed genes between trophoblast organoids, placental villi and placental stroma with an absolute log2 fold change of 2 (adjusted p.value < 0.05). e, IHC of placental villi and trophoblast organoids stained for CCNE1 showing expression in trophoblast cells in vivo and in vitro. Scale bar, 50μm. Higher power in insets scale bar, 20μm. Experiment repeated independently 3 times.
Extended Data Figure 5
Extended Data Figure 5. Transcription factor expression profiles of trophoblast organoids and placental villi.
a, Heatmap highlighting transcription factors from the differentially expressed genes between placental villi, trophoblast organoids and placental stromal cells. b, Heatmap of genes from the ELF family of transcription factors and syncytial genes, GCM1 and ERVW-1. ELF3 and ELF5 both show moderate expression levels across the organoids and placental samples, and very low/no expression in the stromal samples. ELF4 and ELF1 are similar in all samples. There is very high expression of ELF1 in placentas and organoids. Similarly, both ERVW-1 and especially GCM1 are expressed at higher levels in placentas and organoids in agreement with qPCR data (Fig. 3d). c, Genomic mapping of the methylation array probes to the ELF5 gene. The height of the bars indicates methylation level from 0, unmethylated to 1.0, fully methylated. d, Methylation of the ELF5 promoter shows hypomethylation in the organoid and placenta samples. e, Distribution of methyl-cytosine across the promoters of the 10 murine trophoblast gatekeeper genes. The organoids (Org) and placenta (PL) samples show very similar methylation patterns across all 10 gene promoters that are distinct from the control/brain (CL) and maternal-blood (MB) in the majority of the genes. Boxplots comprise min: 1.5 x inter-quartile, lower: 1st quartile, middle: median, upper: 3rd quartile, max: 1.5 x inter-quartile range. Significant correlations (<0.01) are indicated (*). f, Table showing Pearson’s correlation coefficient (R), number of CpG/probes compared and p-values for e. g, Chord plot representing terms from the gene ontology analysis of upregulated genes in trophoblast organoids.
Extended Data Figure 6
Extended Data Figure 6. Structure and proliferation in trophoblast organoids.
a, A schematic diagram of a normal placental villus in vivo compared to a trophoblast organoid. The basement membrane (BM) beneath the VCT is contiguous with the stromal villous core in vivo and with the Matrigel in vitro. The SCT contacts maternal blood in the intervillous space in vivo. SCT forms in the centre of the organoids. b, IHC for TP63 in first trimester placenta and trophoblast organoids (representative images from n=14). TP63 is expressed in VCT. Scale bar, 50μm. Higher power insets scale bar, 20μm. c, Representative images of TP63, Ki67 and DAPI staining on trophoblast organoids by confocal microscopy (n=3). Cells on the outside of the organoids are TP63+ and Ki67+. Scale bars, 20μm. d, Confocal microscopy images of trophoblast organoid stained for EdU, EPCAM and DAPI showing fewer proliferating cells (white arrowheads) as the organoids enlarge. Scale bar, 50μm. Representative images from n=3. e, IHC for markers of SCT, CD46 and CD71, in first trimester placenta and trophoblast organoids (representative images from n=20). CD46 and CD71 stain the syncytial brush border. Scale bar, 50μm. Higher power insets scale bar, 20μm. f, Carnegie stage 5b embryo (~9 days post-fertilization)from Carnegie Collection at the early lacunar stage (number 8171). Courtesy of Prof. Enders and the Centre for Trophoblast Research (https://www.trophoblast.cam.ac.uk/Resources/enders). Arrows point to examples of cavities that appear in the primitive syncytium due to fluid accumulation before the coelomic cavity and the embryo have fully developed.g, Similar cavities in placental tissue samples from first trimester (6-9 weeks g.a) and in syncytium in centre of trophoblast organoids. Boxed areas are shown at higher magnification (bottom). Scale bars, 200μm (top); 50μm (bottom). Similar morphology seen in at least 5 early placental villi and in all organoids. ICM, inner cell mass. Pr.Syn. primitive syncytium; VCT, villous cytotrophoblast; SCT, syncytiotrophoblast; Str, stromal core.
Extended Data Figure 7
Extended Data Figure 7. Trophoblast organoids grown in TOM and EVTM.
a, Confocal image of organoid stained for F-actin, DAPI and HLA-G. A few isolated cells stain for HLA-G (white arrowheads) at the periphery of the organoid. Scale bar, 50 μm. Representative image from n= 3. b, Phase contrast images from time-lapse videos of 16h of trophoblast organoids grown in TOM when EVT differentiation does not occur (top). No invasive cells are visible. Shown for comparison is an organoid (middle) and a placental villous explant exposed to EVTM (bottom). Black arrows indicate cells migrating and arrowheads show visible tracks made as the cells invade through the Matrigel. For time-lapse videos of these cultures see Supplementary Videos 1, 4 and 5. Scale bars, 200μm.
Figure 1
Figure 1. Establishment of long-term organoid cultures of trophoblast from human placentas.
a, A placental villus at the maternal-fetal interface in the first trimester of pregnancy showing the different trophoblast subsets: SCT, VCT, CCC and EVT. Sources of the intrinsic and extrinsic signals that could signal to proliferative Ki67+ trophoblast cells (dark blue) are shown. b, IHC for Ki67 in early first trimester placenta (6-8 weeks g.a) compared to late first trimester (10-12 weeks g.a.). The proportion of proliferative cells is greatly reduced towards the end of first trimester and the cells are localized mostly in the CCC. Representative images from n =6 for each tissue type. Scale bars, 100μm. c, IHC for EPCAM on first trimester placenta (6-8 weeks g.a.) and cell clusters from placental digests. Experiment independently repeated twice with similar results. Arrowheads show VCT and CCC are EPCAM+ and these cells are present in the cell clumps from the placental digests. Scale bars, 50μm (placenta) and 200μm (placental digest). d, Time course for derivation of trophoblast organoids from one placental isolate. Bright field images of Matrigel drops after seeding placental digests starting from passage 0 day 0, until generation of homogenous trophoblast organoids (passage 2, day 7). For passages 0 and 1, timepoints at day 0 and 7 are shown. Passage 2, day 7 is shown together with the zoom of the boxed area in the lower panel. Experiment independently repeated for all organoid cultures with similar results. Scale bars, 500μm (Matrigel droplet images) and 200μm (zoom in on trophoblast organoids). Gestational age, g.a.; SCT, syncytiotrophoblast; VCT, villous cytotrophoblast; CCC, cytotrophoblast cell column; EVT, extravillous trophoblast; DG, decidual gland; SA, spiral artery; pl, placental; dec, decidual.
Figure 2
Figure 2. Trophoblast organoids retain characteristic features of first trimester trophoblast in vivo, and similar transcriptome and global methylation profiles.
a, IHC for TFAP2C shows uniform expression (representative images from n=20). Scale bars, 50μm. b, FACS analysis of three trophoblast organoids (TOrg10, 12, 14) and JEG (positive control) with mAb W6/32. Gating strategy see Extended Data Fig. 3c. Experiment independently repeated 3 times. c, Bisulfite sequencing of the ELF5 promoter region of trophoblast organoids (TOrg 6) and matched maternal leukocytes (positive control). Relative % of methylated cytosine residues (filled circles) are indicated. d, qPCR analysis for miR517-3p from C19MC cluster on trophoblast organoids (n=6), JEG-3 and JAR choriocarcinoma (Chc.) lines (positive controls) and peripheral blood monocytes (PBMC). Graph shows relative expression levels to housekeeping gene RNU48. Source Data File 1. e, PCA of placental villi (n=8); trophoblast organoids derived from different placentas, TOrg_1 (passage p4), TOrg_2 (p7), TOrg_3 (p6), TOrg_4 (p4) and TOrg_5 (p6) (n=5); placental stromal cells (n=5); and decidual organoids (n=3). Analysis based on 12673 probes. Organoids cluster more closely with placental villi on PC1 axis. f, Clustered heatmap of differentially expressed genes in first trimester placental villi (n=8)(blue), trophoblast organoids (n=5)(pink) and cultured placental villous stromal cells (n=5)(green). g, Distribution of methyl-cytosine across genomic features is similar between trophoblast organoids (n=4) and placental samples (n=4). In contrast, the brain (n=1) and maternal blood (n=5) samples show distinct patterns, especially across CpG islands, gene bodies and LINE1 elements. Pearson’s correlation coefficient (R) indicated for each comparison against trophoblast organoid samples (all p values <2.2e-16). Density/violin plots are scaled to area.
Figure 3
Figure 3. Trophoblast organoids form complex structures resembling placental villi with formation of syncytiotrophoblast (SCT).
a, Confocal microscopy images of trophoblast organoid stained for F-actin, EPCAM, DAPI merged with phase image (representative image from n=5). The EPCAM+ cells are surrounding the organoid. Scale bar, 100μm. b, IHC for CDH1 and Ki67 of first trimester placenta and trophoblast organoids (representative images from n=6 for Ki67 and n=20 for trophoblast organoids). VCT stains positively for CDH1. Ki67 is present in the inner VCT layer in villi and the outer layer in organoids. Scale bar, 50μm. Higher power in insets scale bar, 20μm. c, Electron micrograph images of first trimester SCT compared to the centre of a trophoblast organoid. Surface microvilli (arrowheads) and multinucleated areas can be seen (arrows). Scale bars, 5μm (placenta), 1μm (trophoblast organoids, microvilli) and 2.5μm (trophoblast organoids, nuclei). Representative images from n=2. d, qPCR analysis of genes ERVW-1 and GCM1 in trophoblast organoids (n=5) compared to whole placental villi (n=8) and stromal cells isolated from the placenta (n=5). Graphs show expression levels relative to geometric mean of three housekeeping genes TBP, TOP1 and HPRT1. The mean ERVW-1 and GCM1 expression are shown for each sample group. Source Data File 2.
Figure 4
Figure 4. Secretome of trophoblast organoids contains placental hormones and proteins.
a, Experimental work-flow for Liquid chromatography-mass spectrometry (LC-MS) analysis of the secretome of trophoblast organoids. Supernatants from six trophoblast organoid cultures derived independently from six different placental samples were analysed: TOrg_2 (p23), TOrg_3 (p20), TOrg_5 (p6), TOrg_10 (p12), TOrg_12 (p4) and TOrg_14 (p5). b, ELISA for GDF15 secreted by trophoblast organoids (n=6). Shown is amount of GDF15 (ng/mL) produced by trophoblast organoids (between day 7-10 after passaging) in 48h. Source Data File 3. c, ELISA for HCGβ secreted by trophoblast organoids (n=5). Shown is amount of HCGβ (ng/mL) produced by trophoblast organoids (between day 7-10 after passaging) in 48h. Source Data File 4. d, Over-the-counter pregnancy stick denoting “Pregnant” after being placed into dish containing cultures of trophoblast organoids. Image reproduced with the permission of SPD Swiss Precision Diagnostics GmbH (SPD). Experiment independently repeated twice.
Figure 5
Figure 5. Generation of migratory and invasive HLA-G+ extravillous trophoblast (EVT) cells from trophoblast organoids.
a, Phase-contrast images taken across several z-stacks combined into a single image by the extended focus module from Zeiss Axiovision of a trophoblast organoid and b, a placental villous explant plated into Matrigel after 7-10 days in EVT differentiation medium (EVTM). Regions of interest in samples are boxed in white and corresponding higher power snapshots are shown with relative time-lapse intervals in yellow (h:min). Migratory cells are labelled with yellow arrowhead. In EVTM, cells from both the organoids and primary tissue show random migration. See also control image for organoid in TOM (Extended Data Fig. 7b and time-lapse videos (Supplementary Videos 1-6). Scale bars, large images in a and b 200μm; images shown from insets, 50μm. c, Phase contrast images of trophoblast organoids plated in Matrigel drop and exposed to either TOM or EVTM. Cells stream out of organoids, digesting the Matrigel and eventually adhering to the plastic only when cultured in EVTM. Scale bars, 200μm. d, Live cells growing out from trophoblast organoids in EVTM stained with HLA-G monoclonal antibody, G233. Scale bar, 50μm. e, Flow cytometry of trophoblast organoids cultured in TOM or EVTM and double-stained with monoclonal antibodies W6/32 (binds all HLA class I molecules) and MEMG9 (specific for HLA-G). In TOM virtually all cells lack HLA class I expression but become HLA-G+ after culturing in EVTM. f, Histogram showing organoids cultured in TOM or EVTM stained for ITGA2, that marks cells at the base of the cytotrophoblast cell columns. Before exposure to EVTM, 23% cells are ITGA2+ but very few are present after differentiation to HLA-G+ EVT. All experiments (a-f) have been repeated independently at least 3 times.

Comment in

References

    1. Burton GJ, Jauniaux E. What is the placenta? Am J Obs Gynecol. 2015;213:S6 e1–S6 8. - PubMed
    1. Hamilton WJ, Boyd JD. Development of the human placenta in the first three months of gestation. J Anat. 1960;94:297–328. - PMC - PubMed
    1. Lee CQ, et al. What Is Trophoblast? A Combination of Criteria Define Human First-Trimester Trophoblast. Stem Cell Reports. 2016;6:257–272. - PMC - PubMed
    1. Kunath T, et al. Developmental differences in the expression of FGF receptors between human and mouse embryos. Placenta. 2014;35:1079–1088. - PubMed
    1. Paiva P, et al. Human chorionic gonadotrophin regulates FGF2 and other cytokines produced by human endometrial epithelial cells, providing a mechanism for enhancing endometrial receptivity. Hum Reprod. 2011;26:1153–1162. - PubMed

Publication types

MeSH terms

Substances