. 2018 Dec;564(7734):141-145.
doi: 10.1038/s41586-018-0758-y. Epub 2018 Nov 28.

CDK12 regulates DNA repair genes by suppressing intronic polyadenylation

Affiliations

CDK12 regulates DNA repair genes by suppressing intronic polyadenylation

Sara J Dubbury et al. Nature. 2018 Dec.

Abstract

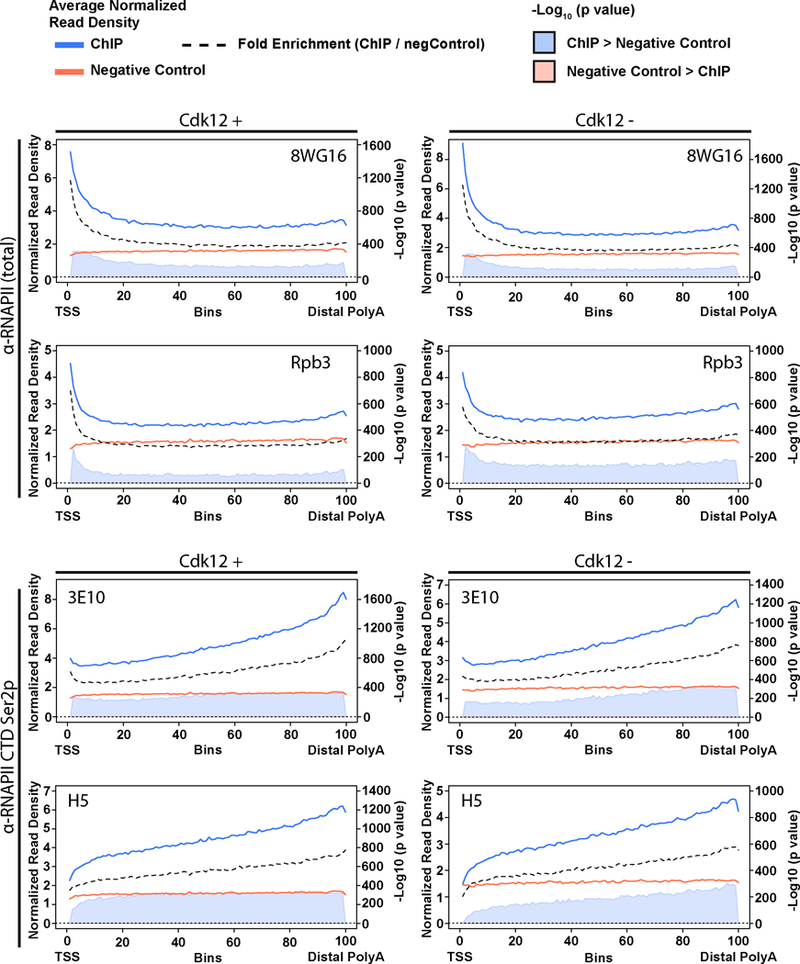
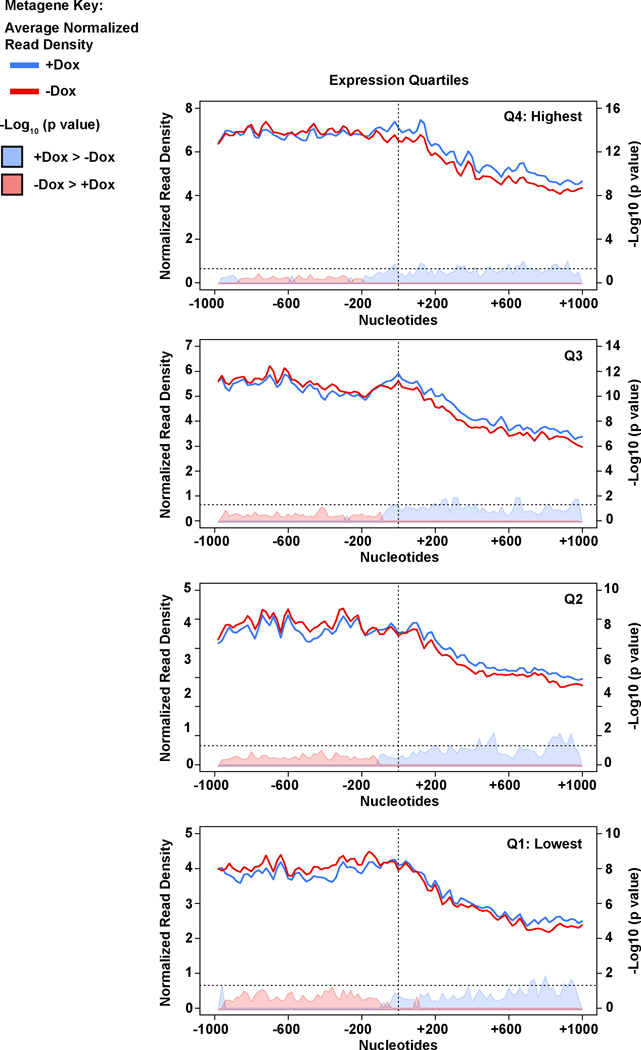
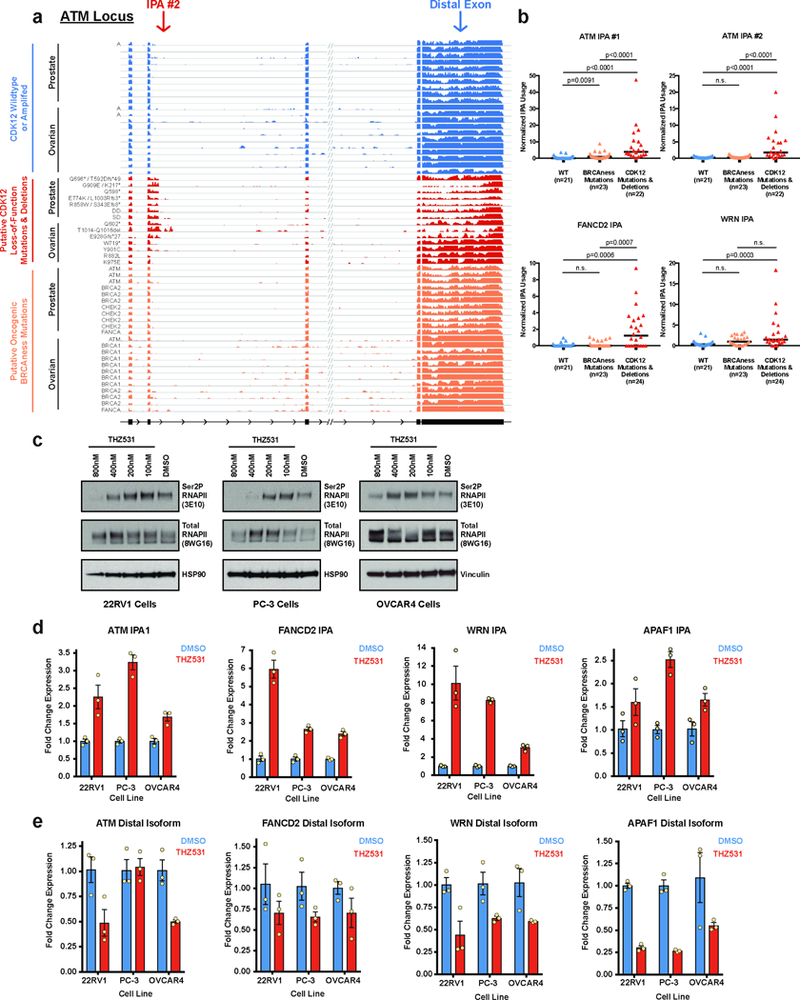
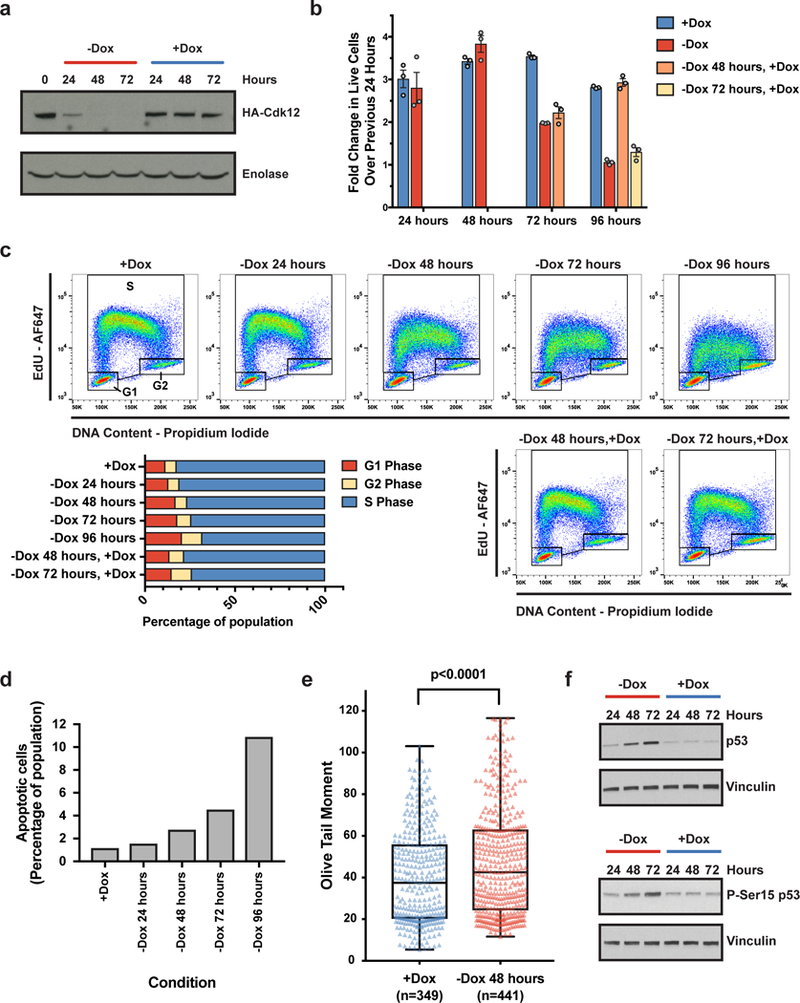
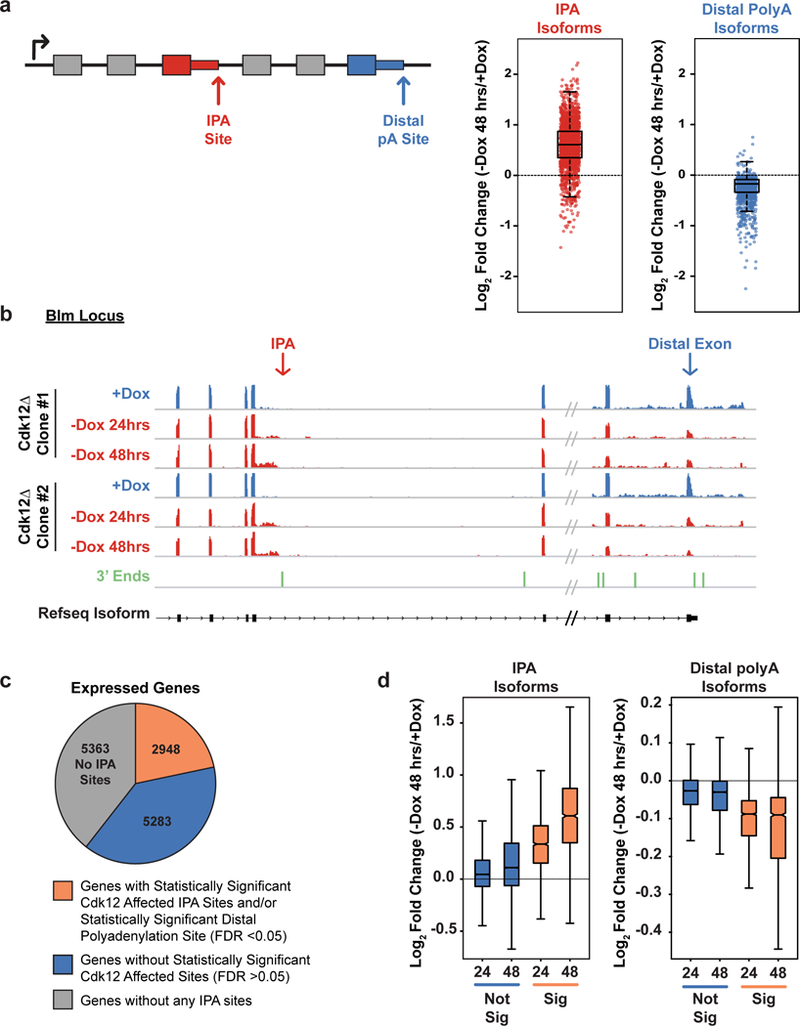
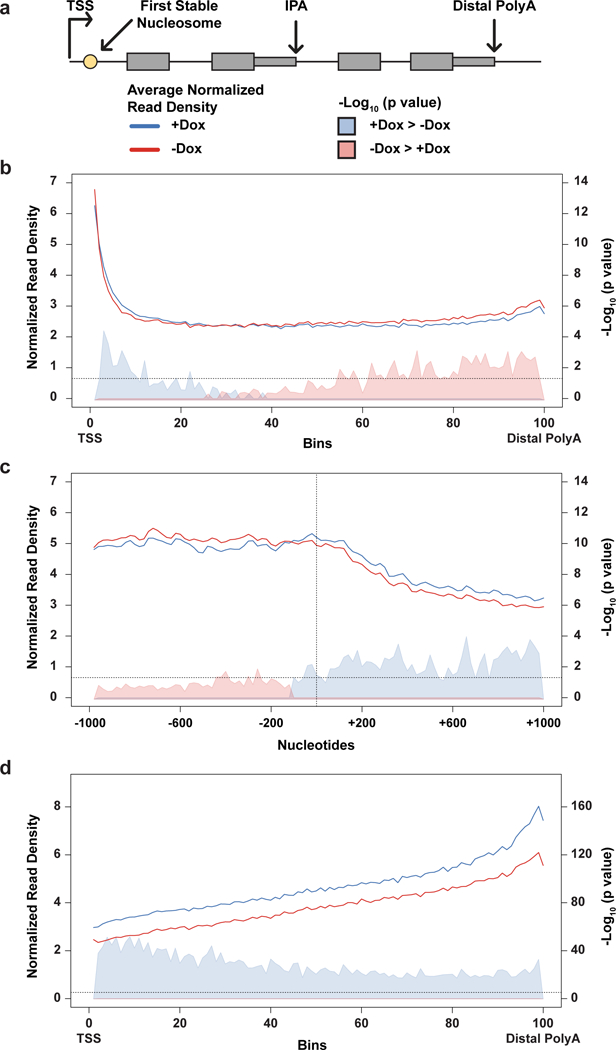
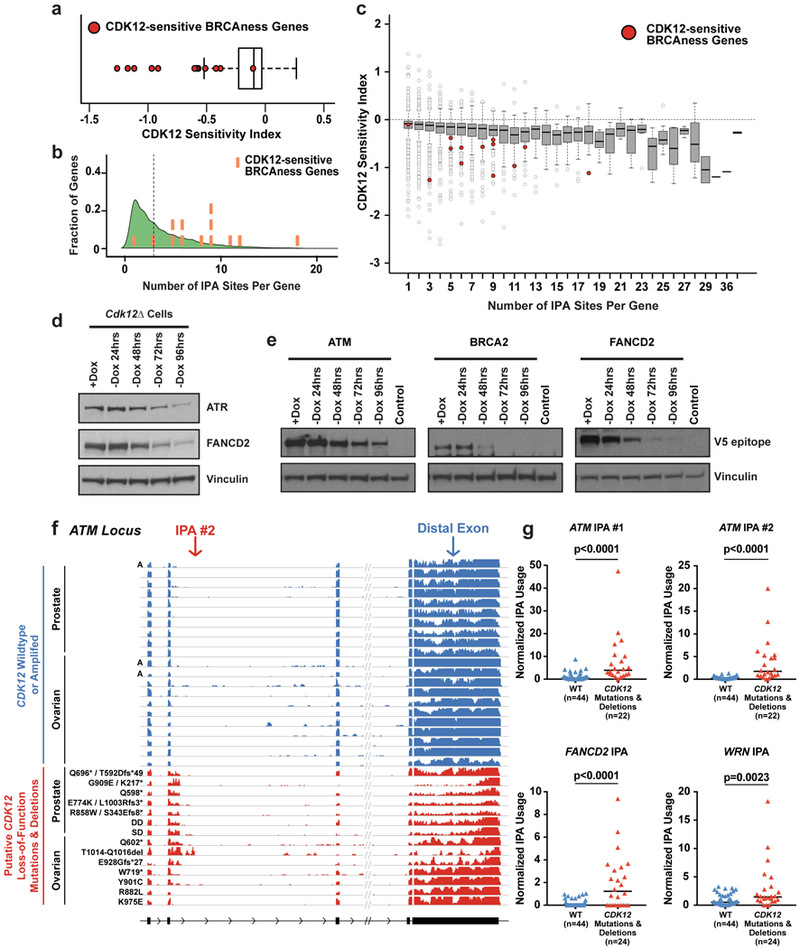
Mutations that attenuate homologous recombination (HR)-mediated repair promote tumorigenesis and sensitize cells to chemotherapeutics that cause replication fork collapse, a phenotype known as 'BRCAness'1. BRCAness tumours arise from loss-of-function mutations in 22 genes1. Of these genes, all but one (CDK12) function directly in the HR repair pathway1. CDK12 phosphorylates serine 2 of the RNA polymerase II C-terminal domain heptapeptide repeat2-7, a modification that regulates transcription elongation, splicing, and cleavage and polyadenylation8,9. Genome-wide expression studies suggest that depletion of CDK12 abrogates the expression of several HR genes relatively specifically, thereby blunting HR repair3-7,10,11. This observation suggests that the mutational status of CDK12 may predict sensitivity to targeted treatments against BRCAness, such as PARP1 inhibitors, and that CDK12 inhibitors may induce sensitization of HR-competent tumours to these treatments6,7,10,11. Despite growing clinical interest, the mechanism by which CDK12 regulates HR genes remains unknown. Here we show that CDK12 globally suppresses intronic polyadenylation events in mouse embryonic stem cells, enabling the production of full-length gene products. Many HR genes harbour more intronic polyadenylation sites than other expressed genes, and these sites are particularly sensitive to loss of CDK12. The cumulative effect of these sites accounts for the enhanced sensitivity of HR gene expression to CDK12 loss, and we find that this mechanism is conserved in human tumours that contain loss-of-function CDK12 mutations. This work clarifies the function of CDK12 and underscores its potential both as a chemotherapeutic target and as a tumour biomarker.


Figures

Extended Data Figure 1.
Extended Data Figure 1.. Generation of Cdk12 genetic knockouts in mESCs and phenotypic data from a second, independently-derived Cdk12Δ clone
a, Schematic of Cdk12Δ cell line generation, LoxP sites (red triangles), sgRNA cut sites (*), endogenous promoter (black arrows), doxycycline-inducible promoter (orange arrow). b, PCR products across the Cdk12 locus flanking exon 4 (primers shown as orange arrows) for wild type mESCs and Cdk12Δ clones. Clones 28 and 36 used throughout this study are indicated in red. c-h. Phenotypic data from the second of two independently-derived Cdk12Δ clones shown corresponding to results shown in Fig.1a-1f for the other clone. c, Representative immunoblot for Cdk12 transgene (HA epitope) expression after doxycycline (Dox) withdrawal. d, Fold change in live cells over previous 24 hours quantified by FACS; bars represent mean fold change (± standard error of the mean.) for n=3 biological replicates. Cells were grown continuously in Dox (blue bars), withdrawn from Dox at time 0 and maintained off Dox (red bars), or withdrawn from Dox at time 0 and reintroduced to Dox after 48 hours (orange bars) or 72 hours (yellow bars) for remainder of the time course. e, FACS-based cell cycle profiling of one representative replicate for the same conditions as in (d) (top) and quantification (bottom). f, FACS-based quantification of cleaved Caspase 3 positive (apoptotic) cells. One representative biological replicate shown. g. Neutral Comet assay to quantify degree of unrepaired DNA double stranded breaks in Cdk12Δ cells after 48 hours of doxycycline withdrawal. Boxplots: median value with 25th and 75th quartiles, whiskers: minimum to maximum. p value based on one-sided Mann-Whitney U test. h. Immunoblot for total and phosphorylated Ser15 (P-Ser15) p53 upon Cdk12 loss for the indicated times. Hsp90 serves as a loading control.
Extended Data Figure 2.
Extended Data Figure 2.. Gene expression changes in Cdk12-depleted mESCs are dominated by increased IPA usage
a, Volcano plots of significant gene expression events at the total gene level after 24 h (left) or 48 h (right) of Dox withdrawal. y-axis: FDR adjusted P value determined by the DESeq package in R; coloured dots: PPDE > 0.95 (posterior probability of differential expression, determined by the EBSeq package in R). b, Pie chart indicating genes that decrease (left) or increase (right) in total gene expression at a statistically significant level after 24 or 48 hours of Dox withdrawal (combined). Likely secondary effects are indicated: p53 repressed genes (red), p53 enhanced genes (blue), bivalent promoter genes (yellow), p53 repressed and bivalent promoter genes (orange), and p53 enhanced and bivalent promoter genes (green). Genes belonging to none of the above groups are indicated in gray. c, Table summarizing significant alternative splicing events observed after 24 and 48 hours of Dox depletion in Cdk12Δ cells. d-g, Isoform-specific RT-qPCR corroborating differential isoform usage observed in the RNA sequencing data. Blue bars (+Dox) and red bars (-Dox 48 hours) represent mean (± s.e.m.), n=4 biological replicates. Seven IPA isoforms from five genes were validated in two independent Cdk12Δ clones in d,e and the corresponding distal polyadenylation isoforms in those five genes were validated in f,g. d,f and e,g represent corresponding data from the two independently-derived Cdk12Δ clones used throughout this study. h, Left: IPA sites exhibiting a statistically significant (padj < 0.05, FDR adjusted p value determined by the DEXSeq package in R) change (orange) or not (blue) in expressed genes after 24 or 48 hours of Dox depletion. Right: Expressed genes with terminal polyadenylation sites that are significantly changed (orange) or not statistically significant (blue) as normalized to the rest of the transcript. i, Scatterplot showing log2 fold changes upon Cdk12 loss in distal exons (y-axis) versus IPA sites (x-axis) in genes that have both a statistically significant (padj < 0.05, FDR adjusted p value determined by the DEXSeq package in R) IPA site and a statistically significant distal polyadenylation change; n=4 biological replicates per condition.
Extended Data Figure 3.
Extended Data Figure 3.. ChIP antibodies recognizing the same target protein exhibit strongly overlapping metagene patterns
Metagene profiles broken down by individual antibodies used. Blue lines: normalized read density for the specific ChIP antibody in n=2 biological replicates. Orange lines: negative control (combined whole cell extract and all antibody negative controls n=4 biological replicates). Black dashed lines: fold-enrichment (specific ChIP / negative control). Shaded areas: -log10 (bin-wise p values, Kolmogorov-Smirnov one-sided test) of the difference in read depth, with blue shading indicating the plus Cdk12 signal is significantly greater. The -log10 of the p value is shown in the axis on the right, and the horizontal dashed line is p = 0.05. TSS=Transcription Start Site; DPA=Distal PolyAdenylation site.
Extended Data Figure 4.
Extended Data Figure 4.. Schematic of ChIP experiments and data analysis
a, Schematic of biological replicate/antibody replicate experimental design. Each ChIP set (RNAPII and Ser2p, in Cdk12+/−) consists of 2 biological replicates each ChIP’ed with two different antibodies recognizing the same protein. These four replicates were then combined for the ChIP metagene analyses. b-d, Schematic of the steps used to determine average read densities for the ChIP assays, and the statistical test used to determine significant differences in the read density dependent on Cdk12 expression.
Extended Data Figure 5.
Extended Data Figure 5.. RNAPII metagene patterns are influenced by gene length and expression
a, Length and expression quartiles of the significantly changing (padj < 0.05, FDR adjusted p value determined by the DEXSeq package in R) IPA/distal isoform genes. Boxplots: median value, 25th and 75th quartiles; whiskers: 1.5 x interquartile range. n=4 biological replicates per condition. Top panels: size distributions (log10 of length in nucleotides) of each length quartile (left) and gene expression distributions (log10 of transcripts per million) of each expression quartile (right) compared to the respective distributions of all expressed genes. Bottom panels: expression distributions for each length quartile (left) and length distributions for each expression quartile (right). Note that gene length is generally inversely correlated with expression level, but median expression of all quartiles of the significantly changing IPA/distal isoforms is higher than the median for all expressed genes. Additionally, the median length of all expression quartiles of the significantly changing IPA/distal isoforms is longer than the median for all expressed genes. Thus, the genes comprising the significantly changing IPA/distal isoform set are longer and more highly expressed for their length than the broader gene population. b, Metagene profiles of RNAPII density in genes with a statistically-significant Cdk12-sensitive IPA or terminal site divided into length-based quartiles. TSS=Transcription Start Site; DPA=Distal PolyAdenylation site. Note that in the shortest quartile, the Cdk12-depleted cells show a trend toward increased density at the 3’ end, but the shortest genes terminate before the polymerase can reach a higher density than the Cdk12 competent cells. Conversely, the longest genes are expressed at a lower level (see (a)) resulting in lower RNAPII ChIP signal. For these reasons, the shortest and longest length quartiles were excluded in Fig. 3b,d. c, Metagene profiles of RNAPII density in genes with a statistically-significant Cdk12-sensitive IPA or terminal site divided into expression-based quartiles. (b),(c): n=4 biological replicates per condition.
Extended Data Figure 6.
Extended Data Figure 6.. RNAPII ChIP pattern is not specific to Cdk12 IPA-affected genes
a, Metagene profile of RNAPII density in a set of control genes length-matched to the significantly changing IPA/distal isoforms gene set. Top: all control genes. Bottom: shortest and longest quartiles removed (as in Fig. 3B). TSS=Transcription Start Site; DPA=Distal polyadenylation site. b, Metagene profile of RNAPII density in a set of control genes length-matched to the significantly changing IPA/distal isoforms gene set divided into length quartiles. c, Metagene profile of RNAPII density in a set of control genes expression-matched to the significantly changing IPA/distal isoforms gene set. d, Metagene profile of RNAPII density in a set of control genes expression-matched to the significantly changing IPA/distal isoforms gene set divided into expression quartiles. (a),(b),(c),(d): n=4 biological replicates per condition.
Extended Data Figure 7.
Extended Data Figure 7.. Increased RNAPII upstream and decreased RNAPII downstream of first stable nucleosome occurs in all gene expression quartiles
Total RNAPII metagene density 1 kb upstream and 1kb downstream of the first stable nucleosome for the significantly changing IPA/distal isoforms divided into gene expression quartiles. As in Fig 3C, solid lines indicate normalized read depth with (blue) or without (red) Cdk12, and shaded areas indicate - log10 (bin-wise p values, Kolmogorov-Smirnov one-sided test) of the difference in read depth, with blue shading indicating the plus Cdk12 signal is significantly greater, and pink shading indicating the minus Cdk12 signal is significantly greater. Horizontal dashed line is p = 0.05. Vertical dashed line indicates the position of the first stable nucleosome dyad. n=4 biological replicates per condition.
Extended Data Figure 8.
Extended Data Figure 8.. Ser2p is depleted by Cdk12 loss and metagene patterns are influenced by gene expression and length
Left panels: Metagene profiles of Ser2p density in genes with a statistically-significant (padj < 0.05, FDR adjusted p value determined by the DEXSeq package in R) Cdk12-sensitive IPA or terminal site divided into length-based quartiles. As in Fig. 3D, solid blue lines indicate average normalized read density in Cdk12+ cells, red solid lines are the average normalized read density in Cdk12-depleted samples. Light blue shading indicates the plus Cdk12 signal is significantly greater. TSS=Transcription Start Site; DPA=Distal PolyAdenylation site. n=4 biological replicates per condition. Right panels: Metagene profiles of Ser2p density in genes with a statistically-significant Cdk12-sensitive IPA or terminal site divided into expression-based quartiles. n=4 biological replicates per condition.
Extended Data Figure 9.
Extended Data Figure 9.. Model for Cdk12-dependent effects gene expression
Upper panel: As RNAPII transcribes through a region of a gene (exonic regions shown in blue with 5’ and 3’ splice sites (SS) indicated, introns in gray) containing an IPA site (red octagon), Cdk12-dependent RNAPII-CTD Ser2 phosphorylation suppresses IPA site usage. Lower panel: In the absence of Cdk12, RNAPII-CTD Ser2 phosphorylation is decreased. IPA site usage increases resulting in increased truncated isoforms and decreased distal-most isoforms. RNAPII that transcribes through the downstream exon accumulates with increasing density toward the 3’ end of the gene. IPA usage is in competition with the splicing of its encompassing intron. Decreasing the efficiency of splicing or increasing the activity of cleavage and polyadenylation could both increase IPA usage. Alternatively, a decrease in the efficiency of transcription elongation could alter the kinetic balance to favor IPA usage. Indeed, previous studies have suggested that slower RNAPII elongation rates, due to mutant polymerases or alterations in transcription elongation factors, increased IPA usage over that of distal sites. All three of these possibilities have been related to RNAPII Ser2p, however, how Cdk12-dependent phosphorylation of Ser2p is related to these non-mutually exclusive possibilities is unclear.
Extended Data Figure 10.
Extended Data Figure 10.. Upregulated IPA usage in human tumors is specific to CDK12 LOF mutations and not mutations in other BRCAness genes; treatment of human ovarian and prostate cancer cell lines with THZ531 phenocopies the increased IPA site usage observed upon CDK12 genetic loss.
a, RNA-seq read density from TCGA tumors of prostate adenocarcinoma and ovarian cystadenocarcinoma with the indicated mutational status at a CDK12-sensitive IPA site in the human ATM locus (ATM IPA #2). Tumors shown in blue are wild type for CDK12 and diploid unless marked as amplified (A). Tumors shown in red carry missense putative driver mutations, truncating mutations, or shallow (SD) or deep (DD) gene deletions at the CDK12 locus. Of note, all of the ovarian cystadenocarcinoma tumors that carry CDK12 point mutations also have a shallow deletion at the CDK12 locus except for the tumor with the R882L missense mutation, which is diploid across the locus. The 23 tumors in orange harbor putative driver mutations in the other BRCAness genes (ATM, BRCA1, BRCA2, FANCA, or CHEK2) as noted. b, Quantification of usage of two different IPA sites in human ATM and at IPA sites in FANCD2 and WRN in human prostate and ovarian tumors from TCGA data (combined in this analysis). Tumors with wild type or amplified CDK12 are shown in blue (WT), those with CDK12 deletions, missense mutations, or truncating mutations in red (Mut), and those with “putative driver mutations” in the five BRCAness genes (ATM, BRCA1, BRCA2, FANCA, and CHEK2) in orange. Medians are indicated by horizontal black bars and sample sizes are indicated below. p values were determined by one-sided Mann-Whitney U test. c, Immunoblots showing the effect of 4 hours of THZ531 treatment versus DMSO on RNAPII pSer2 (3E10 antibody) in two prostate carinoma cell lines (22RV1 and PC-3) and one high-grade serous ovarian carcinoma cell line (OVCAR4). Total RNAPII (8WG16 antibody), HSP90, and Vinculin are shown as loading controls. d,e, Isoform-specific RT-qPCR used to assay for the expression of IPA and distal polyadenylation isoforms in two prostate carcinoma cell lines (22RV1 and PC-3) and one high-grade serous ovarian carcinoma cell line (OVCAR4) after 4 hours of 400nM THZ531 treatment compared to vehicle (DMSO). Blue bars (DMSO) and red bars (THZ531) represent mean (± standard error of the mean) for n=3 biological replicates. d, Four IPA sites were assayed. Three IPA sites were identified in the TCGA data from human ovarian and prostate tumors (ATM IPA #1, FANCD2 IPA, and WRN IPA; Fig. 4f,4g and Extended Data Fig. 10a,b). One IPA site corresponded to a significantly changing IPA site in our mESC Cdk12Δ clones (Apaf1). e, Distal polyadenylation isoforms for the genes in (d).
Figure 1.
Figure 1.. Cdk12 depletion causes attenuated DNA damage repair in mESCs
a-f, Phenotypic data from one Cdk12Δ clone. a, Representative immunoblot for Cdk12 (HA-Cdk12) after Dox withdrawal. b, Fold change in live cells over previous 24 hours. Bars: mean fold change (± s.e.m., n=3 biological replicates) for cells grown in Dox continuously (blue), off Dox starting at time 0 (red), or off Dox beginning at time 0 and reintroduced to Dox after 48 (orange) or 72 hours (yellow) for remainder of the experiment. c, FACS cell cycle profiling of one representative biological replicate for the same conditions as in (b), quantified in barplot. d, Quantification of apoptotic cells upon Cdk12 loss for one representative experiment. e. Comet assay for DNA double-stranded breaks in Cdk12Δ cells after 48 hours of Dox withdrawal. Boxplots: median value with 25th and 75th quartiles, whiskers: minimum to maximum. p value based on one-sided Mann-Whitney U test. f. Immunoblot of total and Ser15 phosphorylated (P-Ser15) p53 upon Cdk12 loss.
Figure 2.
Figure 2.. Cdk12 loss increases intronic polyadenylation (IPA) and decreases distal polyadenylation
a, Left: Schematic showing an IPA and a distal polyadenylation site. Right: Log2 fold change in normalized read density (-Dox 48 hours/+Dox) for IPA isoforms (red) and distal polyadenylation isoforms (blue) reaching statistical significance (padj < 0.05). b, RNAseq read density across the 3’ end of Blm at one IPA site and at the distal exon; in Dox (blue, n=2 biological replicates per clone) or after Dox withdrawal for 24 or 48 hours (red, n=2 biological replicates per time point and clone). 3’ end sequencing read density below in green. c, Expressed genes with at least one significantly changing IPA and/or distal isoform (orange), at least one IPA isoform with no significant change in IPA or distal isoforms (blue), or genes without any identified IPA sites (grey). d, Log2 fold changes of all IPA sites (left) and all terminal sites (right) in expressed genes that change significantly upon Dox depletion for 24 or 48 hours (orange) or that do not change significantly upon Dox depletion after 24 or 48 hours (blue). (a),(d) FDR adjusted p value determined by the DEXSeq package in R; n=4 biological replicates for each condition; boxplot: median value, 25th and 75th quartiles; whiskers: 1.5x interquartile range.
Figure 3.
Figure 3.. Cdk12 loss results in altered RNAPII elongation dynamics and decreased RNAPII-CTD Ser2 phosphorylation
a, Schematic of gene elements and key to metagene plots. b, Metagene profile of total RNAPII density from the transcription start site (TSS) to the distal polyadenylation site. c, Total RNAPII metagene density 1 kb upstream/downstream of the first stable nucleosome dyad (dashed vertical line). d, RNAPII CTD Ser2p metagene density. (b), (c), and (d) include genes with significantly changing IPA/distal isoforms; solid lines indicate normalized read density with (blue, n=4 independent ChIPs) or without (red, n=4 independent ChIPs) Cdk12; shaded areas indicate -log10 (bin-wise p value, Kolmogorov-Smirnov one-sided test) of the difference in read density (blue indicates Cdk12+ signal is greater, pink indicates Cdk12- signal is greater). Horizontal dashed line: p = 0.05. Shortest and longest gene length quartiles are excluded in (b) & (d), (see Extended Data Fig. 5).
Figure 4.
Figure 4.. HR genes are highly responsive to Cdk12 loss and human tumors with CDK12 LOF upregulate IPAs
a, Distribution of the Cdk12 Sensitivity Index for all expressed genes with at least one IPA site. Cdk12-sensitive HR genes highlighted as red circles. Boxplots a,c: median value, 25th and 75th quartiles; whiskers: 1.5x interquartile range. a,c n=4 biological replicates per condition. b, Kernel density plot showing distribution of IPA sites per gene in expressed genes with at least one IPA site. Cdk12-sensitive HR genes superimposed as orange bars (left to right: Bap1, Atr, Fancl, Wrn, Brca1, Brca2, Fancm, Brip1, Fancd2, Fanci, Blm, Fanca, Atm). c, Cdk12 Sensitivity Index for expressed genes grouped by number of IPA sites per gene. Cdk12-sensitive HR genes highlighted as red circles. d, Immunoblots of Atr and Fancd2 (endogenous antibodies) in Cdk12Δ cells after Dox removal. e, Immunoblots for representative clone of each cell line endogenously V5 epitope-tagged at Atm, Brca2, and Fancd2 in Cdk12Δ cells after Dox removal. Lysate from untagged Cdk12Δ cells (+Dox) is control. f, RNAseq read density in ATM from TCGA tumors with the indicated mutational status. Tumors shown in blue are wild type for CDK12 and diploid unless marked as amplified (A). Tumors shown in red carry missense putative driver mutations, truncating mutations, or shallow (SD) or deep (DD) CDK12 gene deletions. All ovarian tumors with CDK12 mutations (except R882L) also carry shallow deletions in CDK12. g, Quantification of IPA usage in ATM (2 different IPAs), FANCD2 and WRN in TCGA tumors. Tumors with wild type or amplified CDK12 are shown in blue (WT), those with CDK12 deletions, missense mutations, or truncating mutations in red (Mut). Black bars: medians. Sample size indicated below. p values: one-sided Mann-Whitney U test.

Comment in

References

    1. Lord CJ & Ashworth A BRCAness revisited. Nat. Rev. Cancer 16, 110–120 (2016). - PubMed
    1. Bartkowiak B et al. CDK12 is a transcription elongation-associated CTD kinase, the metazoan ortholog of yeast Ctk1. Genes Dev. 24, 2303–2316 (2010). - PMC - PubMed
    1. Blazek D et al. The Cyclin K/Cdk12 complex maintains genomic stability via regulation of expression of DNA damage response genes. Genes Dev. 25, 2158–2172 (2011). - PMC - PubMed
    1. Zhang T et al. Covalent targeting of remote cysteine residues to develop CDK12 and CDK13 inhibitors. Nat. Chem. Biol. 12, 876–884 (2016). - PMC - PubMed
    1. Ekumi KM et al. Ovarian carcinoma CDK12 mutations misregulate expression of DNA repair genes via deficient formation and function of the Cdk12/CycK complex. Nucleic Acids Res. 43, 2575–2589 (2015). - PMC - PubMed

Additional References

    1. Ran FA et al. Genome engineering using the CRISPR-Cas9 system. Nat. Protoc. 8, 2281–2308 (2013). - PMC - PubMed
    1. Cong L et al. Multiplex genome engineering using CRISPR/Cas systems. Science 339, 819–823 (2013). - PMC - PubMed
    1. Gurtan AM, Lu V, Bhutkar A & Sharp PA In vivo structure-function analysis of human Dicer reveals directional processing of precursor miRNAs. RNA 18, 1116–1122 (2012). - PMC - PubMed
    1. Gyori BM, Venkatachalam G, Thiagarajan PS, Hsu D & Clement M-V OpenComet: An automated tool for comet assay image analysis. Redox Biology 2, 457–465 (2014). - PMC - PubMed
    1. Skene PJ & Henikoff S A simple method for generating high-resolution maps of genome-wide protein binding. eLife 4, 1–9 (2015). - PMC - PubMed

Publication types

MeSH terms