

MRP3 is a sex determining gene in the diatom Pseudo-nitzschia multistriata
- PMID: 30487611
- PMCID: PMC6261938
- DOI: 10.1038/s41467-018-07496-0
MRP3 is a sex determining gene in the diatom Pseudo-nitzschia multistriata
Abstract
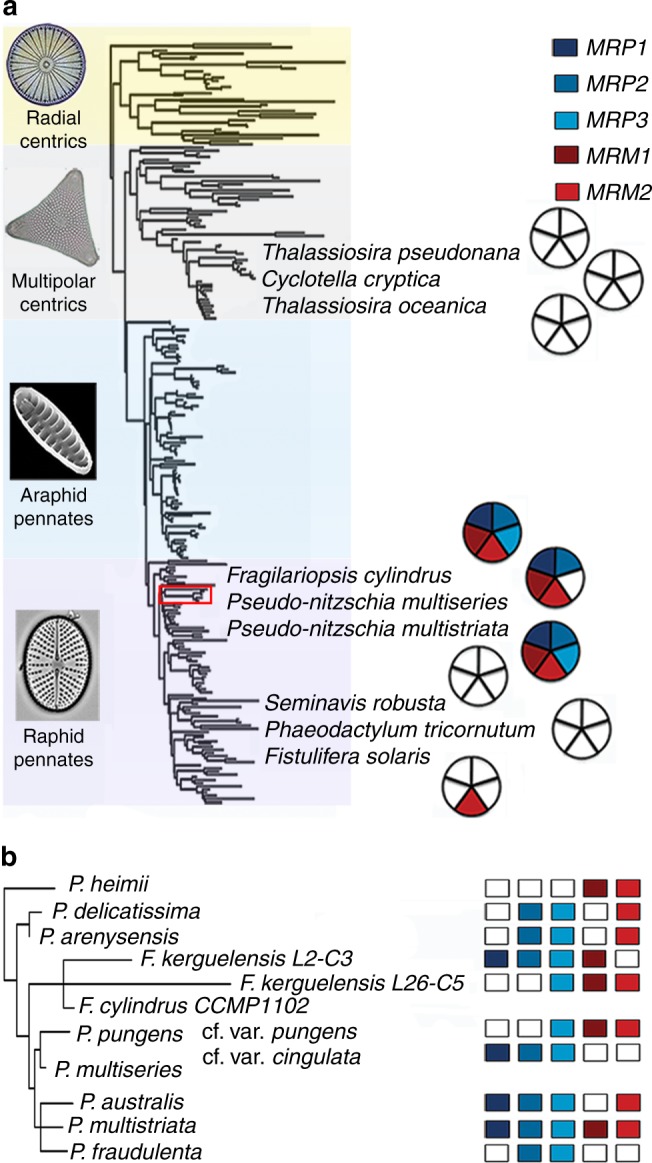
A broad diversity of sex-determining systems has evolved in eukaryotes. However, information on the mechanisms of sex determination for unicellular microalgae is limited, including for diatoms, key-players of ocean food webs. Here we report the identification of a mating type (MT) determining gene for the diatom Pseudo-nitzschia multistriata. By comparing the expression profile of the two MTs, we find five MT-biased genes, of which one, MRP3, is expressed exclusively in MT+ strains in a monoallelic manner. A short tandem repeat of specific length in the region upstream of MRP3 is consistently present in MT+ and absent in MT- strains. MRP3 overexpression in an MT- strain induces sex reversal: the transgenic MT- can mate with another MT- strain and displays altered regulation of the other MT-biased genes, indicating that they lie downstream. Our data show that a relatively simple genetic program is involved in defining the MT in P. multistriata.
Conflict of interest statement
The authors declare no competing interests.
Figures

Similar articles
-
New alleles in the mating type determination region of West Atlantic strains of Pseudo-nitzschia multistriata.Harmful Algae. 2021 Mar;103:101995. doi: 10.1016/j.hal.2021.101995. Epub 2021 Feb 20. Harmful Algae. 2021. PMID: 33980435
-
Establishment of Genetic Transformation in the Sexually Reproducing Diatoms Pseudo-nitzschia multistriata and Pseudo-nitzschia arenysensis and Inheritance of the Transgene.Mar Biotechnol (NY). 2015 Aug;17(4):452-62. doi: 10.1007/s10126-015-9633-0. Epub 2015 Apr 14. Mar Biotechnol (NY). 2015. PMID: 25869745
-
Identification of the meiotic toolkit in diatoms and exploration of meiosis-specific SPO11 and RAD51 homologs in the sexual species Pseudo-nitzschia multistriata and Seminavis robusta.BMC Genomics. 2015 Nov 14;16:930. doi: 10.1186/s12864-015-1983-5. BMC Genomics. 2015. PMID: 26572248 Free PMC article.
-
Diatom Molecular Research Comes of Age: Model Species for Studying Phytoplankton Biology and Diversity.Plant Cell. 2020 Mar;32(3):547-572. doi: 10.1105/tpc.19.00158. Epub 2019 Dec 18. Plant Cell. 2020. PMID: 31852772 Free PMC article. Review.
-
The diatom molecular toolkit to handle nitrogen uptake.Mar Genomics. 2015 Dec;24 Pt 1:95-108. doi: 10.1016/j.margen.2015.05.018. Epub 2015 Jun 6. Mar Genomics. 2015. PMID: 26055207 Review.
Cited by
-
Genetic engineering in diatoms: advances and prospects.Plant J. 2025 Mar;121(6):e70102. doi: 10.1111/tpj.70102. Plant J. 2025. PMID: 40089910 Free PMC article. Review.
-
What Was Old Is New Again: The Pennate Diatom Haslea ostrearia (Gaillon) Simonsen in the Multi-Omic Age.Mar Drugs. 2022 Mar 29;20(4):234. doi: 10.3390/md20040234. Mar Drugs. 2022. PMID: 35447907 Free PMC article. Review.
-
Diatom heterotrophy on brown algal polysaccharides emerged through horizontal gene transfer, gene duplication, and neofunctionalization.PLoS Biol. 2025 Apr 1;23(4):e3003038. doi: 10.1371/journal.pbio.3003038. eCollection 2025 Apr. PLoS Biol. 2025. PMID: 40168346 Free PMC article.
-
Light intensity and spectral composition drive reproductive success in the marine benthic diatom Seminavis robusta.Sci Rep. 2021 Sep 2;11(1):17560. doi: 10.1038/s41598-021-92838-0. Sci Rep. 2021. PMID: 34475415 Free PMC article.
-
Life cycle strategies in free-living unicellular eukaryotes: Diversity, evolution, and current molecular tools to unravel the private life of microorganisms.J Eukaryot Microbiol. 2024 Nov-Dec;71(6):e13052. doi: 10.1111/jeu.13052. Epub 2024 Jul 31. J Eukaryot Microbiol. 2024. PMID: 39085163 Free PMC article. Review.
References
Publication types
MeSH terms
LinkOut - more resources
Full Text Sources
