. 2019 Jan;14(1):100-118.
doi: 10.1038/s41596-018-0084-8.

Collection, pre-processing and on-the-fly analysis of data for high-resolution, single-particle cryo-electron microscopy

Affiliations

Collection, pre-processing and on-the-fly analysis of data for high-resolution, single-particle cryo-electron microscopy

Rebecca F Thompson et al. Nat Protoc. 2019 Jan.

Abstract

The dramatic growth in the use of cryo-electron microscopy (cryo-EM) to generate high-resolution structures of macromolecular complexes has changed the landscape of structural biology. The majority of structures deposited in the Electron Microscopy Data Bank (EMDB) at higher than 4-Å resolution were collected on Titan Krios microscopes. Although the pipeline for single-particle data collection is becoming routine, there is much variation in how sessions are set up. Furthermore, when collection is under way, there are a range of approaches for efficiently moving and pre-processing these data. Here, we present a standard operating procedure for single-particle data collection with Thermo Fisher Scientific EPU software, using the two most common direct electron detectors (the Thermo Fisher Scientific Falcon 3 (F3EC) and the Gatan K2), as well as a strategy for structuring these data to enable efficient pre-processing and on-the-fly monitoring of data collection. This protocol takes 3-6 h to set up a typical automated data collection session.


Conflict of interest statement

Competing interests

The authors declare no competing interests.

Figures

Fig. 1
Fig. 1. Flowchart of the procedures.
a,b, Flowchart describing the main steps of the procedure for F3EC (a) and that for the energy-filtered K2 Summit (b), with approximate timings. We expect this procedure to take 3–6 h, although timing will be specimen dependent.
Fig. 2
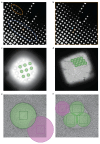
Fig. 2. EPU setup.
a, Typical Atlas view with thick (orange), appropriate thickness (blue) and dry (white) areas indicated (which will vary by sample). b, Square selection on an Atlas. Each square should be inspected to ensure that it is not broken (data collected on broken squares may have more motion, affecting data quality) and that the ice thickness is appropriate for the specimen. Grid squares that have been collected are in blue; orange indicates collection in progress, and green indicates areas to be collected. c, Grids with regular hole (green circles) selection. Holes close to the grid square bars (which typically are poorly vitrified) are deselected. d, Lacy carbon with thin continuous film acquisition area selection. Outer green circles represent beam diameter; inner squares represent exposure area. Note that large contaminants, areas at the edge of the square and areas where the carbon support/hole ratio is poor are deselected. e, Template with single shot per hole and whole hole illumination. Scale bar, 1 μm. f, Template with multiple shots per hole. In e and f, autofocus and drift measurement areas (purple) are overlaid; green circles represent the illuminated area and inner squares the exposure area. Scale bars, 50 μm (a,b); 35 μm (c); 10 μm (d); 1 μm (e,f).
Fig. 3
Fig. 3. On-the-fly data processing pipeline (Steps 42–51).
Data are copied from their write-on F3EC and K2 locations to a storage location. Symbolic links are then made to the processing directory, where RELION batch jobs are used to motion-correct and perform CTF estimation. The outputs from this are plotted by micrograph analysis for the user to inspect.
Fig. 4
Fig. 4. Example output of the micrograph analysis script.
a, A scatter plot of the two orthogonal defocus measurements provides a quick visual assessment of the range of defocus values in the dataset. b–d, Histograms describe the overall dataset estimated resolution (b), astigmatism (c) and phase shift (d). e,f, Plots show estimated resolution (e) and astigmatism (f) values for each micrograph in order as they were acquired, expressed as a percentage of the mean values for the entire dataset. Large changes in these values over time suggest that a problem may have occurred during the data-acquisition run. g, Plot of phase shift for each microscope in order of acquisition allows the tracking of the change in phase shift as the plate becomes charged and the microscope moves to new phase plate positions. The non-phase-shift version of the script produces identical output, minus d and g.

References

    1. Cheng Y, Grigorieff N, Penczek PA, Walz T. A primer to single-particle cryo-electron microscopy. Cell. 2015;161:438–449. doi: 10.1016/j.cell.2015.03.050. - DOI - PMC - PubMed
    1. Renaud J-P, et al. Cryo-EM in drug discovery: achievements, limitations and prospects. Nat Rev Drug Discov. 2018;17:471–492. - PubMed
    1. Thompson RF, Walker M, Siebert CA, Muench SP, Ranson NA. An introduction to sample preparation and imaging by cryo-electron microscopy for structural biology. Methods. 2016;100:3–15. doi: 10.1016/j.ymeth.2016.02.017. - DOI - PMC - PubMed
    1. Kuehlbrandt W. The resolution revolution. Science. 2014;343:1443–1444. - PubMed
    1. Ruskin RS, Yu Z, Grigorieff N. Quantitative characterization of electron detectors for transmission electron microscopy. J Struct Biol. 2013;184:385–393. doi: 10.1016/j.jsb.2013.10.016. - DOI - PMC - PubMed

Publication types

MeSH terms

Substances