. 2018 Nov;63(3):181-191.
doi: 10.3164/jcbn.17-141. Epub 2018 Jul 11.

High phosphate diet suppresses lipogenesis in white adipose tissue

Affiliations

High phosphate diet suppresses lipogenesis in white adipose tissue

Yukiko Imi et al. J Clin Biochem Nutr. 2018 Nov.

Abstract

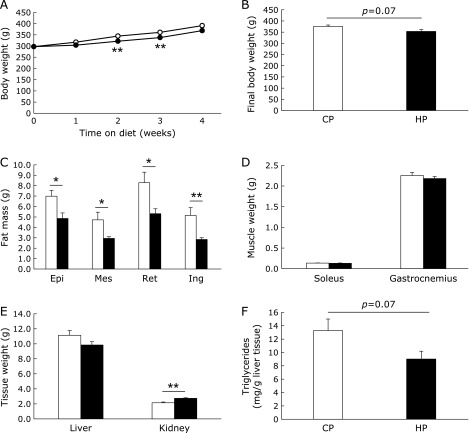
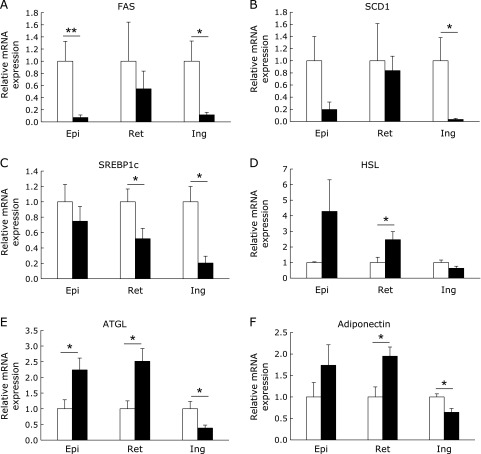
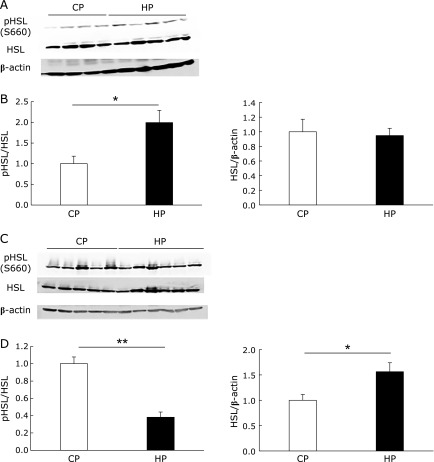
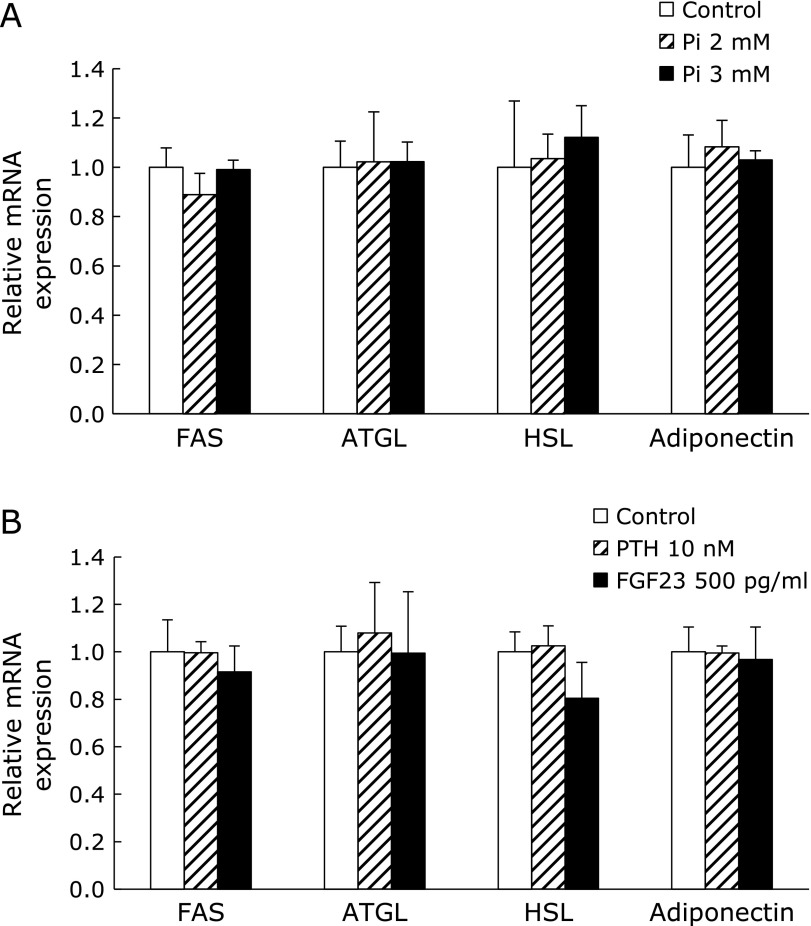
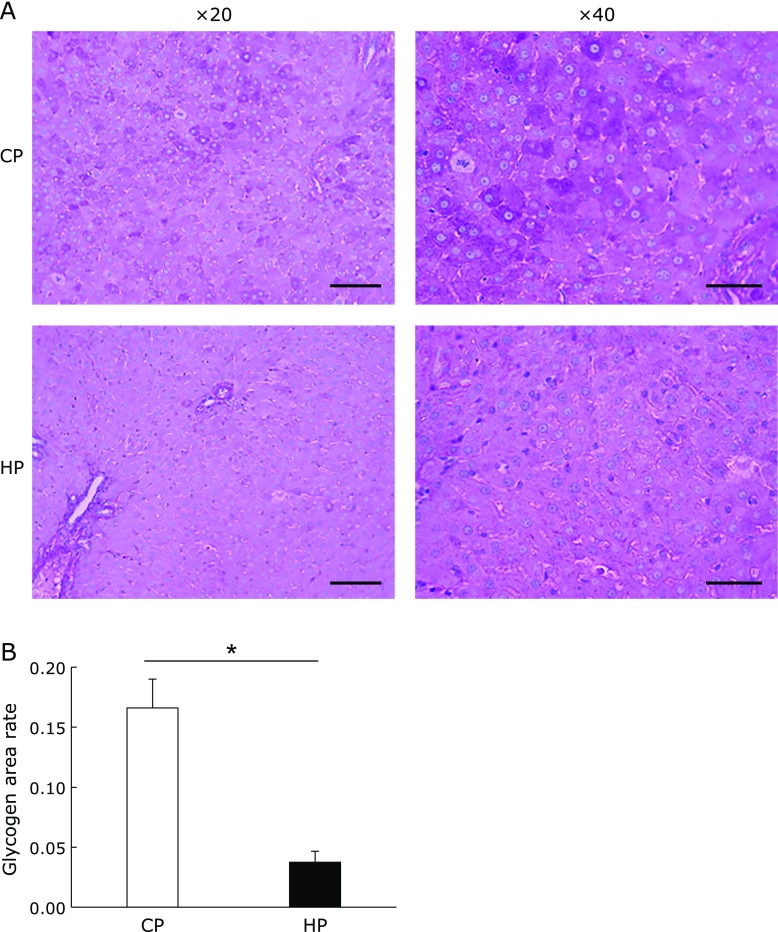
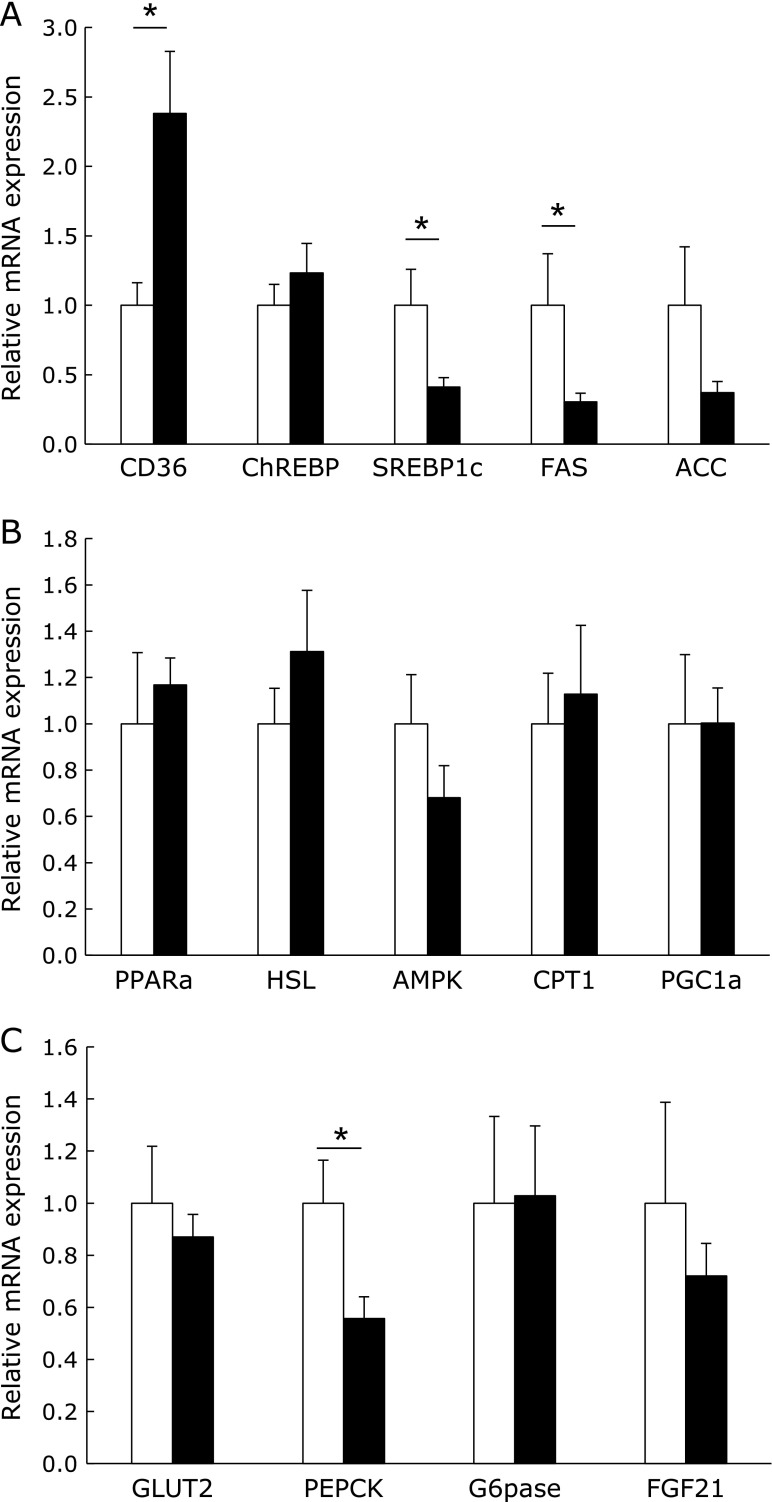
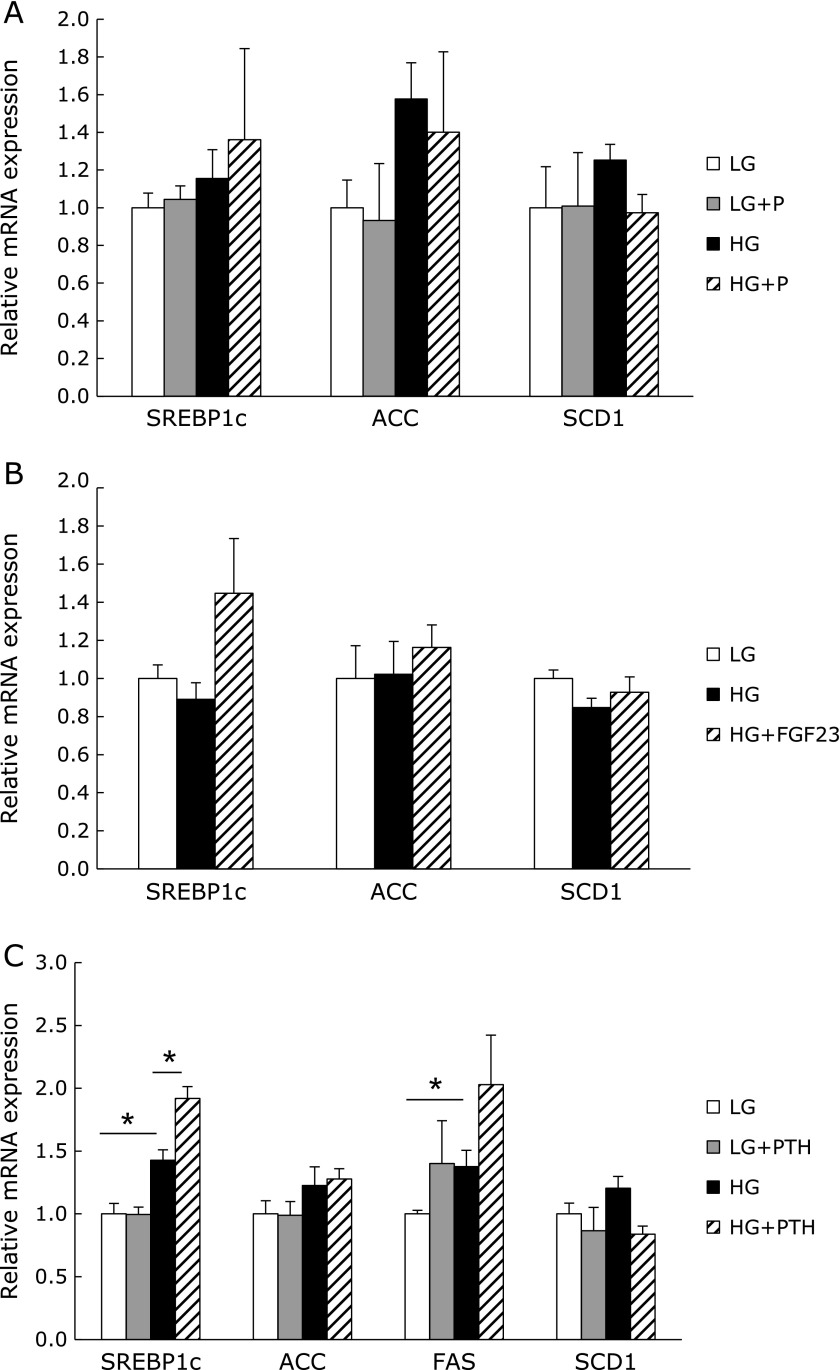
Excessive phosphate intake has been positively associated with renal and vascular dysfunction, conversely negatively associated with body fat accumulation. We investigated the effect of a high-phosphate diet on the expression of lipid metabolic genes in white adipose tissue and liver. Male 8-week-old Sprague-Dawley rats were fed a control diet containing 0.6% phosphate or a high-phosphate diet containing 1.5% phosphate for 4 weeks. In comparison to the control group, the HP group showed a significantly lower body fat mass and fasting plasma insulin level alongside decreased lipogenic and increased lipolytic gene expression in visceral fat. Additionally, the expression of genes involved in hepatic lipogenesis, hepatic glycogenesis, and triglyceride accumulation decreased in the high-phosphate group. Exogenous phosphate, parathyroid hormone, and fibroblast growth factor 23 did not directly affect the expression of lipolytic or lipogenic genes in 3T3-L1 adipocytes and HepG2 hepatocytes. Thus, the high-phosphate diet suppressed the activity of white adipose tissue by increasing lipolytic gene expression and decreasing lipogenic gene expression. These effects could have been caused by the lowered fasting plasma insulin level that occurred in response to the high-phosphate diet, but were not directly caused by the increases in plasma phosphate or phosphaturic hormones.

Keywords: dietary phosphate; insulin; lipogenesis; lipolysis; white adipose tissue.


Conflict of interest statement

No potential conflicts of interest were disclosed.

Figures

Fig. 1
Fig. 1
Body weight and tissue mass of high-phosphate diet-fed rats. Body weight changes during dietary intervention (A) and body weight at 4 weeks after 12 h fasting (B). The epidydimal (Epi), mesenteric (Mes), retroperitoneal (Ret), and inguinal (Ing) fat masses (C). Soleus, gastrocnemius (D), liver, and kidney (E) weights. Hepatic triglyceride levels (F). Open circle or column stands for control diet-fed group, closed circle or column for high-phosphate (HP) diet-fed group. Data are presented as mean ± SE. n = 5–6 rats per group. *p<0.05, **p<0.01.
Fig. 2
Fig. 2
Nutrient absorption after the intake of a high-phosphate diet. Rats aged 8 weeks were fed either the control (open circle) or high-phosphate (HP) (closed circle) diet before the initiation of HP diet feeding. The serial changes of blood glucose (A), triglyceride (B), and phosphate (C) levels. Data are presented as mean ± SE. n = 5–6 rats per group. *p<0.05.
Fig. 3
Fig. 3
The lipogenic and lipolytic gene expression in three types of white adipose tissue. The mRNA expression of lipogenic and lipolytic genes in the epidydimal (Epi), retroperitoneal (Ret), and inguinal (Ing) white adipose tissues of rats after feeding the control (open column) or high-phosphate (HP) (closed column) diet for 4 weeks (A–F). The expression level of each target gene was normalized to that of the 36B4 housekeeping gene. Data are presented as mean ± SE. n = 5–6 rats per group. *p<0.05, **p<0.01.
Fig. 4
Fig. 4
HSL phosphorylation in white adipose tissue. Immunoblotting using the p-HSL (Ser660), HSL, and β-actin antibodies in retroperitoneal (A and B) and epidydimal (C and D) white adipose tissues. The intensities of the luminescent signals were quantified using software (B and D). Data are presented as mean ± SE. n = 5–6 rats per group. *p<0.05, **p<0.001.
Fig. 5
Fig. 5
The effects of phosphate or phosphate regulators on 3T3-L1 cells. The expression of lipogenic and lipolytic genes in mature 3T3-L1 adipocytes cultured in medium supplemented with 2 or 3 mM phosphate (A), 10 nM PTH, or 500 pg/ml FGF23 (B) for 5 days. The control medium contained 0.9 mM phosphate. The expression level of each target gene was normalized to that of the housekeeping gene GAPDH. Data are presented as mean ± SE. n = 3 per group.
Fig. 6
Fig. 6
Hepatic glycogen and triglyceride levels. Representative liver histology by periodic acid–Schiff staining at 20× and 40× magnification (A). The scale bars represent 100 µm (left) and 60 µm (right). The stained area was quantified by software (B). Data are presented as mean ± SE. n = 5–6 rats per group. *p<0.01.
Fig. 7
Fig. 7
The gene expression in the liver. The mRNA expression in the liver of rats fed with the control (open column) or high-phosphate (HP) (closed column) diet for 4 weeks (A–C). The expression of each target gene was normalized to that of the β-actin gene. Data are presented as mean ± SE. n = 5–6 rats per group. *p<0.05.
Fig. 8
Fig. 8
The effects of phosphate and phosphate regulators on HepG2 cells. The mRNA expression of HepG2 cells stimulated with 2 mM phosphate (A), 500 pg/ml FGF23 (B), or 10 nM PTH (C) for 24 h in low- or high-glucose medium. LG, low-glucose medium; HG, high-glucose medium. The expression of each target gene was normalized to that of the β-actin gene. Data are presented as mean ± SE. n = 3–4 per group. *p<0.05.

References

    1. Takeda E, Yamamoto H, Nashiki K, Sato T, Arai H, Taketani Y. Inorganic phosphate homeostasis and the role of dietary phosphorus. J Cell Mol Med. 2004;8:191–200. - PMC - PubMed
    1. Berndt TJ, Schiavi S, Kumar R. “Phosphatonins” and the regulation of phosphorus homeostasis. Am J Physiol Ren Physiol. 2005;289:F1170–F1182. - PubMed
    1. Shaikh A, Berndt T, Kumar R. Regulation of phosphate homeostasis by the phosphatonins and other novel mediators. Pediatr Nephrol. 2008;23:1203–1210. - PMC - PubMed
    1. Block GA, Klassen PS, Lazarus JM, Ofsthun N, Lowrie EG, Chertow GM. Mineral metabolism, mortality, and morbidity in maintenance hemodialysis. J Am Soc Nephrol. 2004;15:2208–2218. - PubMed
    1. Fujii H, Joki N. Mineral metabolism and cardiovascular disease in CKD. Clin Exp Nephrol. 2017;21 (Suppl 1):53–63. - PubMed