. 2018 Nov 14:12:421.
doi: 10.3389/fncel.2018.00421. eCollection 2018.

Distinct Microglial Responses in Two Transgenic Murine Models of TAU Pathology

Affiliations

Distinct Microglial Responses in Two Transgenic Murine Models of TAU Pathology

Carmen Romero-Molina et al. Front Cell Neurosci. .

Abstract

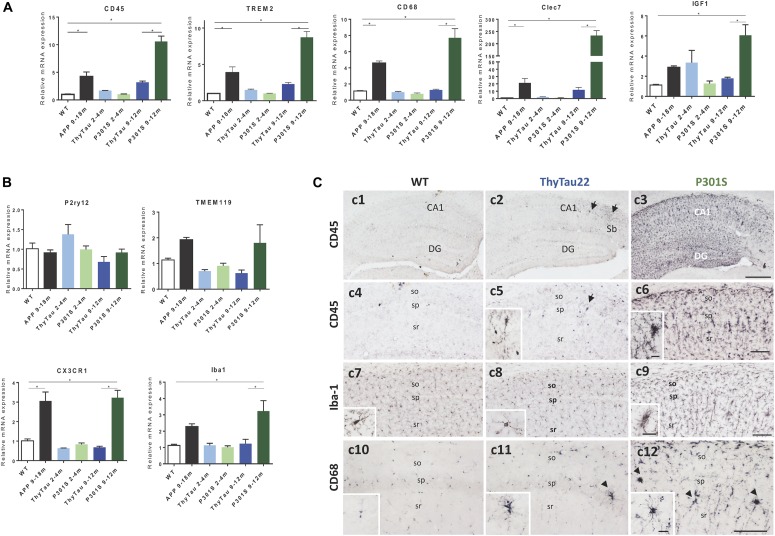
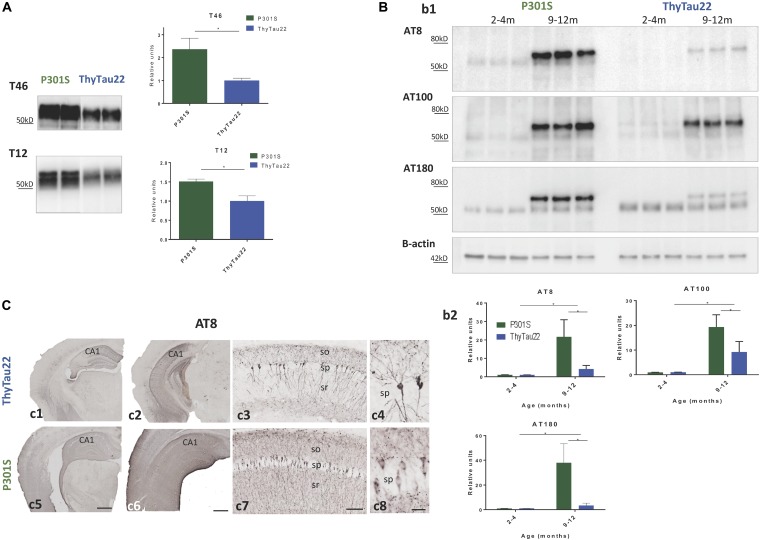
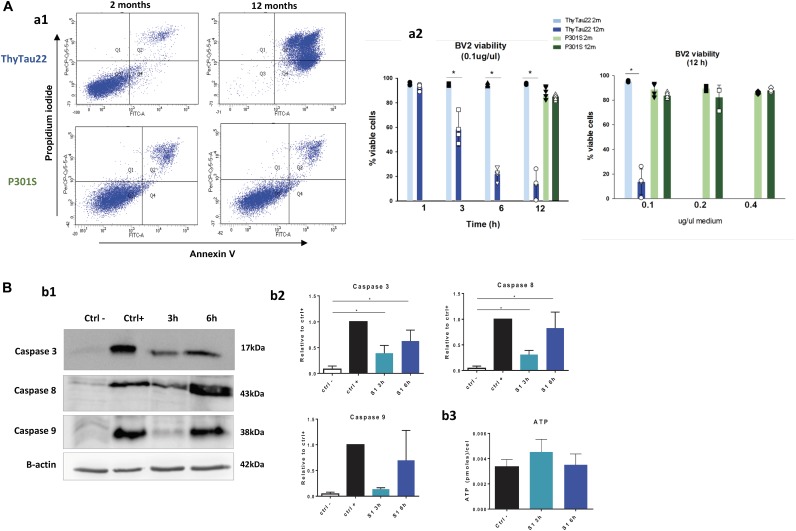
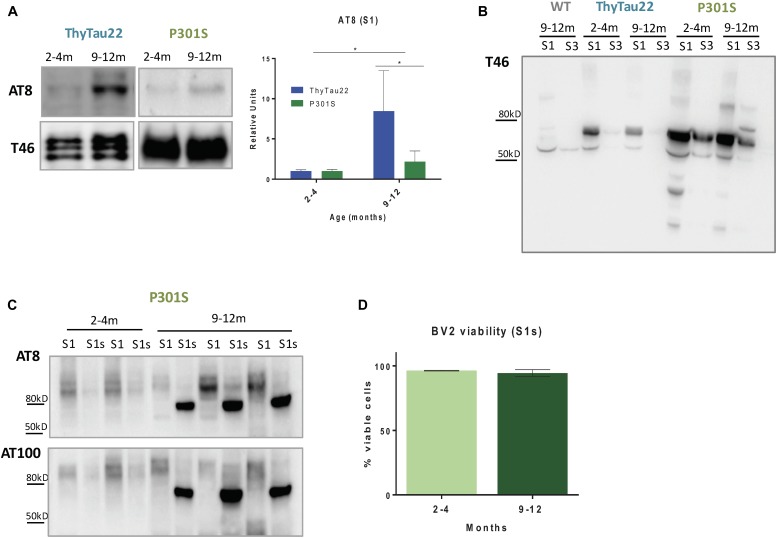
Microglial cells are crucial players in the pathological process of neurodegenerative diseases, such as Alzheimer's disease (AD). Microglial response in AD has been principally studied in relation to amyloid-beta pathology but, comparatively, little is known about inflammatory processes associated to tau pathology. In the hippocampus of AD patients, where tau pathology is more prominent than amyloid-beta pathology, a microglial degenerative process has been reported. In this work, we have directly compared the microglial response in two different transgenic tau mouse models: ThyTau22 and P301S. Surprisingly, these two models showed important differences in the microglial profile and tau pathology. Where ThyTau22 hippocampus manifested mild microglial activation, P301S mice exhibited a strong microglial response in parallel with high phospho-tau accumulation. This differential phospho-tau expression could account for the different microglial response in these two tau strains. However, soluble (S1) fractions from ThyTau22 hippocampus presented relatively high content of soluble phospho-tau (AT8-positive) and were highly toxic for microglial cells in vitro, whereas the correspondent S1 fractions from P301S mice displayed low soluble phospho-tau levels and were not toxic for microglial cells. Therefore, not only the expression levels but the aggregation of phospho-tau should differ between both models. In fact, most of tau forms in the P301S mice were aggregated and, in consequence, forming insoluble tau species. We conclude that different factors as tau mutations, accumulation, phosphorylation, and/or aggregation could account for the distinct microglial responses observed in these two tau models. For this reason, deciphering the molecular nature of toxic tau species for microglial cells might be a promising therapeutic approach in order to restore the deficient immunological protection observed in AD hippocampus.

Keywords: Alzheimer disease; inflammation; microglia; tau models; tauopathies.


Figures

FIGURE 1
FIGURE 1
(A,B) Microglial DAM (A) and homeostatic (B) gene expression (qPCR) in ThyTau22 (n = 4–8/age) and P301S (n = 5–9/age) mice. Expression levels, normalized using GAPDH, were referred to WT mice [9 months-old WT (n = 4)]. APP mice (9–18 months, n = 4–7) were also included as positive control. p < 0.05. Significance was analyzed by ANOVA followed by Tukey multiple comparison test. (C) Representative CD45 (c1–c6), Iba-1 (c7–c9) and CD68 (c10–c12) -immunostained hippocampal sections from 9 month-old WT (c1, c4, c7, c10), ThyTau22 (c2, c5, c8, c11) and P301S (c3, c6, c9, c12) mice. DG, debate gyrus; so, stratum oriens; sp, stratum pyramidale; sr, stratum radiatum. Scale bars, (c1–c3) 400 μm; (c4–c12) 100 μm; insets 20 μm.
FIGURE 2
FIGURE 2
(A) Total tau (T46 upper panel and T12 lower panel) protein levels in 9 month-old P301S and ThyTau22 mice (n = 4–6). (B) Phospho-tau (AT8, AT100, AT180 antibodies) protein levels in P301S and ThyTau22 mice (n = 6). (b1) Representative western-blots. (b2) WB quantification, p < 0.05, significance was analyzed by t-test between young and aged mice in each model and between aged P301S and ThyTau22 mice. (C) Representative AT8-immunostained hippocampal sections from 9 month-old ThyTau22 (c1–c4) and P301S (c5–c8) mice. so, stratum oriens; sp, stratum pyramidale; sr, stratum radiatum. Scale bars, (c1, c2, c5, c6) 500 μm, (c3, c7) 100 μm, (c4, c8) 20 μm.
FIGURE 3
FIGURE 3
(A) Soluble fractions (S1) from aged ThyTau22 mice were toxic for BV2 microglial cells whereas S1 from aged P301S mice had no effect in the viability of microglial cells. (a1) Representative Annexin V/propidium iodide (PI) double staining of BV2 cells treated with S1 fractions at 0.1 ug/ul for 12 h. (a2) Quantitative analysis of cell viability after exposure to S1 fractions. Data is shown as the mean + SD (n = 3–5). p < 0.05. Significance was determined by ANOVA and Tukey post-hoc test. (B) Caspase activation following microglial treatment with soluble phospho-tau from 12 month-old ThyTau22 mice. (b1) Representative western blots showing caspase 3, 8, and 9 activation in BV2 cells treated with S1 from aged ThyTau22 mice (0.1 ug/ul). B-actin (low panel) was used as the loading control.(b2) The relative abundance of cleaved caspases was determined by densitometry analysis. Data were normalized by positive control (staurosporine 1 μM), and significance was determined by ANOVA and Tukey post-hoc test (n = 3).(b3) No differences in ATP levels were observed in BV2 cells treated with S1 fractions from 12 month-old ThyTau22 mice (0.1 ug/ul). Data is shown as the mean + SD (n = 3).
FIGURE 4
FIGURE 4
(A) Higher phospho-tau accumulation (AT8) in S1 fractions from 9 to 12 month-old ThyTau22 mice compared to paired P301S mice. The relative abundance of phospho-tau was determined by densitometry analysis. Tau46 (low panel) was used as the loading control. Data is shown as the mean + SD (n = 3–6). p < 0.05. Significance was analyzed by t-test between young and aged mice in each model and between aged P301S and ThyTau22 mice. (B) Representative western-blot of total tau accumulation (T46) in S1 and S3 fractions from WT, ThyTau22 and P301S mice. (C) Representative western-blot of phospho-tau (AT8 and AT100) in S1 and S1s fractions from P301S mice. (D) Quantitative analysis of BV2 viability (determined by flow cytometry) after 12 h of S1s treatment at 0.1 ug/ul. Data is shown as the mean + SD (n = 3).

Similar articles

Cited by

References

    1. Asai H., Ikezu S., Tsunoda S., Medalla M., Luebke J., Haydar T., et al. (2015). Depletion of microglia and inhibition of exosome synthesis halt tau propagation. Nat. Neurosci. 18 1584–1593. 10.1038/nn.4132 - DOI - PMC - PubMed
    1. Askew K., Li K., Olmos-Alonso A., Garcia-Moreno F., Liang Y., Richardson P., et al. (2017). Coupled proliferation and apoptosis maintain the rapid turnover of microglia in the adult brain. Cell Rep. 18 391–405. 10.1016/j.celrep.2016.12.041 - DOI - PMC - PubMed
    1. Baglietto-Vargas D., Sánchez-Mejias E., Navarro V., Jimenez S., Trujillo-Estrada L., Gómez-Arboledas A., et al. (2017). Dual roles of Aβ in proliferative processes in an amyloidogenic model of Alzheimer’s Disease. Sci. Rep. 7:10085. 10.1038/s41598-017-10353-7 - DOI - PMC - PubMed
    1. Bellucci A., Bugiani O., Ghetti B., Spillantini M. G. (2011). Presence of reactive microglia and neuroinflammatory mediators in a case of frontotemporal dementia with P301S mutation. Neurodegener. Dis. 8 221–229. 10.1159/000322228 - DOI - PMC - PubMed
    1. Bellucci A., Westwood A. J., Ingram E., Casamenti F., Goedert M., Spillantini M. G. (2004). Induction of inflammatory mediators and microglial activation in mice transgenic for mutant human P301S Tau protein. Am. J. Pathol. 165 1643–1652. 10.1016/S0002-9440(10)63421-9 - DOI - PMC - PubMed