

Quantitative Proteomics Reveals Common and Specific Responses of a Marine Diatom Thalassiosira pseudonana to Different Macronutrient Deficiencies
- PMID: 30487787
- PMCID: PMC6246746
- DOI: 10.3389/fmicb.2018.02761
Quantitative Proteomics Reveals Common and Specific Responses of a Marine Diatom Thalassiosira pseudonana to Different Macronutrient Deficiencies
Abstract
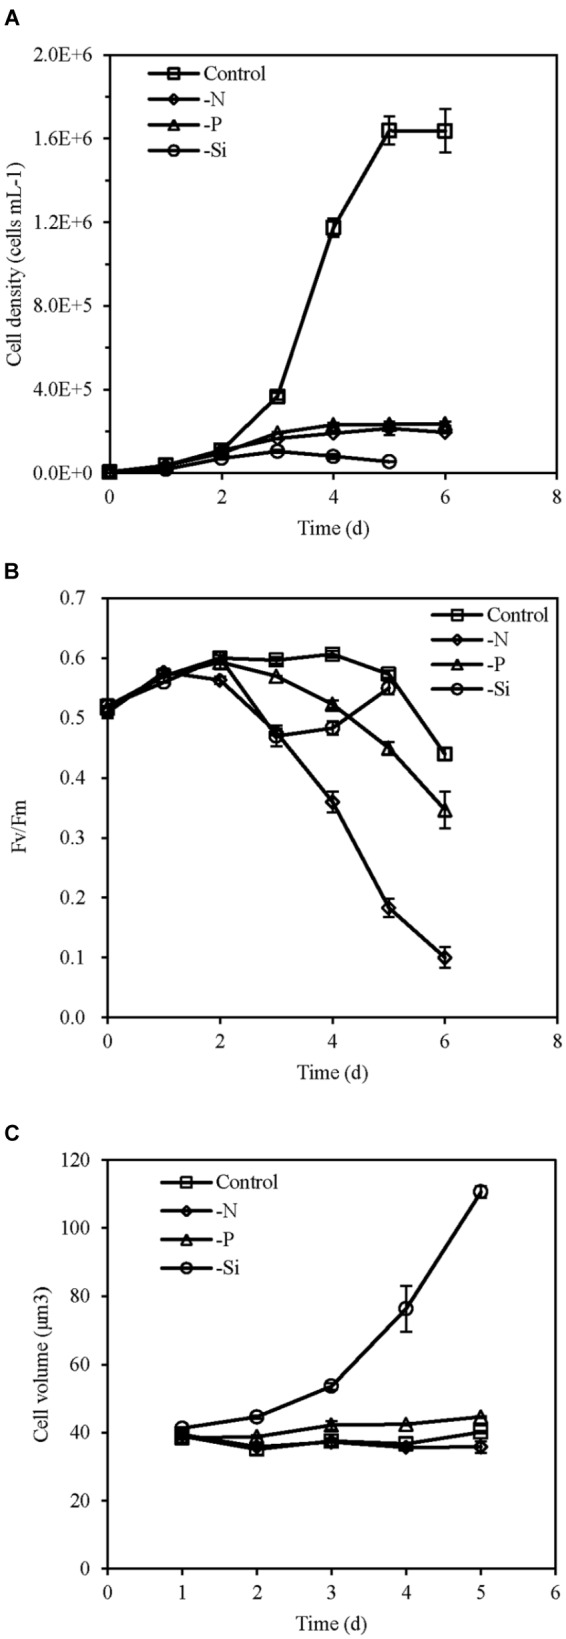
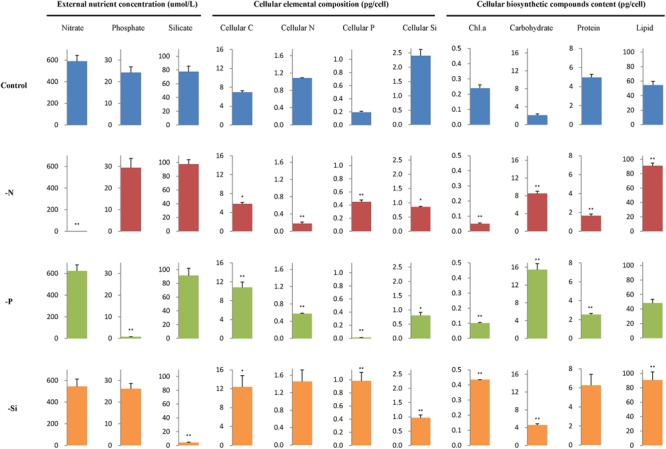
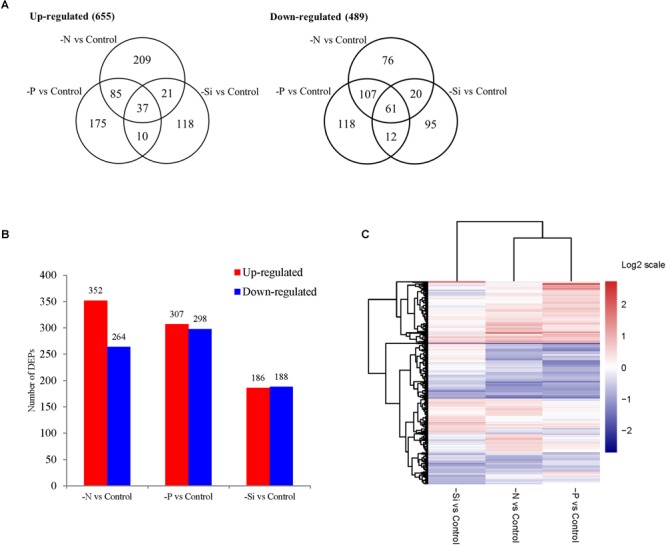
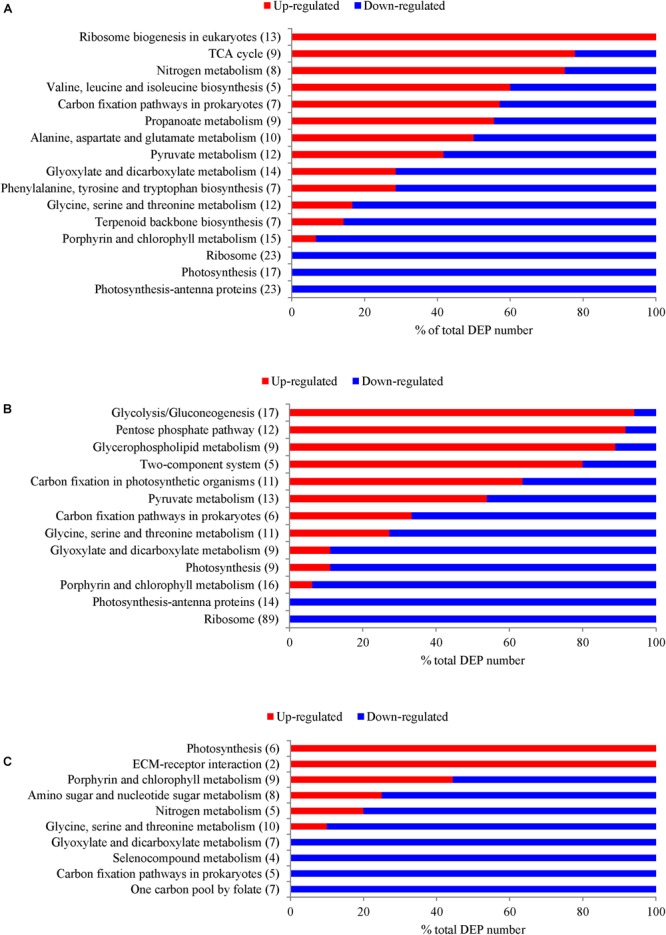
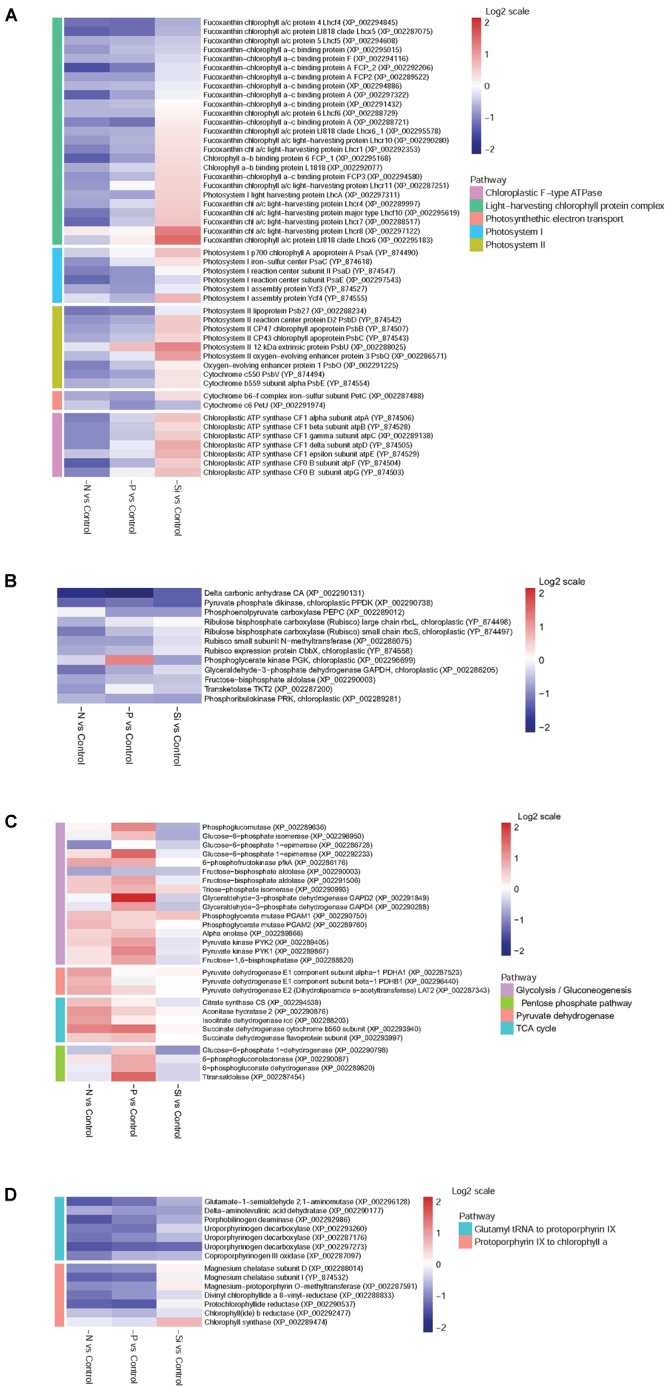
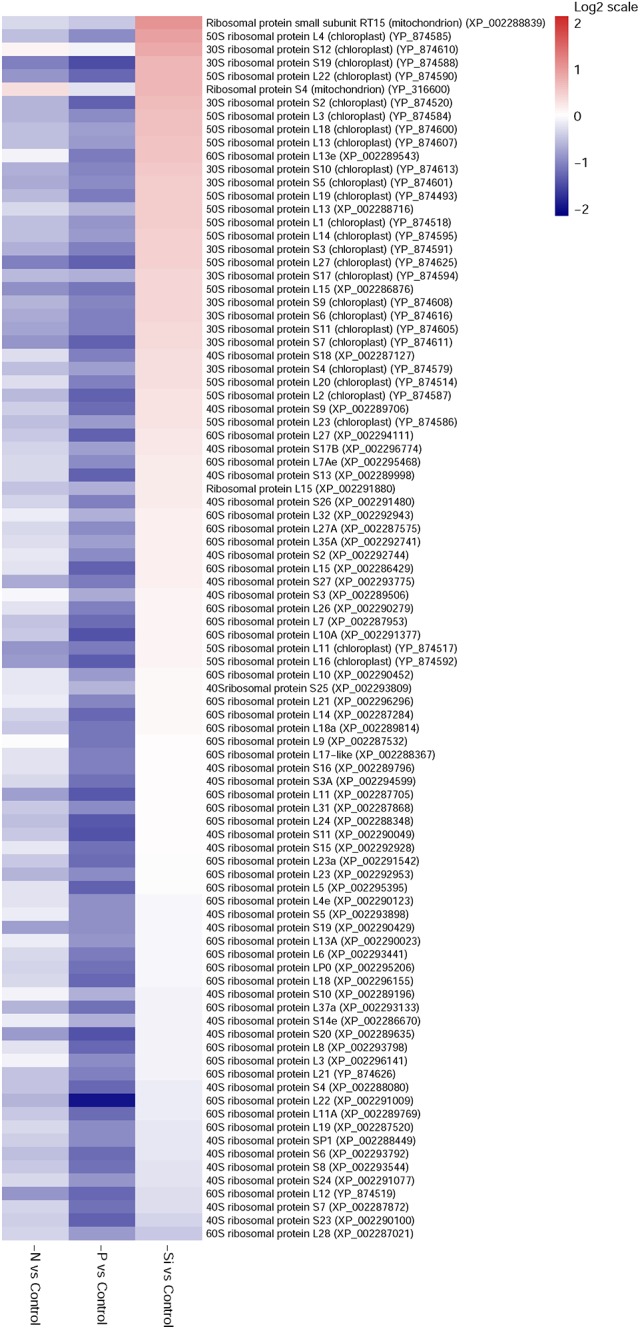
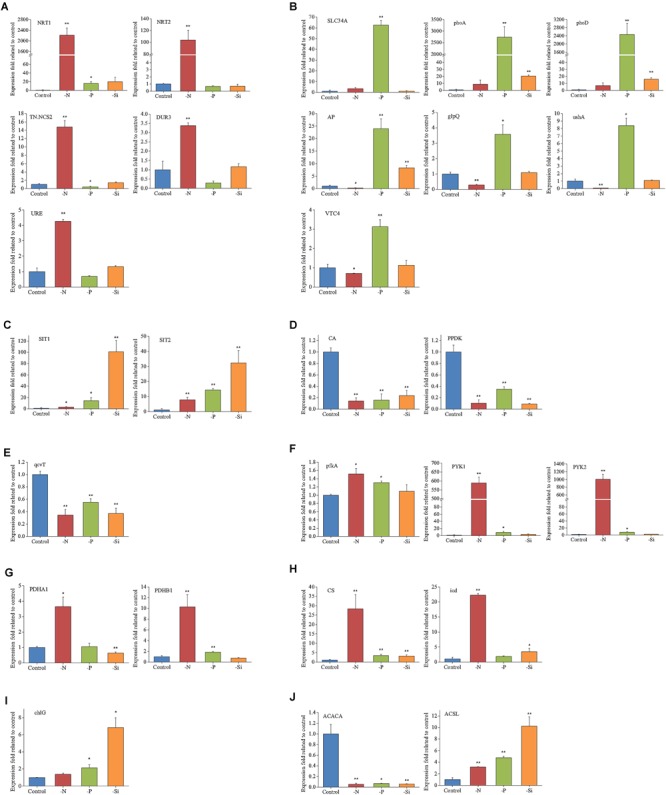
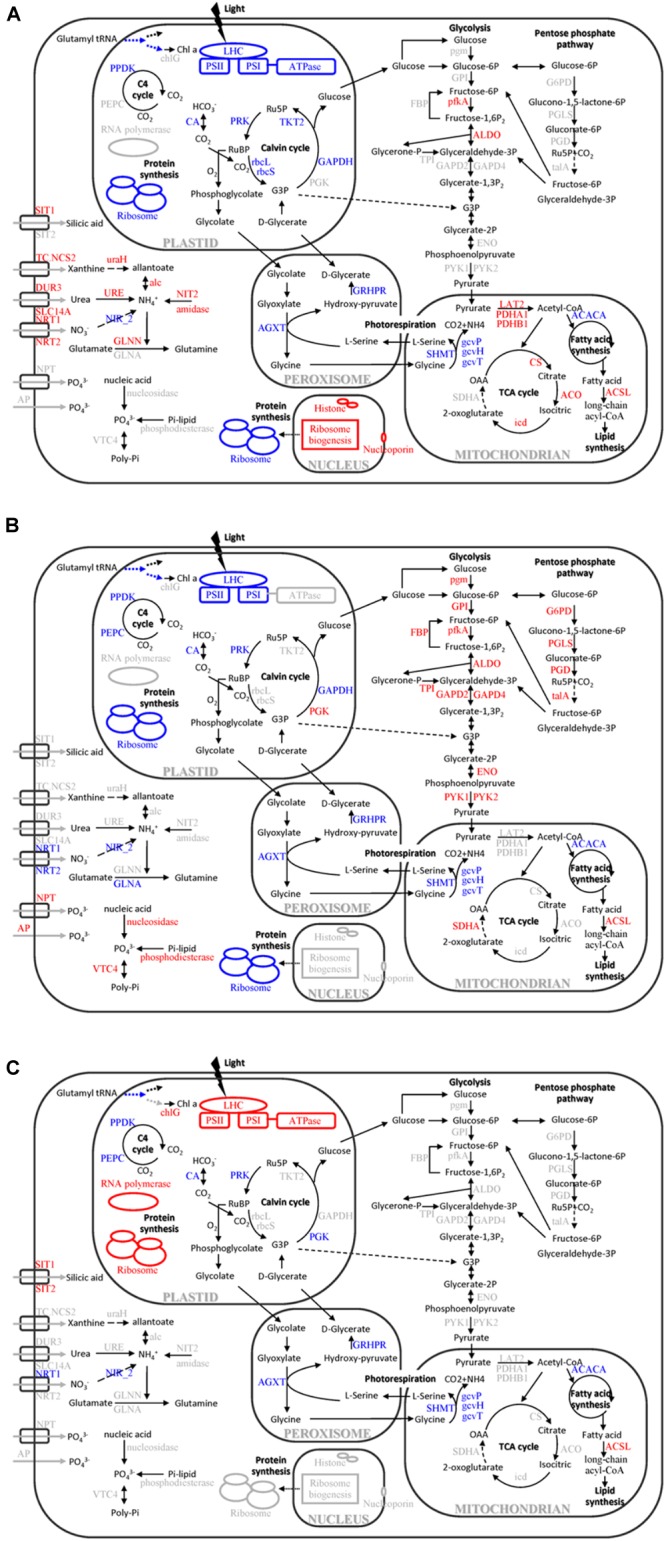
Macronutrients such as nitrogen (N), phosphorus (P), and silicon (Si) are essential for the productivity and distribution of diatoms in the ocean. Responses of diatoms to a particular macronutrient deficiency have been investigated, however, we know little about their common or specific responses to different macronutrients. Here, we investigated the physiology and quantitative proteomics of a diatom Thalassiosira pseudonana grown in nutrient-replete, N-, P-, and Si-deficient conditions. Cell growth was ceased in all macronutrient deficient conditions while cell volume and cellular C content under P- and Si-deficiencies increased. Contents of chlorophyll a, protein and cellular N decreased in both N- and P-deficient cells but chlorophyll a and cellular N increased in the Si-deficient cells. Cellular P content increased under N- and Si-deficiencies. Proteins involved in carbon fixation and photorespiration were down-regulated under all macronutrient deficiencies while neutral lipid synthesis and carbohydrate accumulation were enhanced. Photosynthesis, chlorophyll biosynthesis, and protein biosynthesis were down-regulated in both N- and P-deficient cells, while Si transporters, light-harvesting complex proteins, chloroplastic ATP synthase, plastid transcription and protein synthesis were up-regulated in the Si-deficient cells. Our results provided insights into the common and specific responses of T. pseudonana to different macronutrient deficiencies and identified specific proteins potentially indicating a particular macronutrient deficiency.
Keywords: Thalassiosira pseudonana; macronutrient; marine diatom; nitrogen; phosphorus; quantitative proteomics; silicon.
Figures
Similar articles
-
High light stress triggers distinct proteomic responses in the marine diatom Thalassiosira pseudonana.BMC Genomics. 2016 Dec 5;17(1):994. doi: 10.1186/s12864-016-3335-5. BMC Genomics. 2016. PMID: 27919227 Free PMC article.
-
The transcriptome and proteome of the diatom Thalassiosira pseudonana reveal a diverse phosphorus stress response.PLoS One. 2012;7(3):e33768. doi: 10.1371/journal.pone.0033768. Epub 2012 Mar 29. PLoS One. 2012. PMID: 22479440 Free PMC article.
-
Improving the biodiesel production in the marine diatom Thalassiosira pseudonana cultivated in nutrient deficiency and sewage water.Environ Sci Pollut Res Int. 2024 Nov;31(55):63764-63776. doi: 10.1007/s11356-024-35409-w. Epub 2024 Nov 6. Environ Sci Pollut Res Int. 2024. PMID: 39503935
-
Lipidomics of Thalassiosira pseudonana under Phosphorus Stress Reveal Underlying Phospholipid Substitution Dynamics and Novel Diglycosylceramide Substitutes.Appl Environ Microbiol. 2018 Mar 1;84(6):e02034-17. doi: 10.1128/AEM.02034-17. Print 2018 Mar 15. Appl Environ Microbiol. 2018. PMID: 29305510 Free PMC article.
-
Diatom elemental and morphological changes in response to iron limitation: a brief review with potential paleoceanographic applications.Geobiology. 2009 Sep;7(4):419-31. doi: 10.1111/j.1472-4669.2009.00207.x. Epub 2009 Jul 29. Geobiology. 2009. PMID: 19659798 Review.
Cited by
-
Transcriptomic response of the picoalga Pelagomonas calceolata to nitrogen availability: new insights into cyanate lyase function.Microbiol Spectr. 2025 Mar 25;13(5):e0265424. doi: 10.1128/spectrum.02654-24. Online ahead of print. Microbiol Spectr. 2025. PMID: 40130850 Free PMC article.
-
Quantitative Proteomic Analysis Reveals Novel Insights into Intracellular Silicate Stress-Responsive Mechanisms in the Diatom Skeletonema dohrnii.Int J Mol Sci. 2019 May 23;20(10):2540. doi: 10.3390/ijms20102540. Int J Mol Sci. 2019. PMID: 31126124 Free PMC article.
-
A new type of flexible CP12 protein in the marine diatom Thalassiosira pseudonana.Cell Commun Signal. 2021 Mar 24;19(1):38. doi: 10.1186/s12964-021-00718-x. Cell Commun Signal. 2021. PMID: 33761918 Free PMC article.
-
Quantitative proteomic analysis of the microbial degradation of 3-aminobenzoic acid by Comamonas sp. QT12.Sci Rep. 2022 Oct 20;12(1):17609. doi: 10.1038/s41598-022-17570-9. Sci Rep. 2022. PMID: 36266292 Free PMC article.
-
Improving the genome and proteome annotations of the marine model diatom Thalassiosira pseudonana using a proteogenomics strategy.Mar Life Sci Technol. 2023 Feb 3;5(1):102-115. doi: 10.1007/s42995-022-00161-y. eCollection 2023 Feb. Mar Life Sci Technol. 2023. PMID: 37073328 Free PMC article.
References
LinkOut - more resources
Full Text Sources