. 2018 Oct 15:9:2329.
doi: 10.3389/fimmu.2018.02329. eCollection 2018.

Unraveling the Molecular Mechanisms Underlying Complement Dysregulation by Nephritic Factors in C3G and IC-MPGN

Affiliations

Unraveling the Molecular Mechanisms Underlying Complement Dysregulation by Nephritic Factors in C3G and IC-MPGN

Roberta Donadelli et al. Front Immunol. .

Abstract

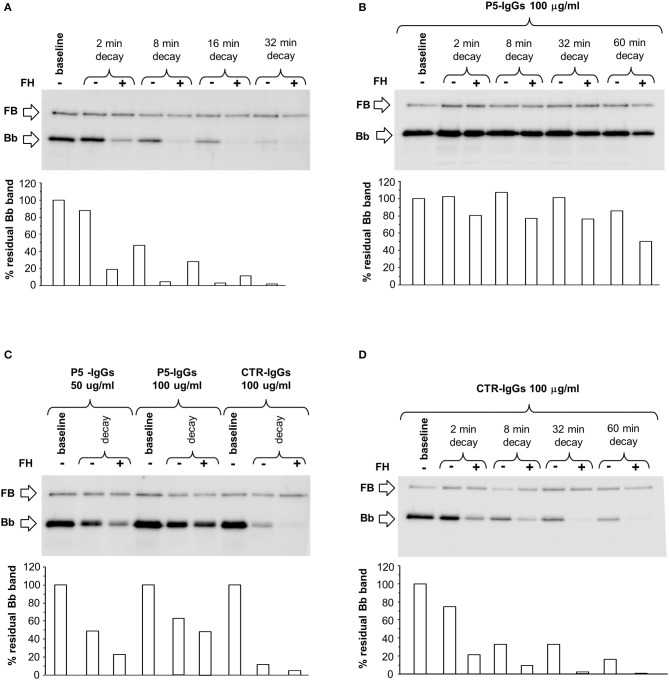
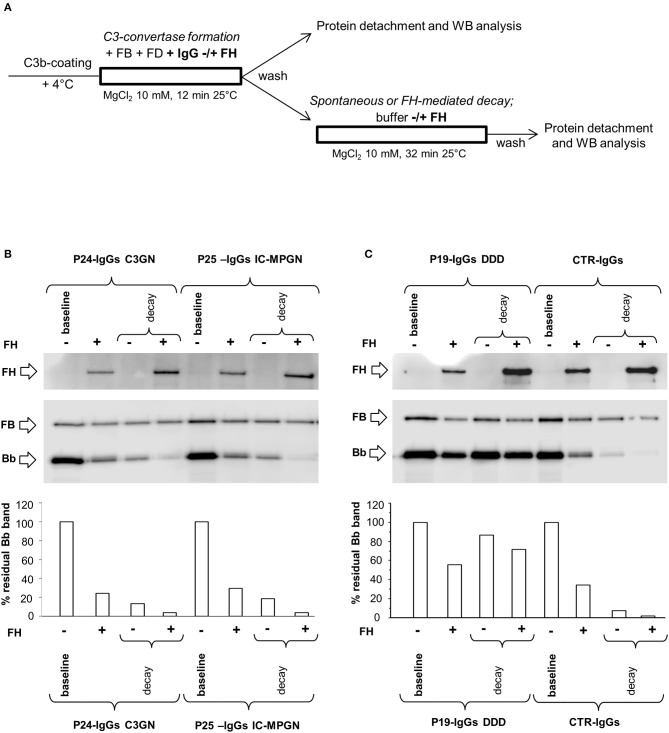
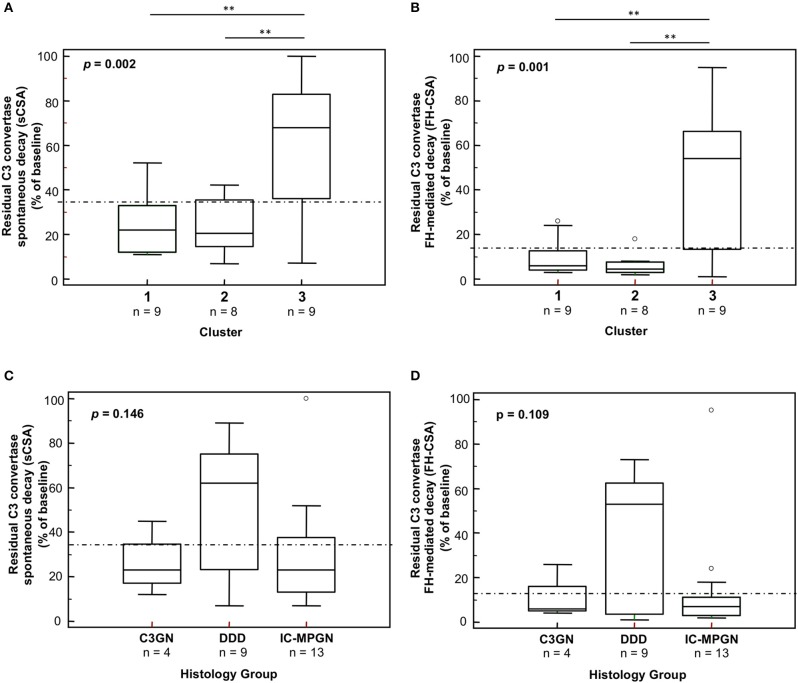
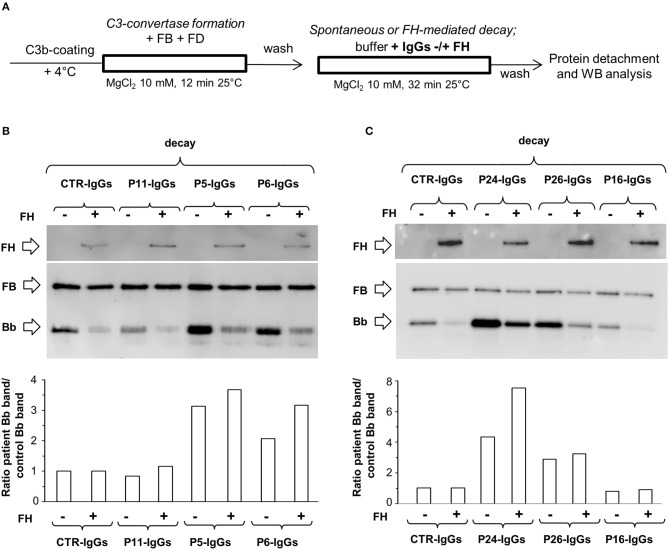
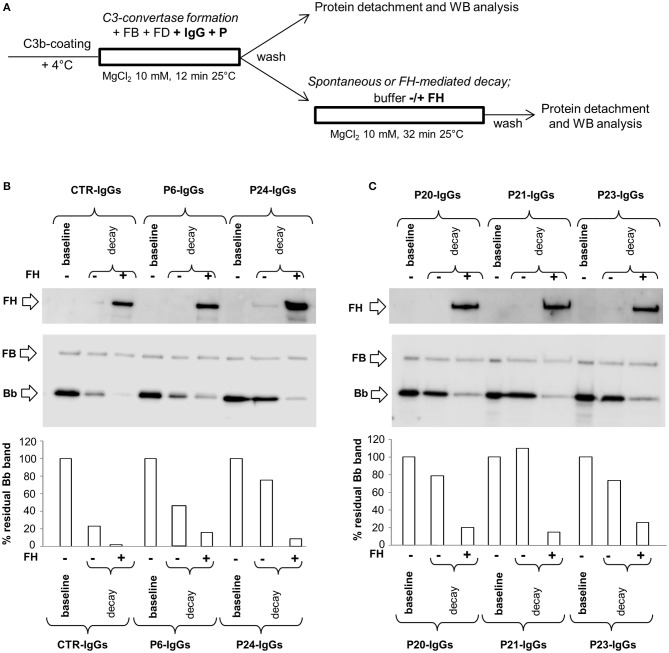
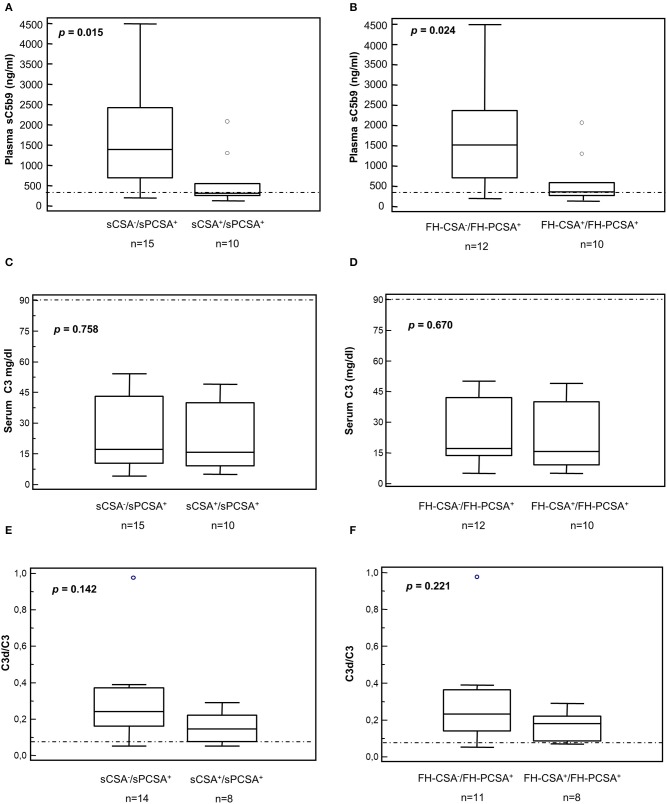
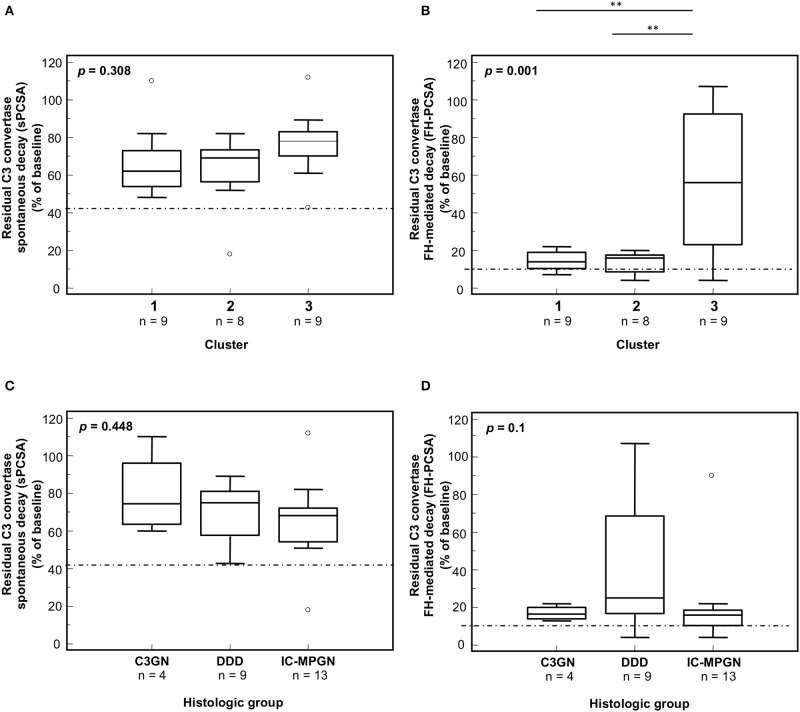
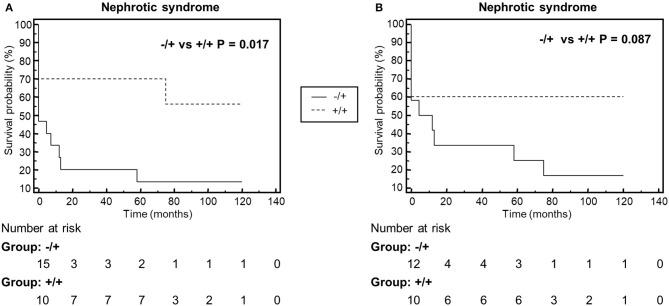
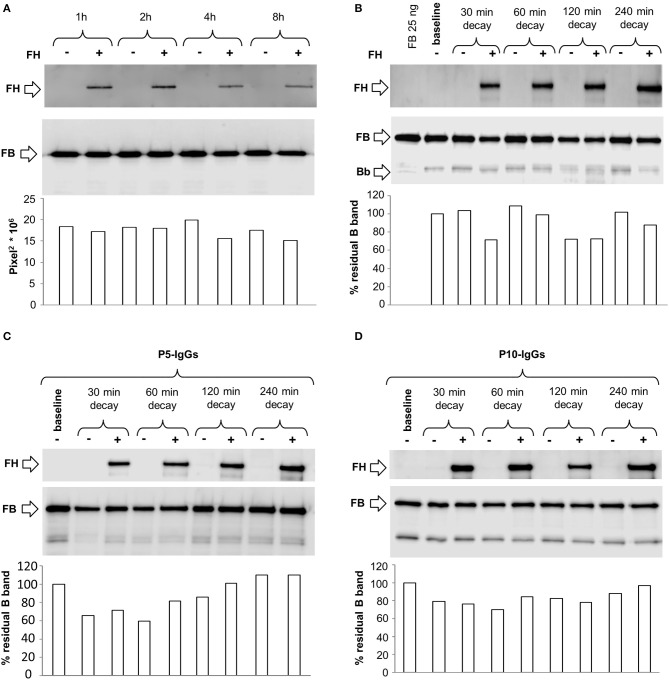
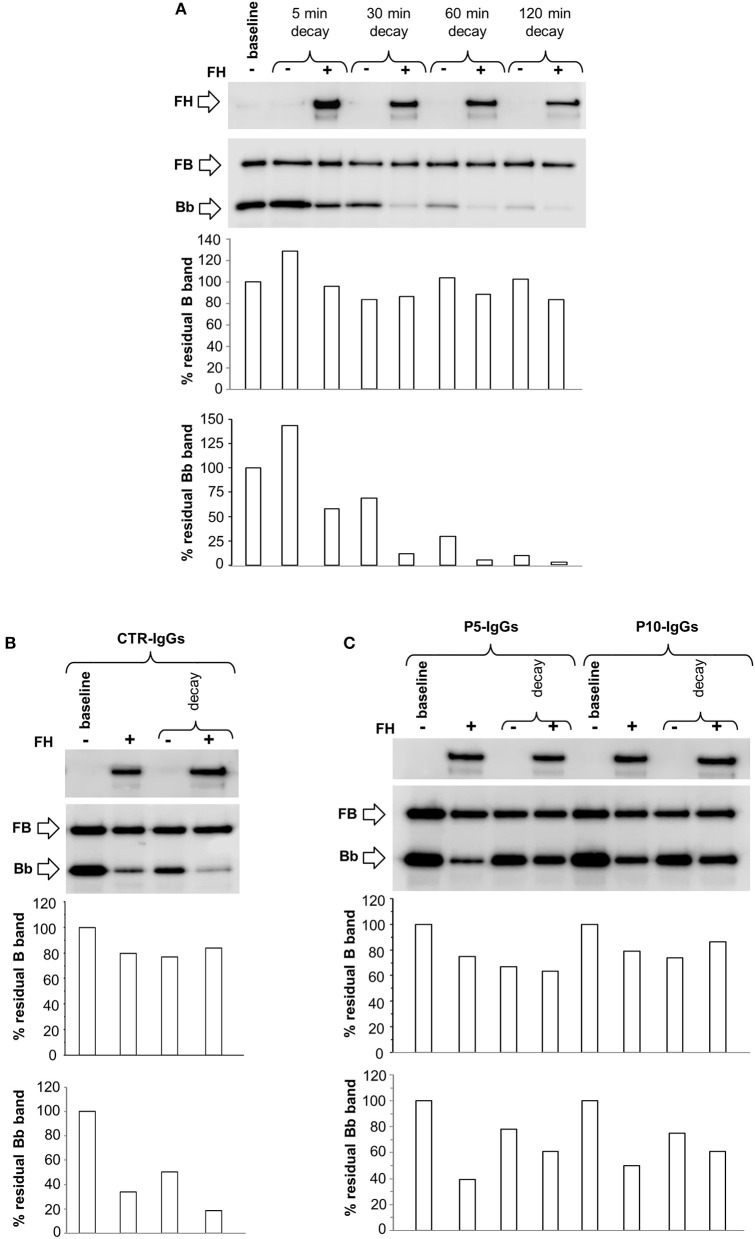
Membranoproliferative glomerulonephritis (MPGN) was recently classified as C3 glomerulopathies (C3G), and immune-complex (IC) mediated MPGN. Dysregulation of the complement alternative pathway, driven by acquired and/or genetic defects, plays a pathogenetic role in C3G. However, alternative pathway abnormalities were also found in IC-MPGN. The most common acquired drivers are the C3 nephritic factors (C3NeFs), heterogeneous autoantibodies that stabilize the C3 convertase, C3bBb. C3NeFs are traditionally detected by hemolytic assays based on sheep erythrocyte lysis, which however do not provide a direct molecular estimation of C3bBb formation and decay. We set up a microplate/western blot assay that specifically detects and quantifies C3bBb, and its precursor, the C3 proconvertase C3bB, to investigate the complex mechanistic effects of C3NeFs from patients with primary IC-MPGN (n = 13) and C3G (n = 13). In the absence of properdin, 9/26 patients had C3NeF IgGs stabilizing C3bBb against spontaneous and FH-accelerated decay. In the presence of properdin the IgGs of all but one patient had C3bBb-stabilizing activity. Properdin-independent C3NeFs were identified mostly in DDD patients, while properdin-dependent C3NeFs associated with either C3GN or IC-MPGN and with higher incidence of nephrotic syndrome. When we grouped patients based on our recent cluster analysis, patients in cluster 3, with highly electron-dense intramembranous deposits, low C3, and mostly normal sC5b-9 levels, had a higher prevalence of properdin-independent C3NeFs than patients in clusters 1 and 2. Conversely, about 70% of cluster 1 and 2 patients, with subendothelial, subepithelial, and mesangial deposits, low C3 levels and high sC5b-9 levels, had properdin-dependent C3NeFs. The flexibility of the assay allowed us to get deep insights into C3NeF mechanisms of action, showing that: (1) most C3NeFs bind strongly and irreversibly to C3 convertase; (2) C3NeFs and FH recognize different epitopes in C3 convertase; (3) C3NeFs bind rapidly to C3 convertase and antagonize the decay accelerating activity of FH on newly formed complexes; (4) C3NeFs do not affect formation and stability of the C3 proconvertase. Thus, our study provides a molecular approach to detecting and characterizing C3NeFs. The results highlight different mechanisms of complement dysregulation resulting in different complement profiles and patterns of glomerular injury, and this may have therapeutic implications.

Keywords: C3 convertase; C3 glomerulopathy; C3 nephritic factors; complement alternative pathway; factor H; membranoproliferative glomerulonephritis; terminal complement complex.


Figures

Figure 1
Figure 1
Spontaneous and FH-mediated decay of the C3bBb(Mg2+) C3 convertase in the absence or in the presence of IgGs from a DDD patient or a healthy control, by microplate/Western blot (WB) assay. (A) Time course of spontaneous and FH-mediated decay of C3bBb(Mg2+). The complexes were formed by incubating for 12 min at 25°C C3b-coated wells with 1,000 ng/ml FB, 10 ng/ml FD, and 10 mM MgCl2 (baseline). In additional wells after washing, the formed complexes were further incubated for 2, 8, 16, and 32 min in the absence (-) or in the presence (+) of 2,640 ng/ml FH. (B) C3bBb(Mg2+) was formed in the presence of IgGs from P5 patient with DDD during 12 min at 25°C (baseline). The complexes were allowed to decay for 2, 8, 32, and 60 min in the absence (–) or in the presence of 2,640 ng/ml FH (+). (C) C3bBb(Mg2+) was formed in the presence of IgGs (P5-IgGs, 50, and 100 μg/ml) from patient 5 or from an healthy subject (CTR-IgGs, 100 μg/ml) for 12 min at 25°C. Spontaneous or FH-mediated decay was monitored by further incubation for 32 min at 25°C with buffer alone (–) or added with 2,640 ng/ml FH (+), respectively. (D) C3bBb(Mg2+) was formed in the presence of IgGs from a healthy subject (CTR-IgGs) for 12 min at 25°C. The complexes were allowed to decay for 2, 8, 32, and 60 min in the absence (–) or in the presence of 2,640 ng/ml FH (+). The percentage of residual Bb band (visualized by an anti-FB antibody) was calculated as the ratio of the densities (in Pixel2) of each Bb band after decay and the density of the corresponding baseline Bb band before decay x 100 and results are reported in the bottom graphs. Results of a representative microplate/WB experiment of n = 3 for each sample are shown.
Figure 2
Figure 2
Effect of patient and control IgGs on decay of the C3bBb(Mg2+) C3 convertase by microplate/Western blot (WB) assay. (A) Experimental design (protocol 1) (B-C) Representative images of the assay. C3bBb(Mg2+) complexes were formed by incubating at 25°C for 12 min C3b-coated wells with 1,000 ng/ml FB, 10 ng/ml FD, 100 μg/ml IgGs purified from patients or healthy controls and 10 mM MgCl2 in the absence (–, baseline) or in the presence of 2,640 ng/ml FH. Spontaneous or FH-mediated decay of the complexes was monitored by further incubation of C3bBb(Mg2+) formed in the absence of FH for 32 min at 25°C with buffer alone (decay –) or 2,640 ng/ml FH (decay +), respectively. The percentage of residual Bb band (visualized by an anti-FB antibody) was calculated as the ratio of the densities (in Pixel2) of each Bb band after decay and the corresponding baseline Bb band density before decay x 100 and results are reported in the bottom graphs. The membranes were then incubated with an anti-FH antibody and FH band could be visualized at 150 KDa (top). Results of a representative microplate/WB experiment of n = 3 for each sample are shown.
Figure 3
Figure 3
Distribution of the C3NeF IgG C3 convertase-stabilizing activities in the absence of properdin according to the clusters and the histology groups. Box plots show significantly higher C3 convertase stabilizing activities against spontaneous (sCSA) and FH-mediated (FH-CSA) decay (protocol 1) in patients of cluster 3 than cluster 1 and 2 patients (A,B). No significance difference was observed among histology groups (C,D). The boxes represent the values from the 25th to 75th percentiles. The horizontal bars are the medians. Vertical lines are the 95% confidence intervals. Empty circles are values outside the 95% confidence intervals. The dashed horizontal lines show the limit of positive values (set at >mean+2SD of results with control IgGs from 26 healthy subjects). **P < 0.01.
Figure 4
Figure 4
Effect of patient and control IgGs on preformed C3bBb(Mg2+) C3 convertase by microplate/Western blot (WB) assay. (A) Experimental design (protocol 2). (B,C) Representative images of the assay. C3bBb(Mg2+) complexes were formed by incubating at 25°C for 12 min C3b-coated wells with 1,000 ng/ml FB, 10 ng/ml FD, and 10 mM MgCl2. The complexes formed were then incubated in the presence of 100 μg/ml IgGs from patients or healthy controls without (spontaneous decay, decay –) or with (FH-mediated decay, decay +) 2,640 ng/ml FH. The C3NeF IgG C3 convertase-stabilizing activity was quantified as the ratio of the densities (in Pixel2) of Bb bands (visualized by an anti-FB antibody) after decay in the presence of patient IgGs/ Bb band after decay in the presence of control IgGs (ratio patient Bb band/control Bb band) and results are reported in the bottom graphs. The membranes were then incubated with an anti-FH antibody and FH band could be visualized at 150 KDa (top). Results of a representative microplate/WB experiment of n = 3 for each sample are shown.
Figure 5
Figure 5
Effect of properdin on C3 convertase-stabilizing activity of C3NeF IgGs. (A) Experimental design (protocol 3). (B,C) Representative images of the assay. C3bBb(Mg2+) complexes were formed by incubating at 25°C for 12 min C3b-coated wells with 1,000 ng/ml FB, 10 ng/ml FD, 100 μg/ml IgGs from patients or healthy controls and 10 mM MgCl2 in the presence of 500 ng/ml Properdin (P) (baseline). In additional wells after washing, spontaneous or FH-mediated decay of the formed complexes was monitored by further incubation for 32 min at 25°C with buffer alone (decay –) or buffer added with 2,640 ng/ml FH (decay +), respectively. The percentage of residual Bb band was calculated as the ratio of the densities (in Pixel2) of each Bb band (visualized by an anti-FB antibody) after decay and the corresponding baseline Bb band density before decay x 100, and results are reported in the bottom graphs. The membranes were then incubated with an anti-FH antibody and FH band could be visualized at 150 KDa (top). Results of a representative microplate/WB experiment of n = 3 for each sample are shown.
Figure 6
Figure 6
Distribution of serum C3 and plasma sC5b-9 levels and plasma C3d/C3 ratios in patients according to results of C3 convertase stabilizing-activities in the absence or in the presence of properdin. (A,B) Plasma sC5b-9 levels. Box plots show that patients carrying C3NeFs with properdin-dependent C3 convertase-stabilizing activity against spontaneous (A, sCSA/sPCSA+) and/or FH-mediated (B, FH-CSA/FH-PCSA+) decay had higher plasma sC5b-9 levels than patients carrying C3NeF with properdin-independent activities (A,B, sCSA+/sPCSA+ and/or FH-CSA+/FH-PCSA+). No significant difference was found in C3 levels and in C3d/C3 ratios (C–F). The boxes represent the values from the 25 to 75th percentiles. The horizontal bars are the medians. Vertical lines are the 95% confidence intervals. Empty circles are values outside the 95% confidence intervals. The horizontal dashed lines show the upper limits of normal range of plasma sC5b-9 (A,B) and of the C3d/C3 ratio (E,F), and the lower limit of serum C3 (C,D) in healthy subjects.
Figure 7
Figure 7
Distribution of the C3NeF IgG C3 convertase-stabilizing activities in the presence of properdin according to the clusters and the histology groups. Box plots show that C3 convertase-stabilizing activity against spontaneous (sPCSA) (A,C) decay did not differ among clusters or histology groups. C3 convertase-stabilizing activity against FH-mediated decay (FH-PCSA) (B,D) was significantly higher in patients of cluster 3 than in patients of clusters 1 and 2. The boxes represent the values from the 25 to 75th percentiles. The horizontal bars are the medians. Vertical lines are the 95% confidence intervals. Empty circles are values outside the 95% confidence intervals. The dashed horizontal line shows the limit of positive values (set at >mean+2SD of results with control IgGs from 26 healthy subjects). **P < 0.01.
Figure 8
Figure 8
Kaplan-Meyer analysis of the event nephrotic syndrome during the disease course. The analysis shows that patients with properdin dependent C3 convertase stabilizing activity against spontaneous (A, Group /+: sCSA/sPCSA+) or FH-mediated (B, Group /+: FHCSA/FHPCSA+) decay, have higher risk to manifest nephrotic syndrome than patients with properdin-independent activities (A, Group +/+: sCSA+/sPCSA+; B, Group +/+: FH+CSA+/FH+PCSA+.
Figure 9
Figure 9
Formation and decay of C3bB(Mn2+) C3 proconvertase in the absence or in the presence of C3NeF IgGs, by microplate/WB assay. (A) Time course of C3bB(Mn2+) C3 proconvertase formation. The complexes were obtained incubating C3b-coated wells at 37°C for 1, 2, 4, and 8 h with 1,000 ng/ml FB and 2 mM MnCl2 in the absence (-) or in the presence (+) of 2,640 ng/ml FH. The amount of C3bB formed was calculated as the density of B band (93 KDa), and reported in the bottom graph as Pixel2* 106. (B–D) Time course of C3bB(Mn2+) C3 proconvertase spontaneous and FH-mediated decay. C3bB(Mn2+) complexes formed in 2 h at 37°C in the absence (B) or in the presence of C3NeF IgGs purified from patients P5 (C) and P10 (D), were further incubated with buffer alone (decay –) or with buffer added with 2,640 ng/ml FH (decay +), respectively, for 30, 60, 120, and 240 min at 37°C The percentage of residual B band was calculated as the ratio of the densities (in Pixel2) of each B band after decay and the corresponding baseline B band density before decay x 100 and results are reported in the bottom graphs. The membranes were then incubated with an anti-FH antibody and FH band could be visualized at 150 KDa (top). Results of a representative microplate/WB experiment of n = 3 are shown.
Figure 10
Figure 10
Formation and decay of C3bB(Ni2+) C3 proconvertase and C3bBb(Ni2+) C3 convertase in the absence or in the presence of patient IgGs, by microplate/WB assay. (A) The time course of spontaneous and FH-mediated decay of C3bB(Ni2+) and C3bBb(Ni2+), both formed during 30 min at 37°C (baseline) by incubation of C3b coated wells with FB (1,000 ng/ml), FD (10 ng/ml), and NiCl2 (2 mM), was monitored by further incubation at 37°C for 5, 30, 60, and 120 min with buffer alone (decay –) or buffer added with 2,640 ng/ml FH (decay +). (B-C) C3bB(Ni2+) and C3bBb(Ni2+) were formed for 30 min at 37°C in NiCl2 buffer without (baseline –) or with 2,640 ng/ml FH (+) in the presence of IgGs purified from an healthy subjects (CTR-IgGs, B) or from patients P5 and P10 (C, P5-IgGs and P10-IgGs). The complexes formed in the absence of FH were then allowed to decay for 30 min (C) at 37°C with buffer alone (decay –) or buffer added with 2,640 ng/ml FH (decay +). The percentage of residual B (93 KDa) or Bb (60 KDa) bands was calculated as the ratio of the densities (in Pixel2) of each B or Bb band after decay and the corresponding baseline B or Bb band density before decay x 100 and results are reported in the bottom graphs. The membranes were then incubated with an anti-FH antibody and FH band could be visualized at 150 KDa (top). Results of a representative microplate/WB experiment of n = 3 are shown.

Similar articles

Cited by

References

    1. Sethi S, Fervenza FC. Membranoproliferative glomerulonephritis: pathogenetic heterogeneity and proposal for a new classification. Semin Nephrol. (2011) 31:341–8. 10.1016/j.semnephrol.2011.06.005 - DOI - PubMed
    1. Alchi B, Jayne D. Membranoproliferative glomerulonephritis. Pediatr Nephrol. (2010) 25:1409–18. 10.1007/s00467-009-1322-7 - DOI - PMC - PubMed
    1. Vallota EH, Forristal J, Spitzer RE, Davis NC, West CD. Characteristics of a non-complement-dependent C3-reactive complex formed form factors in nephritic and normal serum. J Exp Med. (1970) 131:1306–24. - PMC - PubMed
    1. West CD, Winter S, Forristal J, McConville JM, Davis NC. Evidence for in vivo breakdown of beta-10-globulin in hypocomplementemic glomerulonephritis. J Clin Invest. (1967) 46:539–48. 10.1172/JCI105555 - DOI - PMC - PubMed
    1. Levy M, Gubler MC, Sich M, Beziau A, Habib R. Immunopathology of membranoproliferative glomerulonephritis with subendothelial deposits (Type I MPGN). Clin Immunol Immunopathol. (1978) 10:477–92. - PubMed

Publication types

MeSH terms

Substances