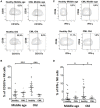
. 2018 Nov 8:9:2587.
doi: 10.3389/fimmu.2018.02587. eCollection 2018.

Effect of Age on NK Cell Compartment in Chronic Myeloid Leukemia Patients Treated With Tyrosine Kinase Inhibitors

Affiliations

Effect of Age on NK Cell Compartment in Chronic Myeloid Leukemia Patients Treated With Tyrosine Kinase Inhibitors

Paulo Rodrigues-Santos et al. Front Immunol. .

Abstract

Natural killer (NK) cells are a very important component of the innate immune response involved in the lysis of virus infected and tumor cells. Aging has a profound impact in the frequency, phenotype and function of NK cells. Chronic Myeloid Leukemia (CML) is caused by the BCR-ABL gene formation encoding aberrant oncoprotein tyrosine kinase. Treatment with tyrosine kinase inhibitors (TKIs) induces durable deep molecular response. The response to treatment and life expectancy is lower in older patients with chronic phase of CML than in younger patients. In this work we analyse NK cells from TKI-treated CML patients and healthy controls stratified according to age. We have analyzed the expression of NK receptors, activation markers, NK cell differentiation in CD56bright and CD56dim NK cell subsets and the expression of CD107a and IFN-γ in NK cells stimulated with K562. Whereas significant differences on the phenotype and function of NK cells were found between middle-aged (35-65 years old) and elderly (older than 65) healthy individuals, NK cells from TKI-treated CML patients do not show significant differences related with age in most parameters studied, indicating that age is not a limitation of the NK cell recovery after treatment with TKI. Our results also revealed differences in the expression of NK receptors, activation markers and functional assays in NK cells from TKI-treated CML patients compared with age-matched healthy controls. These results highlight the relevance of NK cells in TKI-treated patients and the need of an extensive analysis of the effect of aging on NK cell phenotype and function in these patients in order to define new NK-cell based strategies directed to control CML progression and achieve long-term disease remission after TKI cessation.

Keywords: CML; NK cell subsets; NK receptors; activation markers; aging; cytokines; differentiation markers; tyrosine kinase inhibitors.


Figures
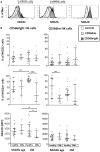
Figure 1
Figure 1
Expression of Natural Killer Group 2 (NKG2) receptors on NK cell subpopulations. (A) Representative histograms for each marker are shown (the non-shaded area represents the control, the shaded area of light gray, the CD56dim cells, the shaded one of gray, the CD56bright cells). The percentage of cells expressing NKG2C, NKG2A, and NKG2D as (MFI) measured in the total of cells, was determined on the surface of each subset by multiparametric flow cytometry. (B) Expression of activating receptors (NKG2C and NKG2D) and of inhibitory receptor (NKG2A) on CD56bright and CD56dim NK subsets from healthy individuals and TKI-treated CML patients, stratified according to age (middle-aged 35–65 years and old >65 years). Number of donors: NKG2C middle-aged healthy n = 19, middle-aged CML n = 13, old healthy n = 23, and old CML n = 10; NKG2D middle-aged healthy n = 18, middle-aged CML n = 10, old healthy n = 23, and old CML n = 4; NKG2A middle-aged healthy n = 13, middle-aged CML n = 17, old healthy n = 23, and old CML n = 11. The results, expressed as median with interquartile range, were considered significant at p < 0.05. P-values were determined comparing middle age with old and healthy with TKI-treated CML patients. *p <0.05; **p <0.01; ***p <0.001.
Figure 2
Figure 2
Expression of Natural Cytotoxicity Receptors (NCRs) on CD56bright and CD56dim NK cells. (A) Representative histograms for NKp30, NKp46, and NKp80 are shown (the shaded area of light gray, the CD56dim cells, the shaded one of gray, the CD56bright cells). Results were expressed as Median Fluorescence Intensity (MFI), measured in the total of cells. (B) Expression of activating receptors NKp30, NKp46, and NKp80 on CD56bright and CD56dim NK subsets from healthy individuals and TKI-treated CML patients, stratified according to age (middle-aged 35–65 years and old >65 years). Number of donors: NKp30 and NKp80 middle-aged healthy n = 19, middle-aged CML n = 11, old healthy n = 23, and old CML n = 9; NKp46 middle-aged healthy n = 19, middle-aged CML n = 16, old healthy n = 23 and old CML n = 10. The results were expressed as median with interquartile range. P-values were determined comparing middle age with old and healthy with TKI-treated CML patients and were considered significant at p <0.05. * p < 0.05; **p < 0.01; ***p < 0.001.
Figure 3
Figure 3
Expression of activation markers on CD56bright and CD56dim NK cell subpopulations. Determination of activation markers expression (HLA-DR, CD69, and NKp44) on the surface of CD56bright and CD56dim NK cells from the different study groups. NK cells were not stimulated. (A) Expression of HLA-DR (measured as MFI), CD69 and NKp44 (in percentage) on CD56bright NK cells. (B) Expression of HLA-DR (MFI) and percentage of CD69 and NKp44 on CD56dim NK cells. Number of donors: HLA-DR middle-aged healthy n = 19, middle-aged CML n = 13, old healthy n = 23 and old CML n = 15; CD69 middle-aged healthy n = 19, middle-aged CML n = 12, old healthy n = 23, and old CML n = 15; NKp44 middle-aged healthy n = 19, middle-aged CML n = 11, old healthy n = 23, and old CML n = 9. The results, expressed as median with interquartile range, were considered significant at p < 0.05. P-values were determined comparing middle age with old and healthy with TKI-treated CML patients. *p < 0.05; **p <0.01; ***p <0.001.
Figure 4
Figure 4
NK cell subsets in healthy and TKI-treated CML individuals stratified by age. (A) Percentage of CD56bright and CD56dim NK cells referred to the total of CD56+ NK cells and NK cells referred of total Lymphocytes from healthy donors and TKI-treated CML patients. (B) Percentage of NK cells expressing CD57 determined in CD56bright and CD56dim NK cell subsets from both healthy and TKI-treated CML individuals. (C) Percentage of CD11b and CD27 positive cells in CD56bright and CD56dim NK cell subsets from both healthy and TKI-treated CML individuals. Number of donors: CD56bright, CD56dim, and NK cells, middle-aged healthy n = 19, middle-aged CML n = 19, old healthy n = 23, and old CML n = 19; CD57 middle-aged healthy n = 19, middle-aged CML n = 19, old healthy n = 23, and old CML n = 18; CD11b+CD27+ middle-aged healthy n = 19, middle-aged CML n = 16, old healthy n = 23, and old CML n = 10. Graphics show the median with interquartile range. Kruskal-Wallis test was used for multiple comparisons and the Mann-Whitney U-test for the comparison of specific groups. The differences were considered significant in a range of p < 0.05. *p < 0.05; **p < 0.01; ***p < 0.001.
Figure 5
Figure 5
Cytokine expression and degranulation in stimulated NK cells. Analysis of CD107a degranulation assay and IFN-γ expression by Natural killer cells following stimulation with K562 target cells. (A) Representative dotplots and (B) percentage of CD107a in NK cells from healthy donors and TKI-treated CML patients according to age and CML. (C) Representative dotplots and (D) IFN-γ expression in NK cells from healthy donors and TKI-treated CML patients according to age and CML (middle-aged healthy n = 16, middle-aged CML n = 15, old healthy n = 23, and old CML n = 8). Numbers in (A,C) represent the percentage of positive cells referred to the CD56+ NK cells. The results in (B,D) were shown as median with interquartile range. Values of p < 0.05 were considered significant. P-values were determined comparing middle age with old and healthy with TKI-treated CML patients. *p < 0.05; ***p < 0.001.
Figure 6
Figure 6
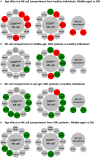
Schematic representation of major differences in resting and K562 stimulated NK cells according to age and CML. Circles represent NK cell subpopulations expressing the indicated membrane markers in CD56bright and CD56dim resting NK cells and the expression of CD107a and IFN-γ in K562 stimulated NK cells. Red color was used for increased expression and green color for decreased expression of the membrane markers in NK cells from healthy old compared with healthy middle-aged individuals (A), from CML patients compared with age-matched healthy donors (B,C), or in old CML patients compared with middle-aged CML patients (D).

References

    1. Spits H, Bernink JH, Lanier L. NK cells and type 1 innate lymphoid cells: partners in host defense. Nat Immunol. (2016) 17:758–64. 10.1038/ni.3482 - DOI - PubMed
    1. Cooper MA, Fehniger TA, Caligiuri MA. The biology of human natural killer-cell subsets. Trends Immunol. (2001) 22:633–40. 10.1016/S1471-4906(01)02060-9 - DOI - PubMed
    1. Fauriat C, Long EO, Ljunggren HG, Bryceson YT. Regulation of human NK-cell cytokine and chemokine production by target cell recognition. Blood (2010) 115:2167–76. 10.1182/blood-2009-08-238469 - DOI - PMC - PubMed
    1. Ouyang Q, Baerlocher G, Vulto I, Lansdorp PM. Telomere length in human natural killer cell subsets. Ann N Y Acad Sci. (2007) 1106:240–52. 10.1196/annals.1392.001 - DOI - PubMed
    1. Tarazona R, Casado JG, DelaRosa O, Torre-Cisneros J, Villanueva JL, Sanchez B, et al. . Selective depletion of CD56(dim) NK cell subsets and maintenance of CD56(bright) NK cells in treatment-naive HIV-1-seropositive individuals. J Clin Immunol. (2002) 22:176–83. 10.1023/A:1015476114409 - DOI - PubMed

Publication types

Substances