. 2018 Nov 14:9:2623.
doi: 10.3389/fimmu.2018.02623. eCollection 2018.

Impaired COMMD10-Mediated Regulation of Ly6Chi Monocyte-Driven Inflammation Disrupts Gut Barrier Function

Affiliations

Impaired COMMD10-Mediated Regulation of Ly6Chi Monocyte-Driven Inflammation Disrupts Gut Barrier Function

Odelia Mouhadeb et al. Front Immunol. .

Abstract

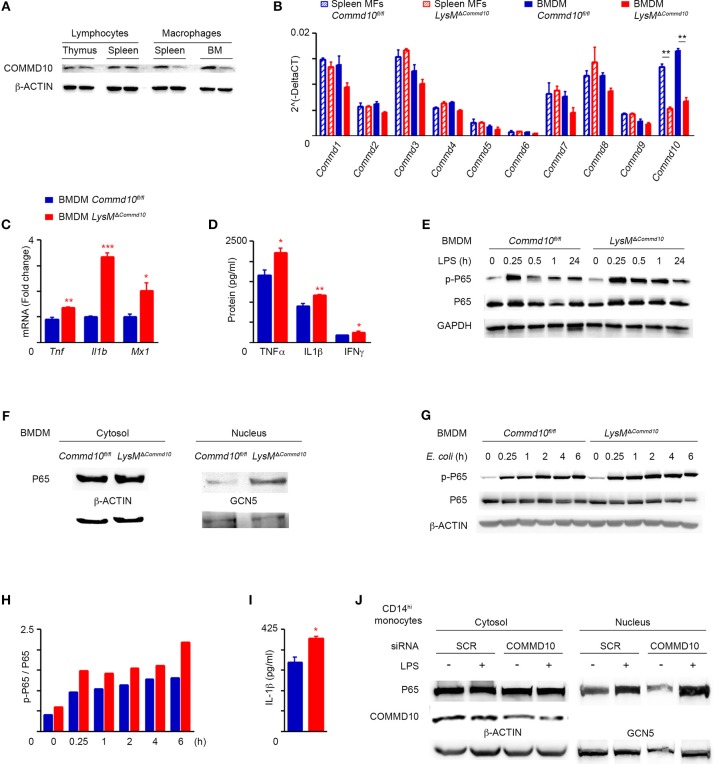
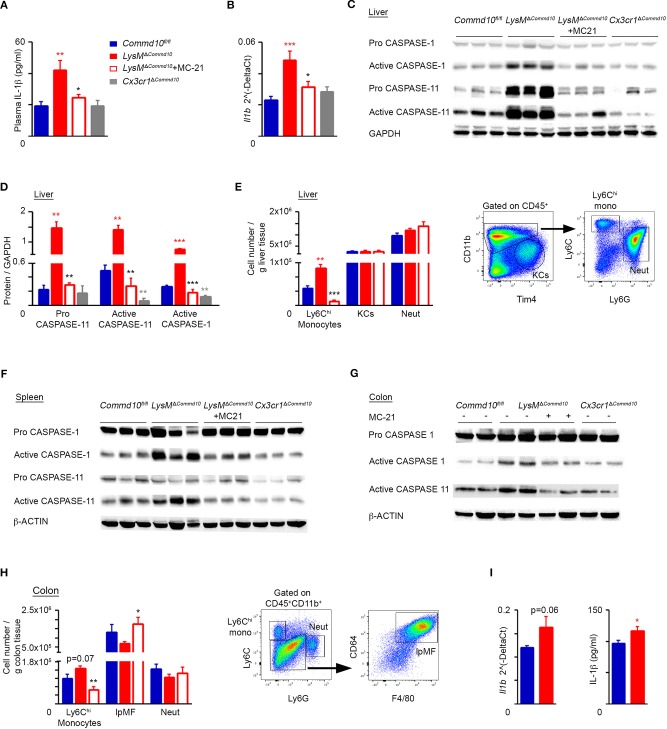
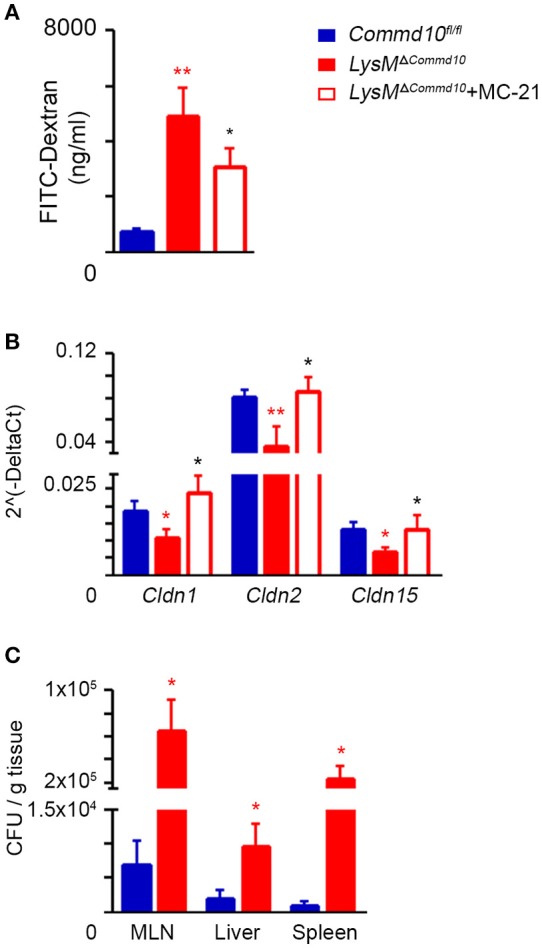
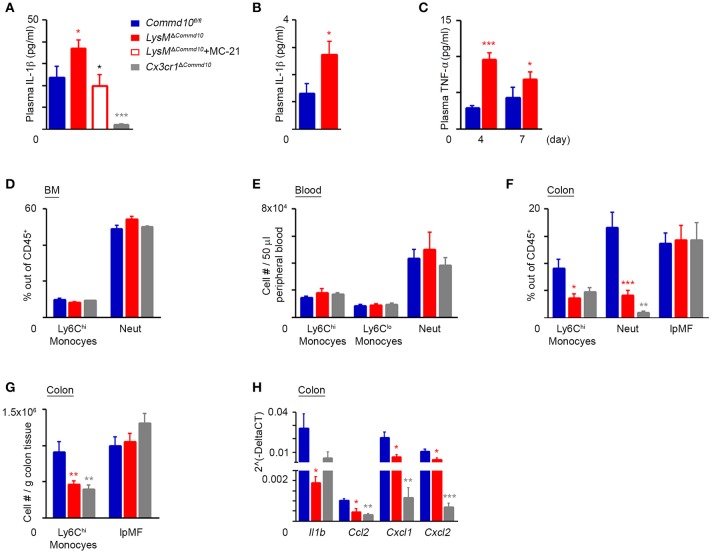
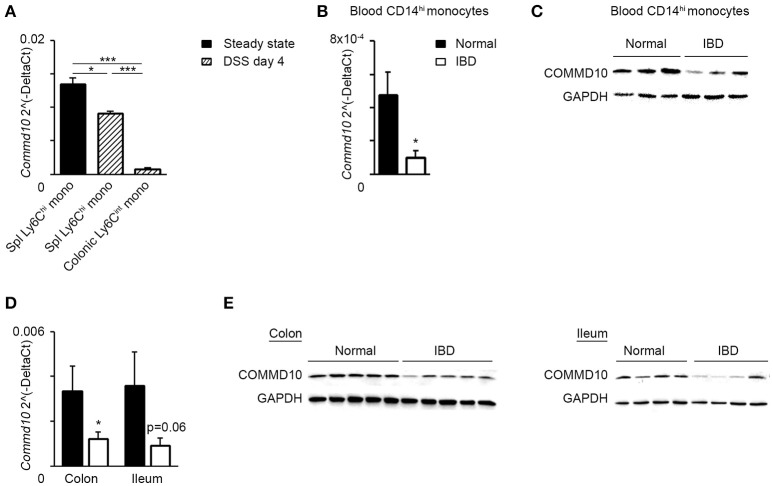
Ly6Chi monocyte tissue infiltrates play important roles in mediating local inflammation, bacterial elimination and resolution during sepsis and inflammatory bowel disease (IBD). Yet, the immunoregulatory pathways dictating their activity remain poorly understood. COMMD family proteins are emerging as key regulators of signaling and protein trafficking events during inflammation, but the specific role of COMMD10 in governing Ly6Chi monocyte-driven inflammation is unknown. Here we report that COMMD10 curbs canonical and non-canonical inflammasome activity in Ly6Chi monocytes in a model of LPS-induced systemic inflammation. Accordingly, its deficiency in myeloid cells, but not in tissue resident macrophages, resulted in increased Ly6Chi monocyte liver and colonic infiltrates, elevated systemic cytokine storm, increased activation of caspase-1 and-11 in the liver and colon, and augmented IL-1β production systemically and specifically in LPS-challenged circulating Ly6Chi monocytes. These inflammatory manifestations were accompanied by impaired intestinal barrier function with ensuing bacterial dissemination to the mesenteric lymph nodes and liver leading to increased mortality. The increased inflammasome activity and intestinal barrier leakage were ameliorated by the inducible ablation of COMMD10-deficient Ly6Chi monocytes. In consistence with these results, COMMD10-deficiency in Ly6Chi monocytes, but not in intestinal-resident lamina propria macrophages, led to increased IL-1β production and aggravated colonic inflammation in a model of DSS-induced colitis. Finally, COMMD10 expression was reduced in Ly6Chi monocytes and their corresponding human CD14hi monocytes sorted from mice subjected to DSS-induced colitis or from IBD patients, respectively. Collectively, these results highlight COMMD10 as a negative regulator of Ly6Chi monocyte inflammasome activity during systemic inflammation and IBD.

Keywords: COMMD10; Ly6Chi monocytes; colitis; inflammasome; systemic inflammation.


Figures

Figure 1
Figure 1
LysMΔCommd10 BMDM respond to LPS by higher production of pro-inflammatory cytokines. (A,B) Cells were isolated from spleen and BM of Commd10fl/fl (blue) or LysMΔCommd10 (red) mice. (A) Immunoblots showing the expression of COMMD10 in cell lysates of thymic or splenic lymphocytes vs. splenic or BM-derived macrophages. β-actin was utilized as control. (B) qRT-PCR gene expression of all COMMD family members in splenic macrophages and BMDM (n = 3). (C,D) BMDM were stimulated with LPS (100 ng/ml) for 3 h. (C) qRT-PCR gene expression of pro-inflammatory cytokine in cell lysate (n = 3). (D) ELISA of pro-inflammatory cytokine levels in cell free supernatants (n = 3). (E) Representative immunoblot of BMDM cell lysates following LPS challenge (100 ng/ml) showing the protein expression of phospho-P65 (p-P65) and P65 over time course. GAPDH was used as control. (F) Immunoblots showing P65 expression in cytosolic and nuclear fraction lysates of LPS-treated BMDM. β-ACTIN and Polymerase II antibodies, respectively, were used as controls (n = 3). (G–I) BMDM from Commd10fl/fl or LysMΔCommd10 mice were infected with E. Coli at multiplicity of infection (MOI) = 1. (G) Immunoblots showing the protein expression of p-P65 and P65 over time course. β-ACTIN was used as control. (H) Respective densitometry-based quantification of p-P65/P65 ratio in Commd10fl/fl vs. LysMΔCommd10 BMDM over time course following E. coli infection. (I) ELISA analysis of IL-1β from supernatants at 6 h post-infection with E. coli (n = 4). (J) Immunoblots showing cytosolic COMMD10 protein expression following siRNA-based gene silencing vs. scrambled siRNA control, β-ACTIN was used as control, and immunoblots showing P65 expression in cytosolic and nuclear fraction lysates of LPS-treated human CD14hi monocyte-derived macrophages. GCN5 was used as control in the nuclear fraction (n = 3). Data were analyzed by unpaired, two-tailed t-test, comparing each time between Commd10fl/fl and LysMΔCommd10 (red stars), and are presented as mean ± SEM with significance: *p < 0.05, **p < 0.01, ***p < 0.001. Data in (A,B,E) represents two-independent experiments. Data in (C,D,F–J) are from a single experiment.
Figure 2
Figure 2
LysMΔCommd10 mice exhibit aggravated cytokine storm and mortality in response to systemic LPS challenge. (A,B) Commd10fl/fl (blue) and LysMΔCommd10 (red) mice were i.p. injected with LPS (0.2 mg per mouse matched for body mass) and sacrificed 4 h later. (A) Multiplex ELISA array of plasma pro-inflammatory cytokines (n = 4). (B) ELISA analysis of plasma TNF-α (n ≥ 3). (C) Survival curve over 72 h (n = 10). Data in (A,B) were analyzed by unpaired, two-tailed t-test, comparing each time between Commd10fl/fl and LysMΔCommd10 (red stars), and are presented as mean ± SEM with significance: *p < 0.05, **p < 0.01. Data in (C) were analyzed by Logrank (Mental-cox method) (P = 0.03) and Gehan-Breslow-Wilcoxon (P = 0.02) tests comparing between the Commd10fl/fl and LysMΔCommd10 groups. Data in (A,B) represent a single experiment. Data in (C) represent three independent experiments.
Figure 3
Figure 3
Increased canonical and non-canonical inflammasome activity in COMMD10-deficient Ly6Chi monocytes during LPS-induced systemic inflammation. (A–H) Commd10fl/fl (blue), LysMΔCommd10 (red) or Cx3cr1ΔCommd10 (gray) mice were i.p. injected with LPS (0.2 mg per mouse of similar body mass) and sacrificed 4 h later. Where indicated, MC-21 was injected 12 h prior to LPS stimulation (red border). (A) ELISA analysis of plasma IL-1β (n ≥ 5). (B) qRT-PCR gene expression of Il1b in liver extracts (n ≥ 5). (C) Immunoblots of liver lysates demonstrating the expression of pro- and active- caspase-1 and−11. GAPDH was utilized as control (n = 3). (D) Respective densitometry-based quantification of pro-caspase-11, active caspase-1 and active caspase-11, normalized to GAPDH. (E) Left panel: flow cytometry-based assessment of liver Ly6Chi monocyte, KC and neutrophil abundance normalized to tissue mass (g) (n = 5). Right panel: representative flow cytometry images showing gating strategy of liver Ly6Chi monocytes, KCs and neutrophils (n = 5). (F,G) Immunoblots of (F) spleen and (G) colon lysates demonstrating the expression of pro- and/or active- caspase-1 and−11. β-actin was utilized as control (n = 3 for E, n = 2 for F). (H) Left panel: flow cytometry-based assessment of colonic Ly6Chi monocyte, resident lpMF and neutrophil abundance normalized to tissue mass (g) (n = 5). Right panel: representative flow cytometry images showing gating strategy of colonic Ly6Chi monocytes, lpMFs and neutrophils out of CD45+CD11b+ cells (n = 5). (I) Circulating Ly6Chi monocytes were sorted from their splenic reservoir and stimulated with LPS (100 ng/ml) for 10 h. Left panel: qRT-PCR gene expression of Il1b. Right panel: ELISA analysis of IL-1β from cell free supernatants (biological repeats: n = 3 for Commd10fl/fl and n = 4 for LysMΔCommd10, each repeat is composed from a pool of three mice). Data were analyzed by unpaired, two-tailed t-test, comparing each time between one of the mouse groups with Commd10fl/fl mice (colored stars), or between LysMΔCommd10 mice with and without MC-21 treatment (black stars). Results are presented as mean ± SEM with significance: *p < 0.05, **p < 0.01, ***p < 0.001. Data in (A–C,E,F,H) represent two independent experiments. Data in (D,G) represent a single experiment.
Figure 4
Figure 4
Increased intestinal barrier dysfunction in LPS-challenged LysMΔCommd10 mice driven by Ly6Chi monocytes. Commd10fl/fl (blue) and LysMΔCommd10 (red) mice were i.p. injected with LPS (0.2 mg per mouse of similar weight) and sacrificed 24 or 48 h later. Where indicated, MC-21 was injected 12 h prior to LPS stimulation and every 24 h (red border). (A) Fluorometric assessment of FITC dextran plasma signal at 4 h following its oral administration to mice after 24 h of LPS challenge (n ≥ 6). (B) Graphical summary of qRT-PCR assessment of Claudin 1, 2, and 15 gene expressions at 48 h following LPS challenge (n ≥ 7). (C) Indicated tissues were extracted at 48 h following LPS injection. Colony forming units (CFU) were determined and normalized to tissue mass (n = 4). Data were analyzed by unpaired, two-tailed t-test, comparing each time between Commd10fl/fl and LysMΔCommd10 (red stars) or between LysMΔCommd10 mice with and without MC-21 treatment (black stars). Data are presented as mean ± SEM with significance: *p < 0.05, **p < 0.01. Data in (A–C) represent 2–3 independent experiments.
Figure 5
Figure 5
LysMΔCommd10, but not Cx3cr1ΔCommd10 mice exhibit augmented DSS-induced colitis. Commd10fl/fl (blue), LysMΔCommd10 (red) or Cx3cr1ΔCommd10 (gray) mice were treated with DSS (1.5% in drinking water) for 7 days. (A) Left panel: Scatter plot graph demonstrating colonoscopy scores as determined by live colonoscopy (n ≥ 14). Right panel: Representative colonoscopy images. (B) Left panel: graph demonstrating colon length. Right panel: Representative colon images (n ≥ 17 for Commd10fl/fl and LysMΔCommd10 groups, n = 5 for Cx3cr1ΔCommd10 group). Data were analyzed by unpaired, two-tailed t-test, comparing each time between one of the mouse groups with Commd10fl/fl mice (colored stars). Results are presented as mean ± SEM with significance: **p < 0.01, ***p < 0.001. Data in (A,B) represent 2–3 independent experiments.
Figure 6
Figure 6
COMMD10 negatively regulates inflammasome activity in Ly6Chi monocytes during colitis. Commd10fl/fl (blue), LysMΔCommd10 (red) or Cx3cr1ΔCommd10 (gray) mice were treated with DSS (1.5% in drinking water) for 4 or 7 days. Where indicated, MC-21 was injected every day, starting at 24 h after DSS administration (red border). (A) ELISA analysis of plasma IL-1β at day 4 and (B) day 7 of DSS (n ≥ 5). (C) ELISA analysis of plasma TNF-α (n≥4). (D) Flow cytometry-based assessment of BM Ly6Chi monocyte and neutrophil fractions out of total CD45+ immune cells at day 4 of DSS (n ≥ 5). (E) Flow cytometry-based assessment of Ly6Chi and Ly6Clo monoyctes and neutrophils in 50 μl peripheral blood at day 4 of DSS (n = 6). (F) Flow cytometry-based assessment of colonic Ly6Chi monocyte, neutrophil and resident lpMF fractions out of total CD45+ immune cells at day 4 of DSS (n = 6). (G) Flow cytometry-based assessment of colonic Ly6Chi monocyte and resident lpMF abundance normalized to tissue mass at day 4 of DSS (n ≥ 10). (H) qRT-PCR gene expression of Il1b, Ccl2, Cxcl1, and Cxcl2 in colon tissue at day 4 of DSS (n ≥ 4). Data were analyzed by unpaired, two-tailed t-test, comparing each time between one of the mouse groups with Commd10fl/fl mice (colored stars), or between LysMΔCommd10 mice with and without MC-21 treatment (black stars). Results are presented as mean ± SEM with significance: *p < 0.05, **p < 0.01, ***p < 0.001. Data in (A,C,F–H) represent two independent experiments. Data in (D and E) represent a single experiment.
Figure 7
Figure 7
COMMD10 is downregulated in mouse Ly6Chi monocytes and their equivalent human CD14hi monocytes during intestinal inflammation. (A) Splenic and colonic Ly6Chi monocytes were sorted from steady state mice (solid) or at day 4 of DSS (diagonal). (B,C) Circulating CD14hi monocytes were sorted from patients with active IBD (black border) or healthy controls (solid). (B) qRT-PCR gene expression of Commd10 and (C) immunoblot demonstrating COMMD10 protein expression. GAPDH was utilized as control (n ≥ 3). (D,E) Biopsies were obtained from colons and terminal ileums of IBD patients with active disease and healthy controls. (D) qRT-PCR analysis of Commd10 gene expression. (E) Immunoblots demonstrating COMMD10 protein expression in colon (left panel) and ileum (right panel) biopsies obtained from IBD patients vs. healthy controls. GAPDH was utilized as controls (n ≥ 14). Data were analyzed by unpaired, two-tailed t-test, comparing each time between IBD with healthy controls. Results are presented as mean ± SEM with significance: *p < 0.05, ***p < 0.001. Data in (A–C) represent a single experiment.

Similar articles

Cited by

References

    1. Varol C, Mildner A, Jung S. Macrophages: development and tissue specialization. Annu Rev Immunol. (2015) 33:643–75. 10.1146/annurev-immunol-032414-112220 - DOI - PubMed
    1. van Furth R, Cohn ZA, Hirsch JG, Humphrey JH, Spector WG, Langevoort HL. The mononuclear phagocyte system: a new classification of macrophages, monocytes, and their precursor cells. Bull World Health Organ. (1972) 46:845–52 - PMC - PubMed
    1. Mildner A, Yona S, Jung S. A close encounter of the third kind: monocyte-derived cells. Adv Immunol. (2013) 120:69–103. 10.1016/B978-0-12-417028-5.00003-X - DOI - PubMed
    1. Zigmond E, Samia-Grinberg S, Pasmanik-Chor M, Brazowski E, Shibolet O, Halpern Z, et al. . Infiltrating monocyte-derived macrophages and resident kupffer cells display different ontogeny and functions in acute liver injury. J Immunol. (2014) 193:344–53. 10.4049/jimmunol.1400574 - DOI - PubMed
    1. Scott CL, Zheng F, De Baetselier P, Martens L, Saeys Y, De Prijck S, et al. . Bone marrow-derived monocytes give rise to self-renewing and fully differentiated Kupffer cells. Nat Commun. (2016) 7:10321. 10.1038/ncomms10321 - DOI - PMC - PubMed

Publication types

MeSH terms