. 2018 Nov 14:9:2656.
doi: 10.3389/fimmu.2018.02656. eCollection 2018.

The Host Microbiota Contributes to Early Protection Against Lung Colonization by Mycobacterium tuberculosis

Affiliations

The Host Microbiota Contributes to Early Protection Against Lung Colonization by Mycobacterium tuberculosis

Alexia Dumas et al. Front Immunol. .

Abstract

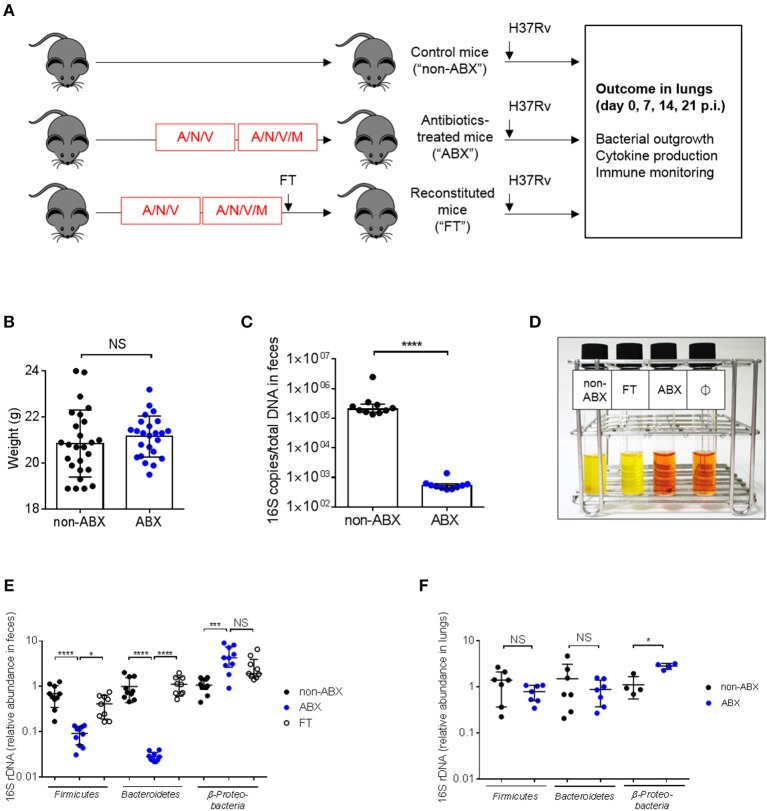
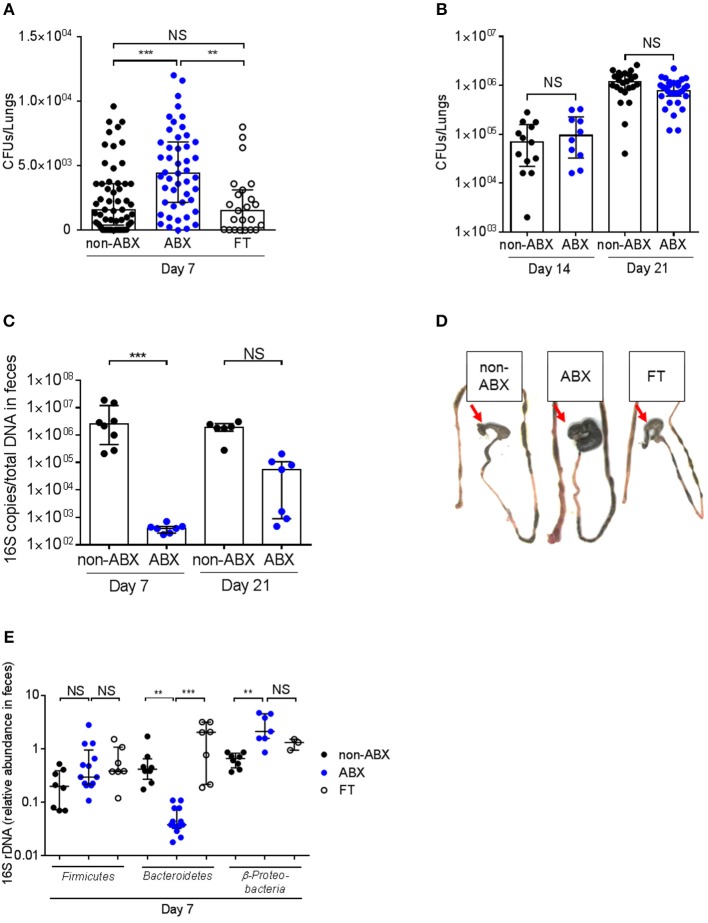
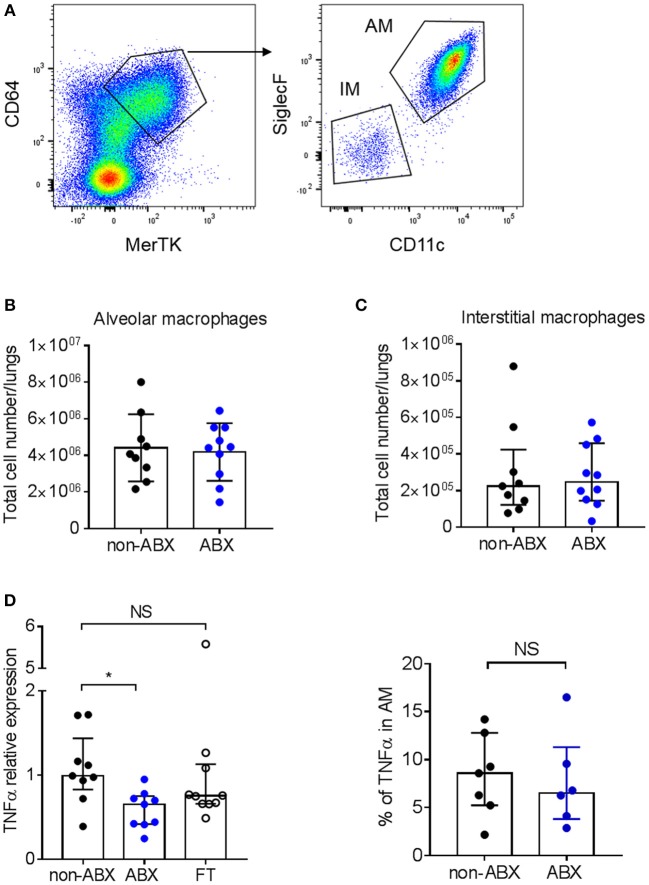
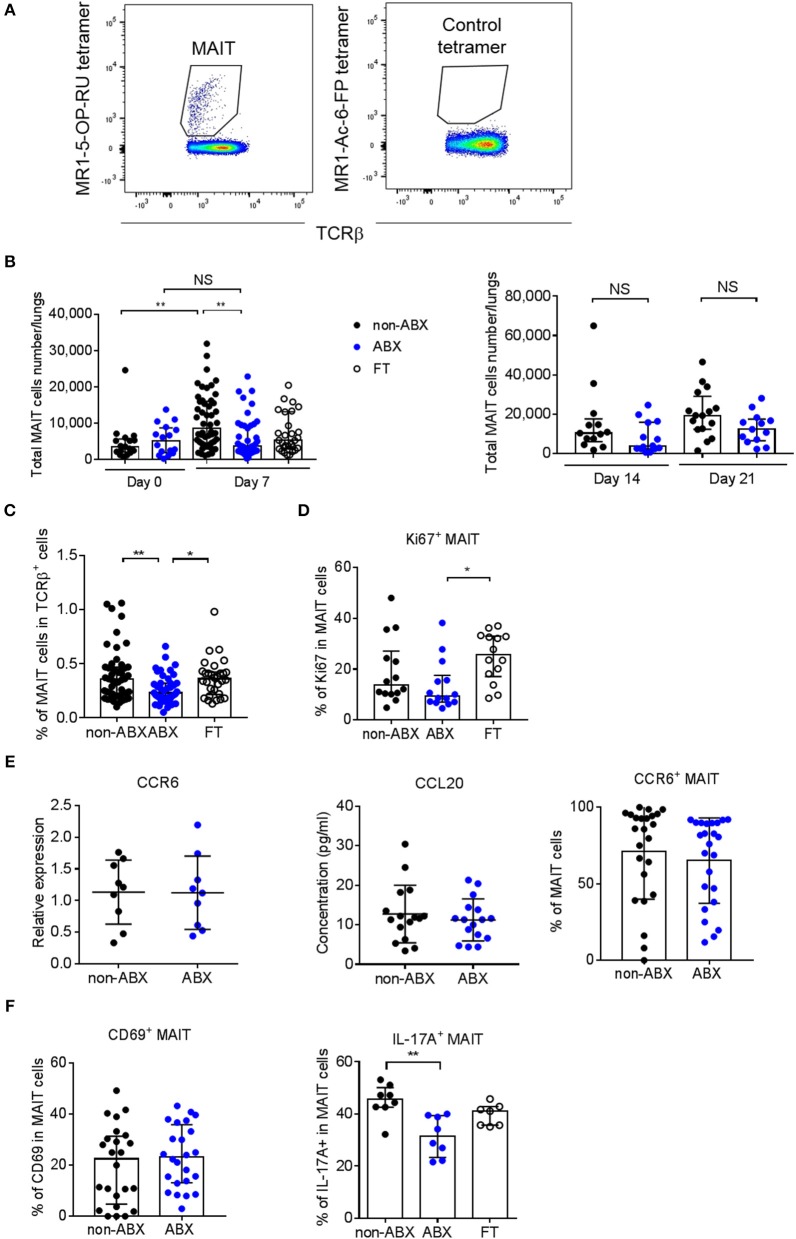
Tuberculosis (TB), caused by the airborne bacterial pathogen Mycobacterium tuberculosis, remains a major source of morbidity and mortality worldwide. So far, the study of host-pathogen interactions in TB has mostly focused on the physiology and virulence of the pathogen, as well as, on the various innate and adaptive immune compartments of the host. Microbial organisms endogenous to our body, the so-called microbiota, interact not only with invading pathogens, but also with our immune system. Yet, the impact of the microbiota on host defense against M. tuberculosis remains poorly understood. In order to address this question, we adapted a robust and reproducible mouse model of microbial dysbiosis based on a combination of wide-spectrum antibiotics. We found that microbiota dysbiosis resulted in an increased early colonization of the lungs by M. tuberculosis during the first week of infection, correlating with an altered diversity of the gut microbiota during this time period. At the cellular level, no significant difference in the recruitment of conventional myeloid cells, including macrophages, dendritic cells and neutrophils, to the lungs could be detected during the first week of infection between microbiota-competent and -deficient mice. At the molecular level, microbiota depletion did not impact the global production of pro-inflammatory cytokines, such as interferon (IFN)γ, tumor necrosis factor (TNF)α and interleukin (IL)-1β in the lungs. Strikingly, a reduced number of mucosal-associated invariant T (MAIT) cells, a population of innate-like lymphocytes whose development is known to depend on the host microbiota, was observed in the lungs of the antibiotics-treated animals after 1week of infection. These cells produced less IL-17A in antibiotics-treated mice. Notably, dysbiosis correction through the inoculation of a complex microbiota in antibiotics-treated animals reversed these phenotypes and improved the ability of MAIT cells to proliferate. Altogether, our results demonstrate that the host microbiota contributes to early protection of lung colonization by M. tuberculosis, possibly through sustaining the function(s) of MAIT cells. Our study calls for a better understanding of the impact of the microbiota on host-pathogen interactions in TB. Ultimately, this study may help to develop novel therapeutic approaches based on the use of beneficial microbes, or components thereof, to boost anti-mycobacterial immunity.

Keywords: IL-17; MAIT cells; macrophage; microbiota; tuberculosis.


Figures

Figure 1
Figure 1
Mouse model to study the impact of microbiota dysbiosis during M. tuberculosis infection. (A) Experimental design. Six-to-eight weeks old C57BL/6 female mice were treated for 4 weeks with a cocktail of broad-spectrum antibiotics (ampicillin, A, neomycin sulfate, N, vancomycin, V, and metronidazole, M, which was added during the last 2 weeks) in drinking water (ABX) or were given water without antibiotics (non-ABX). Microbiota reconstitution was realized through fecal transplantation (FT) after a single oral gavage with the intestinal content from 2 control mice and occurred during 1 week. The three groups of mice received an intranasal challenge of M. tuberculosis H37Rv (103 CFUs/mouse). Bacterial outgrowth, cytokine production and immune monitoring were determined 0, 7, 14, or 21 days post-infection (p.i.) in the lungs. (B) Mouse weight in the ABX vs. non-ABX groups at the time of M. tuberculosis infection. Data from 4 independent experiments (n = 4–14 mice/group/experiment) were pooled and the graph represent mean ± SD of the pooled data. Data were analyzed using the unpaired Student's t-test. (C) The amount of bacterial rDNA was assessed using the “Universal 16S RT-qPCR” kit, calculated as 16S rDNA gene copies per total DNA extracted from feces of non-ABX and ABX groups before infection. (D) Colorimetric evaluation of the presence of microbial flora in the feces of the different groups of animals before infection; Ø indicates negative control. Yellow color indicates the presence of live microorganisms. Image depicted in (D) is representative of 3 independent experiments. Fecal (E) and lung (F) microbiota were detected by RT-qPCR using phylum-specific primers. Relative Ct value compared to universal 16S rRNA gene Ct value (ΔCt) and the mean of ΔCt values in the control group (ΔΔCt). (E, F) data from 2–3 independent experiments (n = 2–4 mice/group/experiment) were pooled. The graph (E) show mean ± SD (Firmicutes and Bacteroidetes) and median with interquartile range (Proteobacteria) of the pooled data. Data were analyzed using ANOVA (Firmicutes and Bacteroidetes) and the Kruskal-Wallis test (Proteobacteria). The graph (F) show median with interquartile range of the pooled data. Data were analyzed using the Mann-Whitney test. NS, not significant; *p < 0.05; ***p < 0.001; ****p < 0.0001.
Figure 2
Figure 2
The host microbiota protects against early lung colonization by M. tuberculosis. (A) M. tuberculosis bacterial load (CFUs) was measured in the lungs of control (non-ABX), ABX and FT mice 7 days p.i. (B) M. tuberculosis bacterial load was measured in the lungs of control (non-ABX) and ABX mice 14 or 21 days p.i., Data from 3–6 (A) or 2 (B) independent experiments (n = 4–8 mice/group/experiment) were pooled and the graphs show median with interquartile range of the pooled data. Data were analyzed using the Kruskal-Wallis test. (C) The amount of bacterial rDNA was assessed using the “Universal 16S RT-qPCR” kit, calculated as 16S rDNA gene copies per total DNA extracted from feces of non-ABX, ABX, and FT groups 7 days p.i. (D) Morphology of the caecum in the non-ABX, ABX, and FT groups 7 days p.i., Red arrow indicates the caecum. Image depicted in (D) is representative of 3 independent experiments. (E) Fecal microbiota from non-ABX, ABX and FT groups was analyzed by RT-qPCR using phylum-specific primers 7 days p.i., Data were analyzed as in Figure 1. (C,E) Data from 1–4 independent experiments (n = 2–5 mice/group/experiment) were pooled and the graphs show median with interquartile range of the pooled data. Data were analyzed using the Kruskal-Wallis test. NS, not significant; **p < 0.01; ***p < 0.001.
Figure 3
Figure 3
Microbiota dysbiosis modify TNFα mRNA expression but not protein production by alveolar macrophages. (A) Gating strategy to analyze alveolar (MerTK+CD64+SiglecF+CD11c+) and interstitial (MerTK+CD64+SiglecFCD11c) macrophages by flow cytometry. The total number of (B) alveolar and (C) interstitial macrophages was quantified by flow-cytometry in lung homogenates from M. tuberculosis-infected ABX vs. non-ABX mice 7 days p.i., Data from 2 independent experiments (n = 4–5 mice/group/experiment) were pooled and the graphs show mean ± SD (B) or median with interquartile range (C). Data were analyzed using the Student's t-test (B) or the Mann-Whitney test (C). (D) Left panel, MerTK+CD64+SiglecF+CD11c+ alveolar macrophages were sorted and the expression of TNFα was measured by RT-qPCR in cells from non-ABX, ABX, or FT mice 7 days p.i., Gene expression represents relative Ct value compared to Hprt Ct value (ΔCt) and the mean of ΔCt values in the control group (ΔΔCt). Right panel, cytometry analysis of the percentage of TNFα-producing MerTK+CD64+SiglecF+CD11c+ alveolar macrophages following in vitro stimulation by LPS. Data from 1–2 independent experiments (n = 4–5 mice/group/experiment) were pooled and the graphs show median with interquartile range of the pooled data and were analyzed using the Mann-Whitney test *p < 0.05.
Figure 4
Figure 4
MAIT cell accumulation in the lungs and IL-17A-production are decreased early after M. tuberculosis infection in microbiota-altered mice. (A) Gating strategy to analyze MAIT cells (MR1-5-OP-RU tetramer+TCRβ+) by flow cytometry. A MR1–Ac-6-FP tetramer+TCRβ+ staining was used as a control. (B,C) Total number (B) and percentage (C) of MAIT cells in the lungs of control (non-ABX) ABX, and FT mice 0 and 7 (B, left panel), 14 and 21 (B, right panel), and 7 (C) days p.i., Data from 2–6 independent experiments (n = 4–8 mice/group/experiment) were pooled and the graphs show median with interquartile range of the pooled data. Data were analyzed using the Kruskal-Wallis test. (D) Intracellular analysis of Ki67 expression in MAIT cells from non-ABX, ABX, and FT mice 7 days p.i., by flow cytometry. Data from 2 independent experiments (n = 4–8 mice/group/experiment) were pooled and the graphs show the median with interquartile range of the pooled data. Data were analyzed using the Kruskal-Wallis test. (E) The expression of CCR6 (left) in whole lung homogenates or in MAIT cells (right), and the production of CCL20 in lung supernatant (middle), were measured by RT-qPCR (left), flow cytometry (right) and ELISA (middle) in ABX and control (non-ABX) mice 7 days p.i., RT-qPCR data were analyzed as in Supplementary Figure 2. Data from 3 (left) or 4 (middle and right) independent experiments (n = 3–7 mice/group/experiment) were pooled and the graphs show mean ± SD of the pooled data. Data were analyzed using the Student's t-test. (F) Cytometry analysis of percentage of activated (MR1-5-OP-RU tetramer+TCRβ+CD69+) MAIT cells (left), and IL-17A-producing (MR1-5-OP-RU tetramer+TCRβ+IL-17A+) MAIT cells (right) in lungs of control (non-ABX), ABX and FT mice 7 days p.i., Data from 4 (left) or 1 representative of 3 (right) independent experiments (n = 5–8 mice/group/experiment) were pooled and the graphs show mean ± SD of the pooled data. (left) or median with interquartile range (right) of the pooled data. Data were analyzed using the unpaired Student's t-test (left) or the Kruskal-Wallis test (right). NS, not significant; *p < 0.05; **p < 0.01.

Similar articles

Cited by

References

    1. Tiberi S, Du Plessis N, Walzl G, Vjecha MJ, Rao M, Ntoumi F, et al. . Tuberculosis: progress and advances in development of new drugs, treatment regimens, and host-directed therapies. Lancet Infect Dis. (2018) 18:e183–98. 10.1016/S1473-3099(18)30110-5 - DOI - PubMed
    1. Pai M, Behr MA, Dowdy D, Dheda K, Divangahi M, Boehme CC, et al. Tuberculosis. Nat Rev Dis Primers (2016) 2:16076 10.1038/nrdp.2016.76 - DOI - PubMed
    1. Adami AJ, Cervantes JL. The microbiome at the pulmonary alveolar niche and its role in Mycobacterium tuberculosis infection. tuberculosis (2015) 95:651–8. 10.1016/j.tube.2015.07.004 - DOI - PMC - PubMed
    1. Namasivayam S, Sher A, Glickman MS, Wipperman MF. The microbiome and tuberculosis: early evidence for cross talk. mBio (2018) 9:e01420–18. 10.1128/mBio.01420-18 - DOI - PMC - PubMed
    1. Lozupone CA, Stombaugh JI, Gordon JI, Jansson JK, Knight R. Diversity, stability and resilience of the human gut microbiota. Nature (2012) 489:220–30. 10.1038/nature11550 - DOI - PMC - PubMed

Publication types

MeSH terms

LinkOut - more resources