. 2018 Nov 14:8:403.
doi: 10.3389/fcimb.2018.00403. eCollection 2018.

NLRX1 Negatively Regulates Group A Streptococcus Invasion and Autophagy Induction by Interacting With the Beclin 1-UVRAG Complex

Affiliations

NLRX1 Negatively Regulates Group A Streptococcus Invasion and Autophagy Induction by Interacting With the Beclin 1-UVRAG Complex

Chihiro Aikawa et al. Front Cell Infect Microbiol. .

Abstract

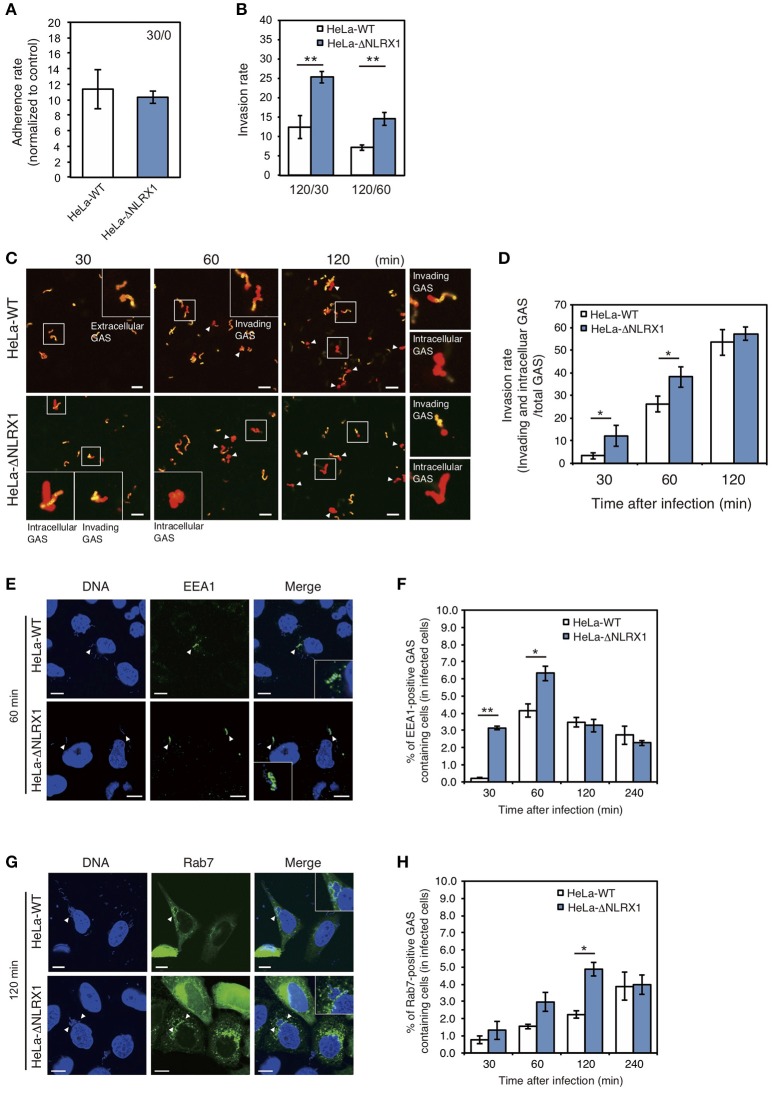
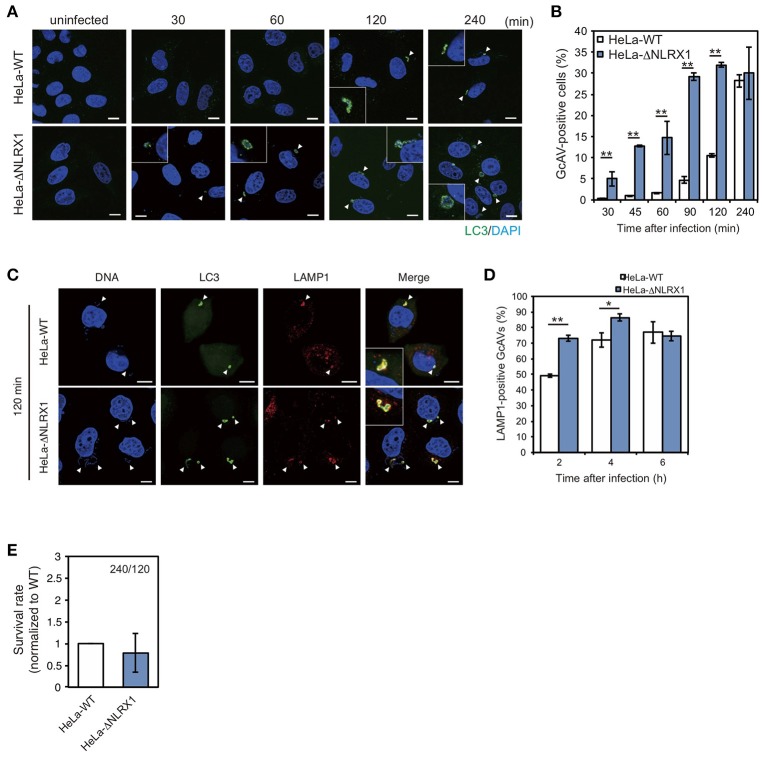
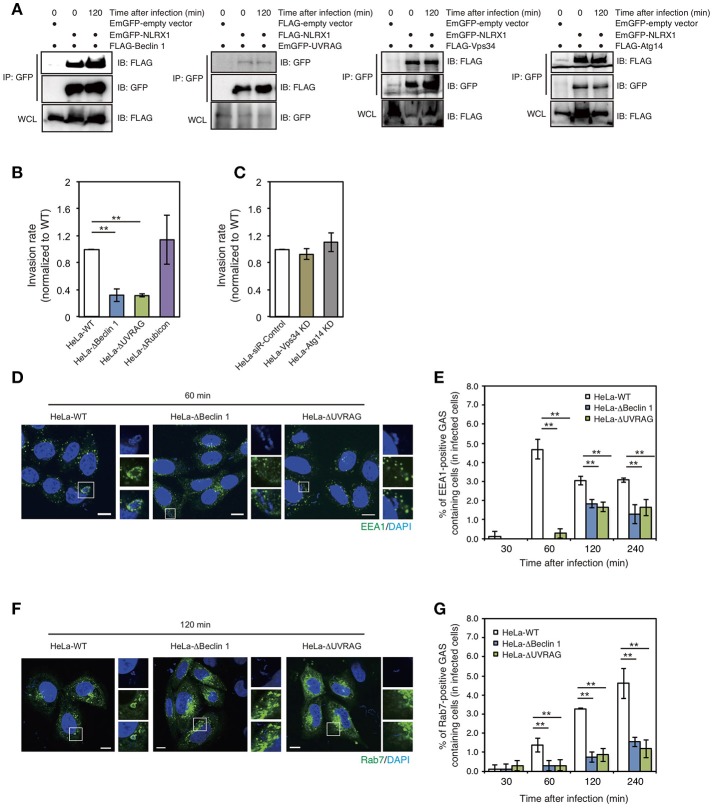
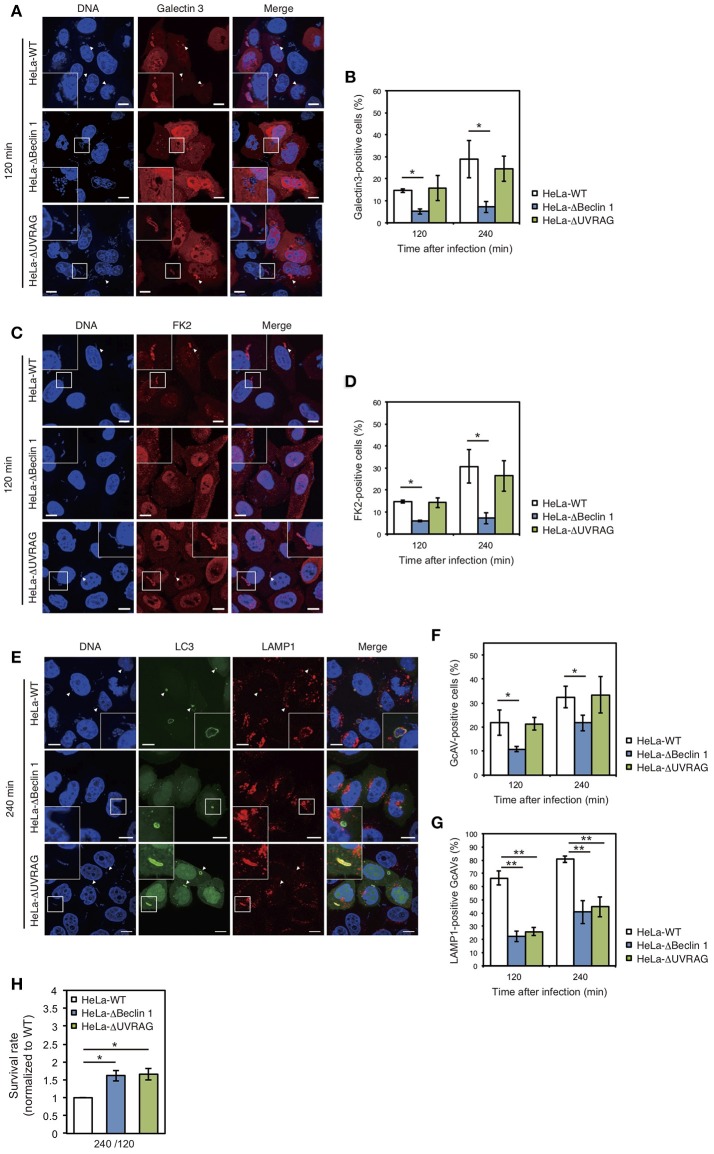
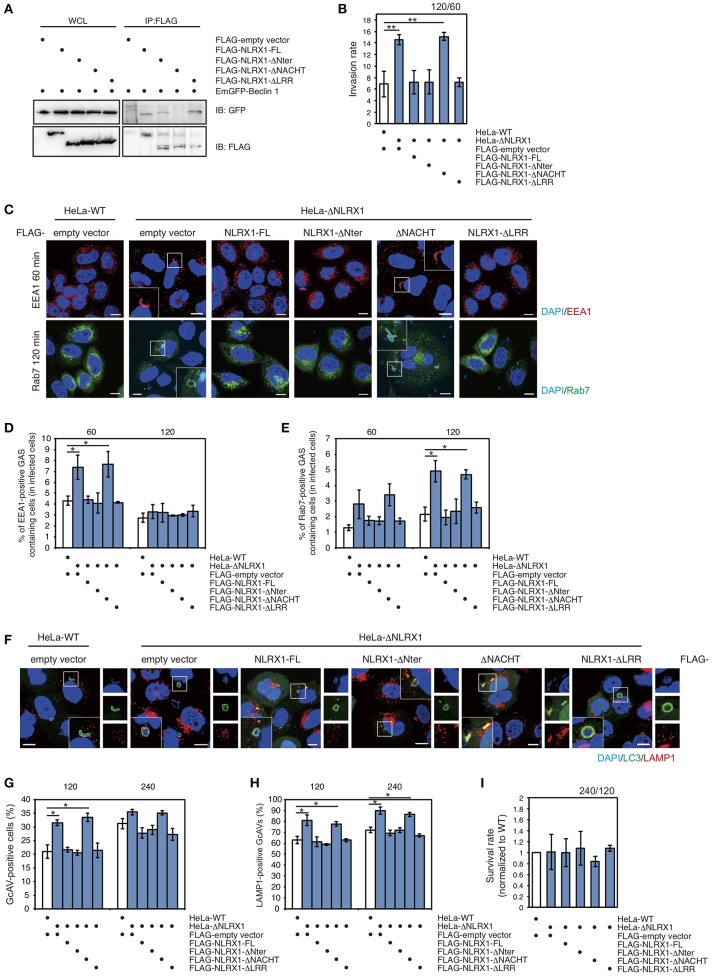
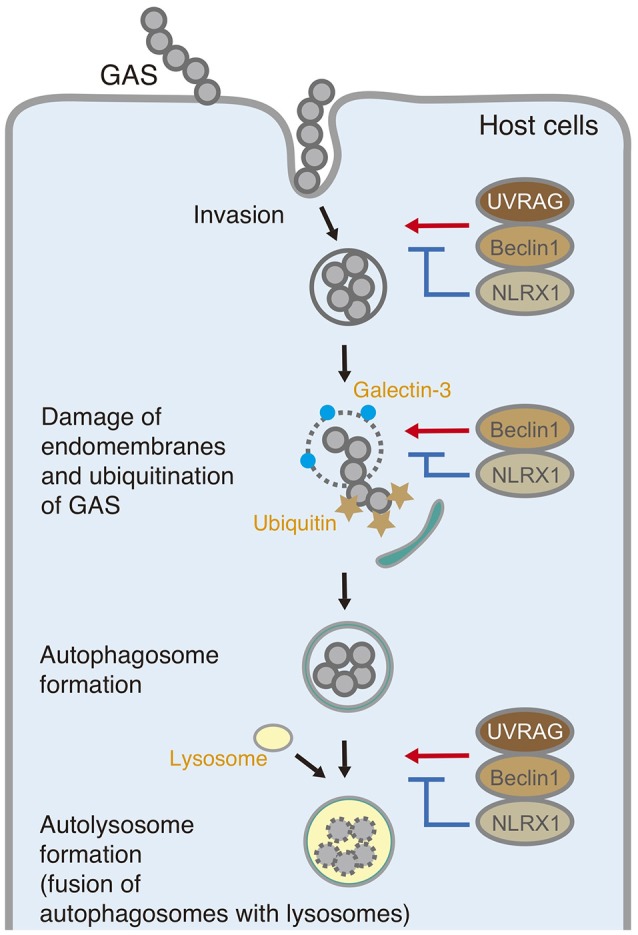
Group A Streptococcus (GAS) can invade epithelial cells; however, these bacteria are targeted and eventually destroyed by autophagy. Members of the Nod-like receptor (NLR) family are thought to be critical for the autophagic response to invasive bacteria. However, the intracellular sensors within host cells that are responsible for bacterial invasion and the induction of autophagy are largely unknown. Thus, our aim was to examine the role of one such NLR, namely NLRX1, in invasion and autophagy during GAS infection. We found that GAS invasion was markedly increased in NLRX1 knockout cells. This led to the potentiation of autophagic processes such as autophagosome and autolysosome formation. NLRX1 was found to interact with Beclin 1 and UVRAG, members of Beclin1 complex, and knockout of these proteins inhibited invasion and autophagy upon GAS infection. Especially, NLRX1 interacted with Beclin 1 via its NACHT domain and this interaction was responsible for the NLRX1-mediated inhibition of invasion and autophagic processes including autophagosome and autolysosome formation during GAS infection. These findings demonstrate that NLRX1 functions as a negative regulator to inactivate the Beclin 1-UVRAG complex, which regulates invasion and autophagy during GAS infection. Thus, our study expands our knowledge of the role of NLRX1 during bacterial invasion and autophagy and could lead to further investigations to understand pathogen-host cell interactions, facilitating novel targeted therapeutics.

Keywords: Beclin 1; Group A Streptococcus; NLRX1; UVRAG; autophagy; bacterial invasion.


Figures

Figure 1
Figure 1
NLRX1 inhibits endocytosis-mediated Group A Streptococcus (GAS) invasion. (A,B) Adherence (A) and invasion (B) rates of GAS. HeLa wild-type and NLRX1 KO cells were infected with GAS (MOI = 100). After 30 or 60 min of infection, cells were washed with PBS and further incubated for 60 min with DMEM/10% FCS with gentamicin (100 μg/mL) to kill extracellular bacteria. Cells were disrupted with distilled water and serial dilutions of cellular extracts were plated on THY agar plates; colony counting was then performed. The data presents the invasion rate as the ratio of total intracellular GAS 120 min after infection to total adherent GAS at 30 or 60 min after infection. Data are representative of ≥ three independent experiments. **P < 0.01. (C) Representative immunofluorescence image used for quantification of GAS invasion in (D). Extracellular/cell-associated GAS (orange) and intracellular GAS (red) were differentiated by staining with different Alexa-Fluor-conjugated GAS antibodies. GAS stained both orange and red were scored as invading bacteria (white arrow). (D) Quantification of GAS invasion into NLRX1 KO cells. Data were obtained by scoring at least 300 bacteria chains. Data are representative of ≥ three independent experiments. *P < 0.05. (E,G) Confocal microscopic images of EEA1 (E)- or Rab7 (G)-positive compartments containing GAS in HeLa wild-type and NLRX1 KO cells. Cells were transfected with EmGFP-Rab7, or immunostained with an anti-EEA1 antibody to visualize each endosomal marker. Cellular and bacterial DNA was stained with DAPI (blue). White arrowheads show EEA1- or Rab7-positive compartments containing GAS. Scale bars, 10 μm. (F,H) The number of cells containing EEA1- or Rab7-positive GAS was counted and presented as the percentage of the total number of GAS-infected cells. HeLa wild-type and NLRX1 KO cells were infected with GAS for indicated times. The data shown represent results from > 200 infected cells and include the mean value ± SD from three independent experiments. **P < 0.01, *P < 0.05.
Figure 2
Figure 2
NLRX1 inhibits Group A Streptococcus (GAS)-induced autophagy. (A) Confocal micrographs of HeLa wild-type cells and NLRX1 KO cells transfected with EmGFP-LC3 and infected with GAS for the indicated times. Cellular and bacterial DNA was stained with DAPI. White arrowheads show GcAV-positive cells. Scale bars, 10 μm. (B) Quantification of the number of GcAV-positive HeLa wild-type and NLRX1 KO cells. Data are mean ± SD for 500 GAS-infected cells counted per each experiment (n = 3). **P < 0.01. (C) Confocal micrographs of HeLa wild-type and NLRX1 KO cells transfected with EmGFP-LC3 and infected with GAS for 120 min. Cells were stained with antibody against LAMP1 and then with Alexa 594-conjugated secondary antibody. Cellular and bacterial DNA was stained with DAPI. White arrowheads show LAMP1-positive GcAVs. Scale bars, 10 μm. (D) Co-localization rate of GcAVs with lysosomes in HeLa wild-type and NLRX1 KO cells at the indicated times after infection. Data are mean ± SD of 200 GAS-infected cells counted per each experiment (n = 3). **P < 0.01, *P < 0.05. (E) Rate of intracellular survival of GAS in HeLa wild-type and NLRX1 KO cells. Each cell type was infected with GAS, and the number of intracellular viable GAS bacteria was determined by colony counting and is presented as the ratio of intracellular live GAS at 240 min to intracellular GAS at 120 min. Data are representative of three independent experiments.
Figure 3
Figure 3
The NLRX1–Beclin 1–UVARAG complex regulates Group A Streptococcus (GAS) invasion by endocytosis. (A) NLRX1 interacts with the Beclin 1 complex. HeLa cells were transfected with EmGFP-empty vector or EmGFP-tagged Beclin 1 complex proteins (Beclin1, Vps34/PI3KC3, and Atg14) with FLAG-NLRX1. Similarly, cells were transfected with FLAG-empty vector or FLAG-tagged UVARG with EmGFP-NLRX1. Cell lysates were subjected to immunoprecipitations with anti-FLAG or—GFP (for UVRAG) antibody. The immunoprecipitated proteins and total cell lysates were analyzed by immunoblotting with anti-GFP or—FLAG (for UVRAG) antibody. (B,C) Invasion rate of GAS in HeLa wild-type, Beclin 1 KO, UVRAG KO, Rubicon KO, Vps34/PI3KC3 KD, and Atg14 KD cells. **P < 0.01. (D,F) Confocal microscopic images of EEA1 (D)- or Rab7 (F)-positive compartments containing GAS in HeLa wild-type, Beclin1, and UVRAG KO cells. Cells were transfected with EmGFP-Rab7, or immunostained with an anti-EEA1 antibody to visualize each endosomal marker. Cellular and bacterial DNA was stained with DAPI (blue). Scale bars, 10 μm. (E,G) The number of cells containing EEA1 (D)-, or Rab7 (F)-positive GAS were counted and presented as the percentage of the total number of GAS-infected cells. HeLa wild-type, Beclin 1, and UVRAG KO cells were infected with GAS for the indicated times. The data shown represent results from > 200 infected cells and indicate the mean value ± SD from three independent experiments. **P < 0.01.
Figure 4
Figure 4
The NLRX1–Beclin 1–UVARAG complex regulates Group A Streptococcus (GAS)-induced autophagy. (A) HeLa wild-type, Beclin 1, and UVRAG KO cells transfected with mCherry-Galectin3 were infected with GAS for 120 min. Cellular and bacterial DNA was stained with DAPI. White arrowheads show Galectin3-positive cells. Scale bars, 10 μm. (B) Quantification of the number of Galectin3-positive HeLa wild-type, Beclin 1, and UVRAG KO cells. Data are mean ± SD for 200 GAS-infected cells counted per each experiment (n = 3). *P < 0.05. (C) HeLa wild-type, Beclin 1, and UVRAG KO cells were infected with GAS for 120 min and stained with antibody to FK2 and then with Alexa 594-conjugated secondary antibody to visualize ubiquitin-positive GAS. Cellular and bacterial DNA was stained with DAPI. White arrowheads show FK2-positive GAS. Scale bars, 10 μm. (D) Quantification of the number of FK2-positive HeLa wild-type, Beclin 1, and UVRAG KO cells. Data are mean ± SD for 200 GAS-infected cells counted per each experiment (n = 3). *P < 0.05. (E) HeLa wild-type, Beclin 1, and UVRAG KO cells were transfected with EmGFP-LC3 and infected with GAS for 240 min; cells were stained with antibody against LAMP1 and then with Alexa 594-conjugated secondary antibody. Cellular and bacterial DNA was stained with DAPI. White arrowheads show LAMP1-positive GcAVs. Scale bars, 10 μm. (F) Quantification of the number of GcAV-positive HeLa wild-type, Beclin 1, and UVRAG KO cells. Data are mean ± SD for 500 GAS-infected cells counted per each experiment (n = 3). *P < 0.05. (G) Co-localization rate of GcAVs with lysosomes in HeLa wild-type, Beclin 1, and UVRAG KO cells at the indicated times after infection. Data are mean ± SD of 200 GAS-infected cells counted per each experiment (n = 3). **P < 0.01. (H) The rate of intracellular survival of GAS bacteria in HeLa wild-type, Beclin 1, and UVRAG KO cells. Each cell type was infected with GAS, and the number of intracellular viable GAS bacteria was determined by colony counting and is presented as the ratio of intracellular live GAS bacteria at 240 min to intracellular GAS bacteria at 120 min. Data are representative of three independent experiments.
Figure 5
Figure 5
The NACHT domain of NLRX1 interacts with Beclin 1 and is responsible for inhibition of invasion and autophagy during Group A Streptococcus (GAS) infection. (A) NLRX1 interacts with the Beclin 1 complex through its NACHT domain. HeLa cells were transfected with FLAG-empty vector or FLAG-tagged NLRX1 deletion mutants and EmGFP-Beclin 1, and subjected to immunoprecipitation with an anti-FLAG antibody. The immunoprecipitated proteins and total cell lysates were analyzed by immunoblotting with an anti-GFP antibody. (B) Invasion rate of GAS in HeLa wild-type and NLRX1 KO cells transfected with NLRX1 deletion mutants. **P < 0.01. (C) Confocal microscopic images of EEA1- or Rab7-positive compartments containing GAS in HeLa wild-type and NLRX1 KO cells transfected with NLRX1 deletion mutants. Cells were transfected with EmGFP-Rab7 or immunostained with an anti-EEA1 antibody. Cellular and bacterial DNA was stained with DAPI. Scale bars, 10 μm. (D,E) The number of cells containing EEA1-, or Rab7-positive GAS were counted and presented as the percentage of the total number of GAS-infected cells. HeLa wild-type and NLRX1 KO cells transfected with NLRX1 deletion mutants were infected with GAS. The data shown represent results from > 200 infected cells and indicate the mean value ± SD from three independent experiments. *P < 0.05. (F) HeLa wild-type or NLRX1 KO cells transfected with both EmGFP-LC3 and NLRX1 deletion mutants were infected with GAS for 240 min, and stained with an antibody against LAMP1 and then with an Alexa 594-conjugated secondary antibody. Cellular and bacterial DNA was stained with DAPI. Scale bars, 10 μm. (G) Quantification of the number of GcAV-positive HeLa wild-type cells and NLRX1 KO cells transfected with NLRX1 deletion mutants. Data are mean ± SD for 500 GAS-infected cells counted per each experiment (n = 3). *P < 0.05. (H) Colocalization rate of GcAVs with lysosomes in HeLa wild-type and NLRX1 KO cells transfected with NLRX1 deletion mutants. Data are mean ± SD of 200 GAS-infected cells counted per each experiment (n = 3). *P < 0.05. (I) The rate of intracellular survival of GAS in HeLa wild-type and NLRX1 KO cells transfected with NLRX1 deletion mutants. The number of intracellular viable GAS bacteria was determined by colony counting and is presented as the ratio of intracellular live GAS bacteria at 240 min to intracellular GAS bacteria at 120 min. Data are representative of three independent experiments.
Figure 6
Figure 6
Schematic diagram of the postulated inhibitory function of NLRX1 during invasion and autophagy upon Group A Streptococcus (GAS) infection.

Similar articles

Cited by

References

    1. Aikawa C., Nozawa T., Maruyama F., Tsumoto K., Hamada S., Nakagawa I. (2010). Reactive oxygen species induced by Streptococcus pyogenes invasion trigger apoptotic cell death in infected epithelial cells. Cell. Microbiol. 12, 814–830. 10.1111/j.1462-5822.2010.01435.x - DOI - PubMed
    1. Akira S., Uematsu S., Takeuchi O. (2006). Pathogen recognition and innate immunity. Cell 124, 783–801. 10.1016/j.cell.2006.02.015 - DOI - PubMed
    1. Cunningham M. W. (2000). Pathogenesis of group A streptococcal infections. Clin. Microbiol. Rev. 13, 470–511. 10.1128/CMR.13.3.470 - DOI - PMC - PubMed
    1. Deretic V., Saitoh T., Akira S. (2013). Autophagy in infection, inflammation and immunity. Nat. Rev. Immunol. 13, 722–737. 10.1038/nri3532 - DOI - PMC - PubMed
    1. Di Bartolomeo S., Corazzari M., Nazio F., Oliverio S., Lisi G., Antonioli M., et al. . (2010). The dynamic interaction of AMBRA1 with the dynein motor complex regulates mammalian autophagy. J. Cell Biol. 191, 155–168. 10.1083/jcb.201002100 - DOI - PMC - PubMed

Publication types

MeSH terms