. 2019 Feb;81(2):442-461.
doi: 10.3758/s13414-018-1612-x.

The attentional repulsion effect and relative size judgments

Affiliations

The attentional repulsion effect and relative size judgments

Francesca C Fortenbaugh et al. Atten Percept Psychophys. 2019 Feb.

Abstract

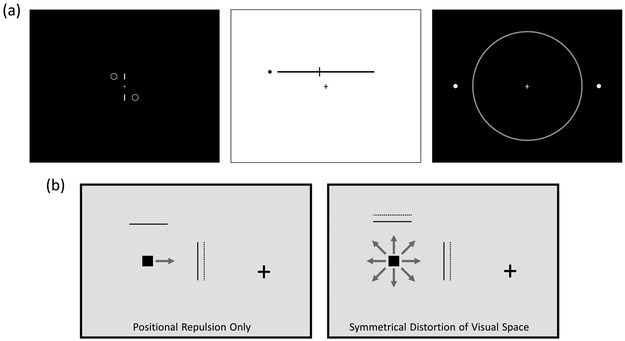
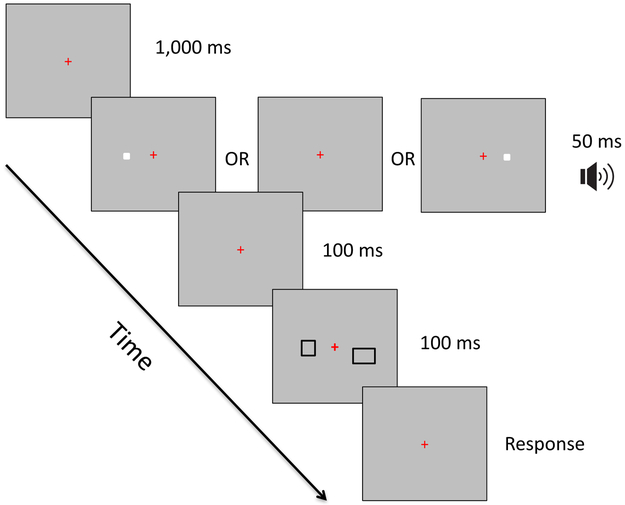
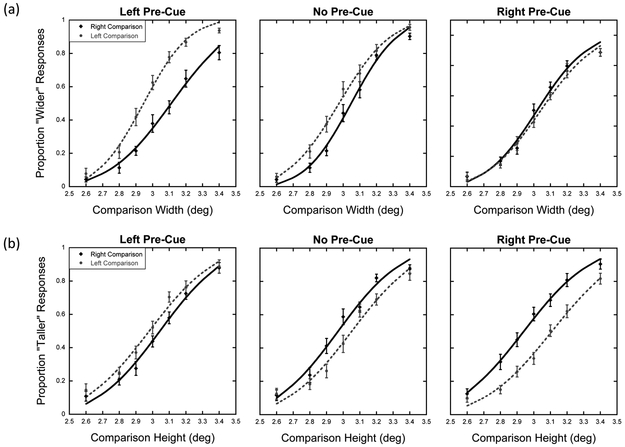
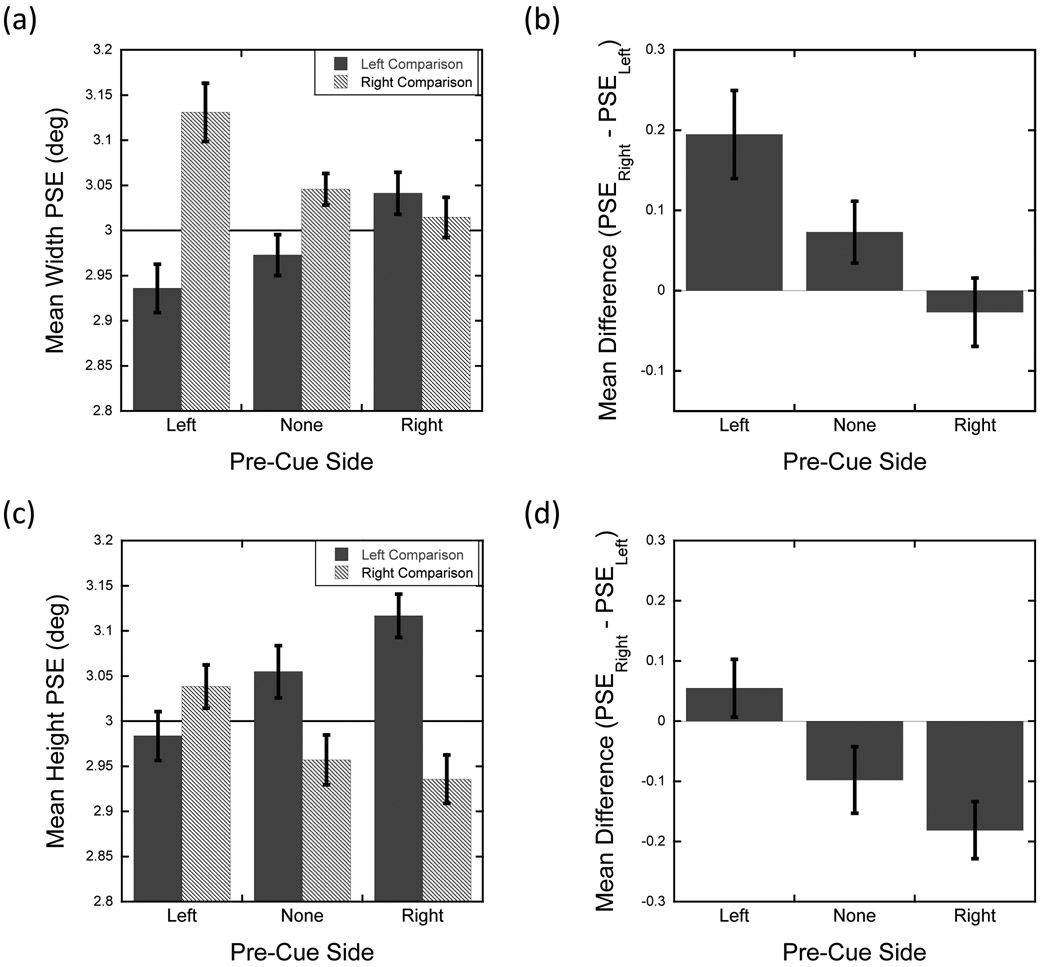
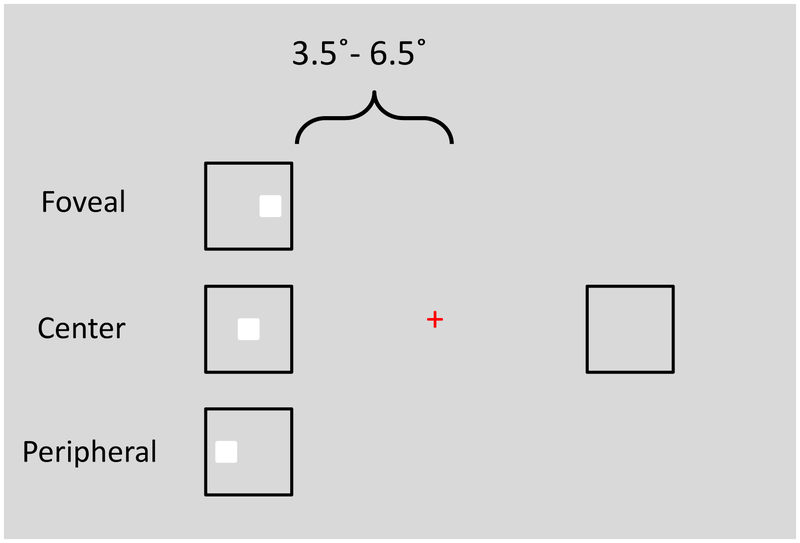
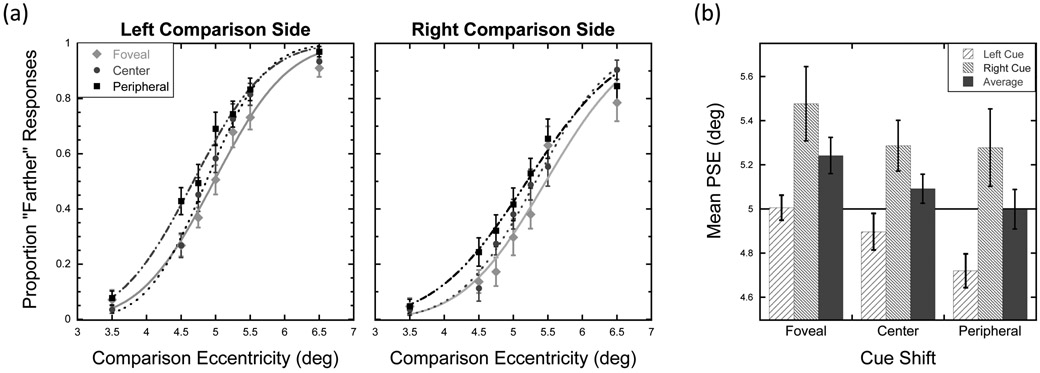
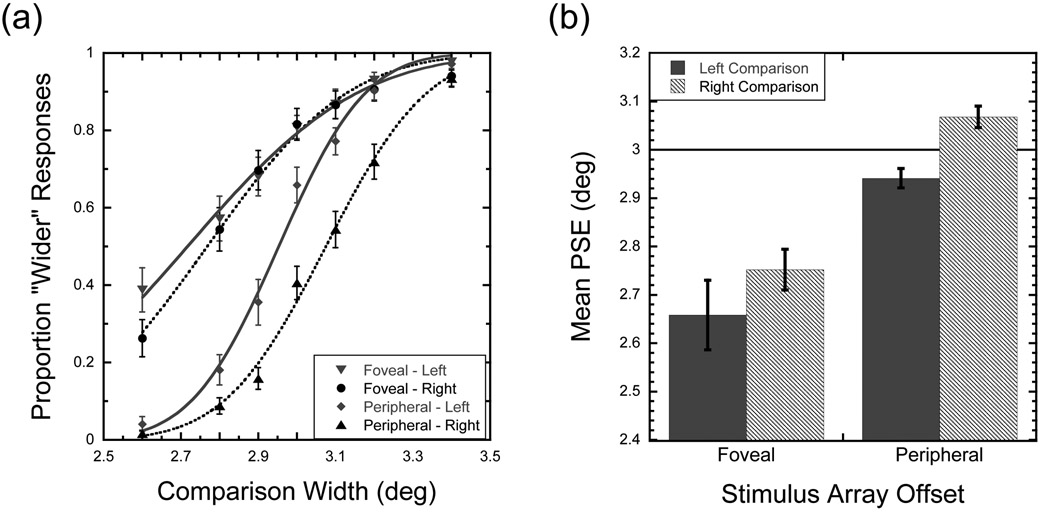
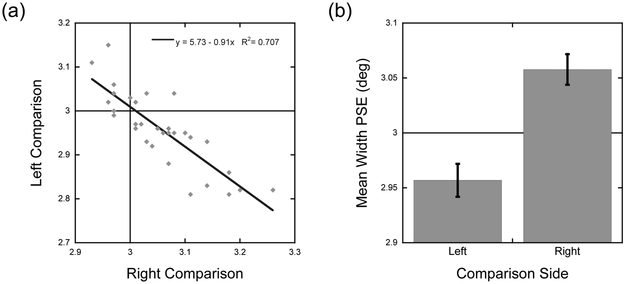
Rapid shifts of involuntary attention have been shown to induce mislocalizations of nearby objects. One pattern of mislocalization, termed the Attentional Repulsion Effect (ARE), occurs when the onset of peripheral pre-cues lead to perceived shifts of subsequently presented stimuli away from the cued location. While the standard ARE configuration utilizes vernier lines, to date, all previous ARE studies have only assessed distortions along one direction and tested one spatial dimension (i.e., position or shape). The present study assessed the magnitude of the ARE using a novel stimulus configuration. Across three experiments participants judged which of two rectangles on the left or right side of the display appeared wider or taller. Pre-cues were used in Experiments 1 and 2. Results show equivalent perceived expansions in the width and height of the pre-cued rectangle in addition to baseline asymmetries in left/right relative size under no-cue conditions. Altering cue locations led to shifts in the perceived location of the same rectangles, demonstrating distortions in perceived shape and location using the same stimuli and cues. Experiment 3 demonstrates that rectangles are perceived as larger in the periphery compared to fixation, suggesting that eye movements cannot account for results from Experiments 1 and 2. The results support the hypothesis that the ARE reflects a localized, symmetrical warping of visual space that impacts multiple aspects of spatial and object perception.

Keywords: Attentional repulsion effect; Exogenous attention; Involuntary attention; Pseudoneglect; Size perception; Visual space.


Figures

Figure 1.
Figure 1.
Schematics showing previous stimulus configurations used to study the Attentional Repulsion Effect (ARE) and potential sources of distortion. (a) The left panel show the standard design developed by Suzuki and Cavanagh (1997) and used by most studies of the ARE, including Kosovicheva et al. (2010). The middle panel shows the design used by Toba et al. (2011) to study the impact of the black dot cues on the perceived midpoint of the line using the Landmark Task. The right panel shows the design used by Fortenbaugh et al. (2011) to study the impact of the white cue dots on the perceived shape of a single blue oval. These illustrations show the relative placements of the cues and targets and are not drawn to scale. (b) The panels show two potential patterns of distortions that could underlie the ARE effect. The repulsion only hypothesis (left panel) suggests that distortions in location only occur in the direction parallel to attentional shifts from fixation to the peripheral cue. In contrast, the symmetrical distortion of visual space hypothesis predicts a shift in perceived location radiating symmetrically out from the location of the cue. Here the cue is shown as the black square, the target object is shown as a solid black line and the perceived location of that target object is shown as a dotted line. The grey arrows indicate the direction of the distortion(s) in visual space.
Figure 2:
Figure 2:. Experimental design.
Schematic illustrating the time course of stimulus presentation during each trial and the three potential cue locations. Stimuli are not drawn to scale.
Figure 3:
Figure 3:. Experiment 1 group means.
Plots showing the mean proportion of time participants responded that the comparison rectangle was (a) wider or (b) taller than the standard rectangle for the seven comparison variants tested as function of which side the comparison was on (left/right) and the side that the pre-cue was tested on. Curves show the best fitting cumulative Gaussian function for the group means. Error bars show ±1 S.E.M.
Figure 4:
Figure 4:. Experiment 1 point of subjective equality.
(a, c) Bar graphs showing the mean horizontal (a) and vertical (c) PSE for the comparison rectangle as a function of pre-cue side and the relative side of the comparison rectangle. The solid horizontal lines show the expected PSE if no distortion were present given that the standard rectangle always had a width/height of 3.0°. (b, d) Bar graphs showing the change in PSE for the comparison rectangle when it was presented on the right side compared to the left side for each of the three cue conditions. The magnitude of the ARE is the shift from the No Pre-Cue condition to the other two bars. All error bars show ±1S.E.M.
Figure 5.
Figure 5.
Schematic of Experiment 2 illustrating the three relative cue locations within the comparison rectangle. The comparison rectangle was horizontally offset from fixation at one of seven eccentricities while the standard rectangle’s position was fixed with the inner edge at 5˚ eccentricity. Stimulus presentation timing was the same as Experiment 1.
Figure 6:
Figure 6:. Experiment 2 group means and points of subjective equality.
(a) Plots show the mean proportion of time participants responded that the comparison rectangle was farther from fixation than the standard rectangle for the seven comparison offsets tested as a function of which side the comparison rectangle was on (left/right) and the location of the cue (foveal/center/peripheral). Curves show the best fitting cumulative Gaussian function for the group means. (b) Bar graph showing the mean PSE for the comparison rectangle as a function of cue location and the relative side of the comparison rectangle. The average PSE collapsed across comparison side is also shown. The solid horizontal line show the expected PSE if no distortion were present given that the standard rectangle was always offset from fixation by 5.0°. All error bars show ±1 S.E.M.
Figure 7:
Figure 7:. Experiment 3 group means and PSE.
(a) Plot shows the mean proportion of time participants responded that the comparison rectangle was wider than the standard rectangle at the seven comparison widths. Width means were tested as a function of which side the comparison rectangle was located (left/right) and the trial stimulus array offset position (foveal/peripheral). Curves show the best fitting cumulative Gaussian function for the group means. (b) Bar graph showing the mean PSE for the comparison rectangle width as a function of comparison rectangle location and the stimulus array offset position (i.e., position of the standard rectangle at fixation or periphery). The solid horizontal line show the expected PSE if no distortion were present given that the standard rectangle always had a width of 3.0°. All error bars show ± 1 S.E.M.
Figure 8:
Figure 8:. Left-right size asymmetry in perceived width for the no-cue conditions collapsed across Experiments 1 & 3.
(a) Scatterplot shows the PSE for the left comparison rectangle as a function of the corresponding PSE of the right comparison rectangle. Each diamond represents a single participant. (b) Bar graph shows the mean PSE for the comparison rectangle width as a function of comparison side (left/right) across all participants. The solid horizontal line at 3.0˚ show the expected PSE if no distortion were present. Error bars show ±1 S.E.M.

Similar articles

Cited by

References

    1. Abrams J, Nizam A, & Carrasco M (2012). Isoeccentric locations are not equivalent: The extent of the vertical meridian asymmetry. Vision Research, 52(1), 70–78. doi:10.1016/j.visres.2011.10.016 - DOI - PMC - PubMed
    1. Anderson B (2011). There is no such thing as attention. Frontiers in Psychology, 2, 246. doi:10.3389/fpsyg.2011.00246 - DOI - PMC - PubMed
    1. Anton-Erxleben K, & Carrasco M (2013). Attentional enhancement of spatial resolution: linking behavioural and neurophysiological evidence. Natural Reviews Neuroscience, 14, 188–200. - PMC - PubMed
    1. Anton-Erxleben K, Henrich C, & Treue S (2007). Attention changes perceived size of moving visual patterns. Journal of Vision, 7(11), 5, 1-9. doi:10.1167/7.11.5 - DOI - PubMed
    1. Baldwin J, Burleigh A, Pepperell R, & Ruta N (2016). The perceived size and shape of objects in peripheral vision. i-Perception, 7(4), 2041669516661900. - PMC - PubMed

LinkOut - more resources