

Income-Related Gaps in Early Child Cognitive Development: Why Are They Larger in the United States Than in the United Kingdom, Australia, and Canada?
- PMID: 30488261
- PMCID: PMC6513808
- DOI: 10.1007/s13524-018-0738-8
Income-Related Gaps in Early Child Cognitive Development: Why Are They Larger in the United States Than in the United Kingdom, Australia, and Canada?
Abstract
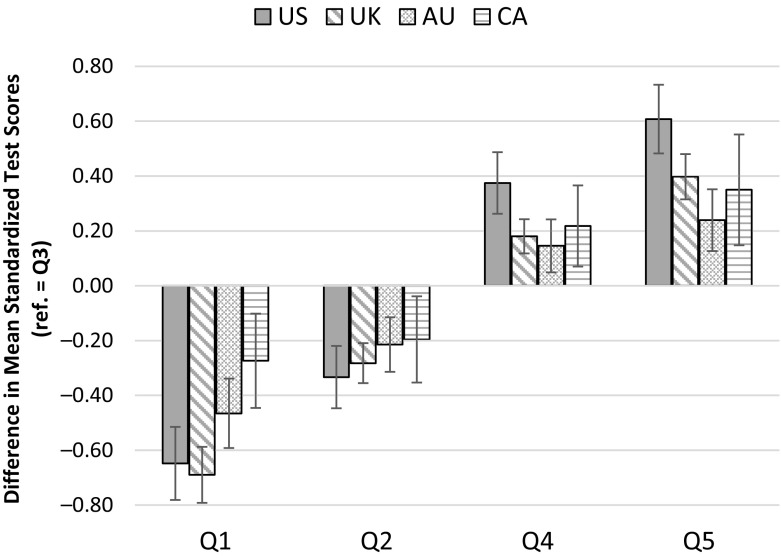
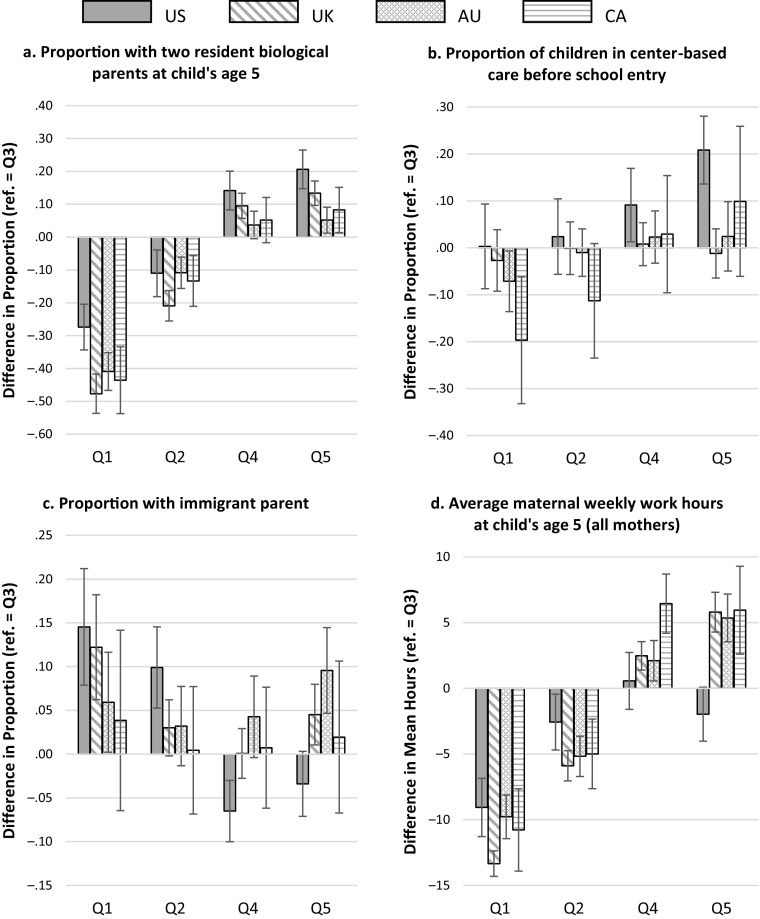
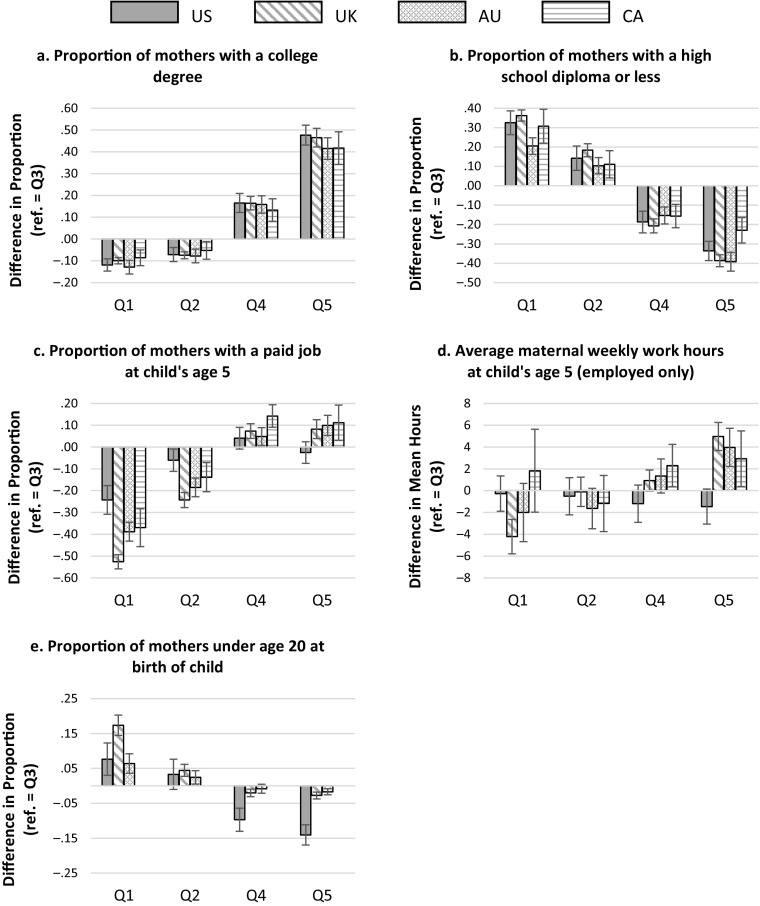
Previous research has documented significantly larger income-related gaps in children's early cognitive development in the United States than in the United Kingdom, Canada, and Australia. In this study, we investigate the extent to which this is a result of a more unequal income distribution in the United States. We show that although incomes are more unequal in the United States than elsewhere, a given difference in real income is associated with larger gaps in child test scores there than in the three other countries. In particular, high-income families in the United States appear to translate the same amount of financial resources into greater cognitive advantages relative to the middle-income group than those in the other countries studied. We compare inequalities in other kinds of family characteristics and show that higher income levels are disproportionately concentrated among families with advantageous demographic characteristics in the United States. Our results underline the fact that the same degree of income inequality can translate into different disparities in child development, depending on the distribution of other family resources.
Keywords: Child development; Cross-national; Parental income; School readiness; Social mobility.
Figures
References
-
- Almond D, Currie J. Human capital development before age five. In: Ashenfelter O, Card D, editors. Handbook of labor economics. Amsterdam, The Netherlands: North Holland; 2011. pp. 1315–1486.
-
- Australian Institute of Family Studies (AIFS) Longitudinal study of Australian children: Data user guide—August 2013. Melbourne, AU: AIFS; 2013.
-
- Bailey MJ, Dynarski SM. Gains and gaps: Changing inequality in U.S. college entry and completion (NBER Working Paper No. 17633) Cambridge, MA: National Bureau of Economic Research; 2011.
-
- Björklund A, Jäntti M. Intergenerational income mobility and the role of family background. In: Salverda W, Nolan B, Smeeding TM, editors. The Oxford handbook of economic inequality. Oxford, UK: Oxford University Press; 2009. pp. 491–521.
Publication types
MeSH terms
Grants and funding
LinkOut - more resources
Full Text Sources
Medical
