. 2019 Mar;58(3):411-425.
doi: 10.1002/mc.22938. Epub 2018 Nov 28.

Lymphotoxin-β receptor-NIK signaling induces alternative RELB/NF-κB2 activation to promote metastatic gene expression and cell migration in head and neck cancer

Affiliations

Lymphotoxin-β receptor-NIK signaling induces alternative RELB/NF-κB2 activation to promote metastatic gene expression and cell migration in head and neck cancer

Rita Das et al. Mol Carcinog. 2019 Mar.

Abstract

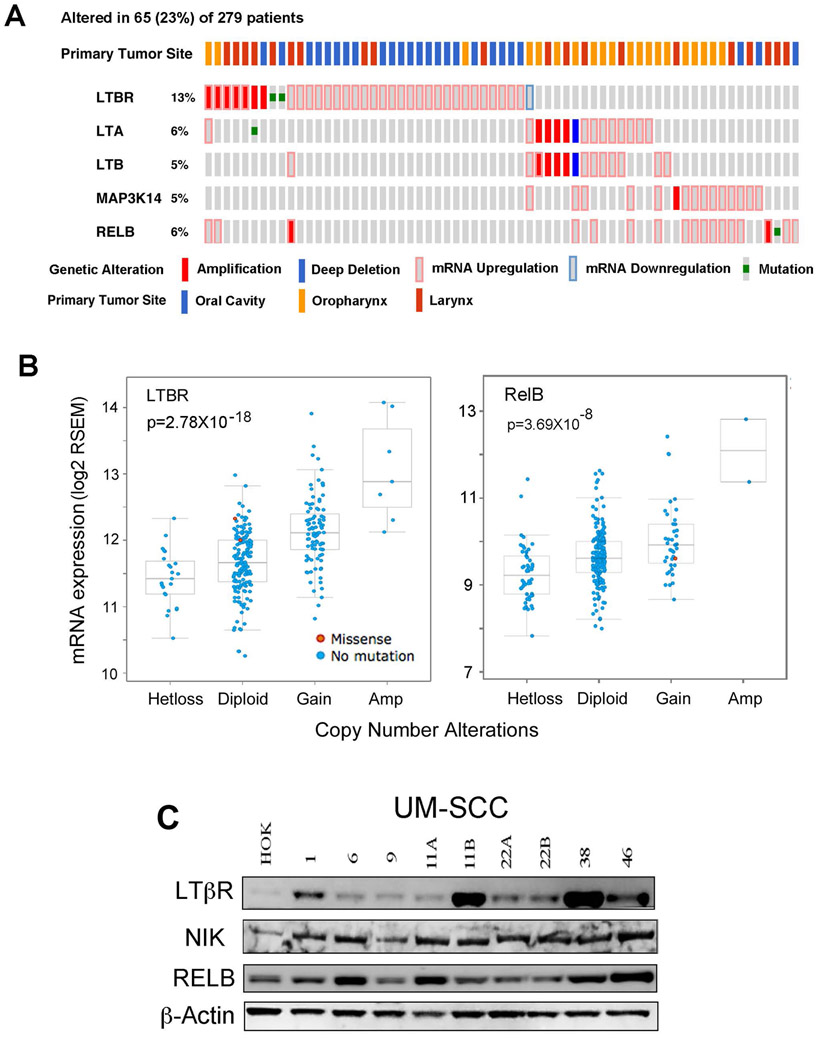
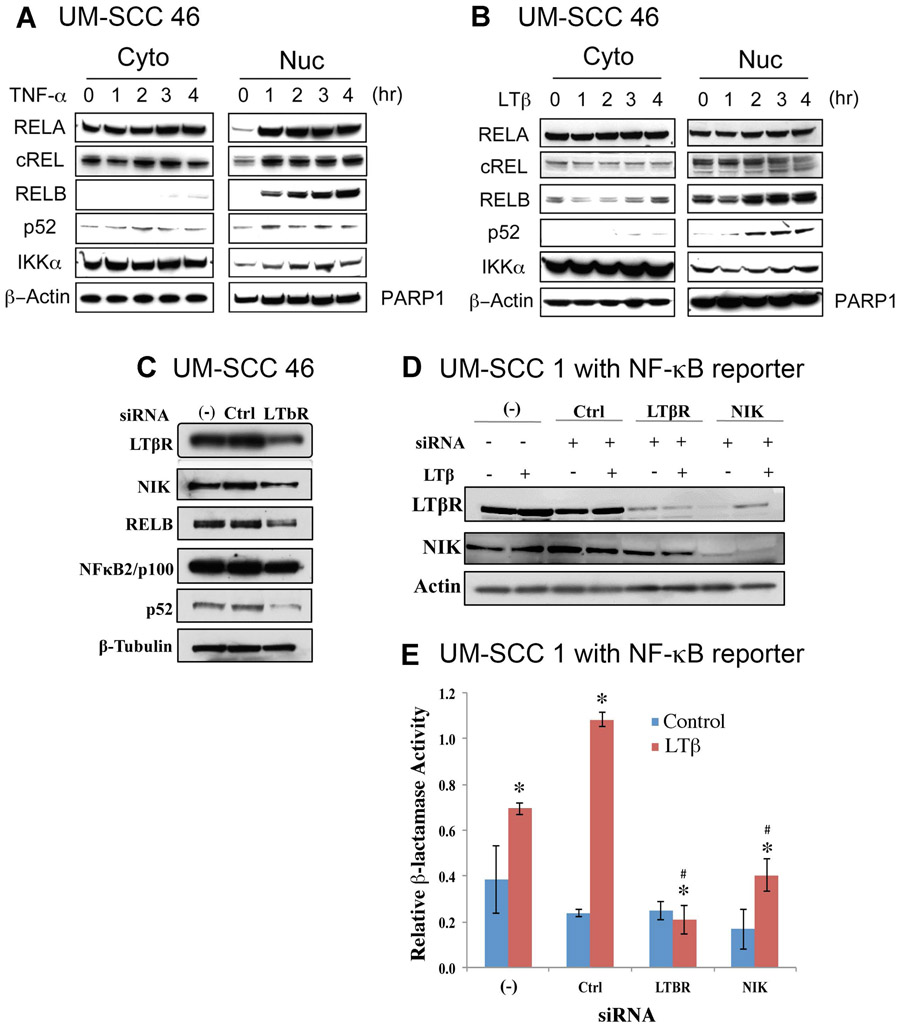
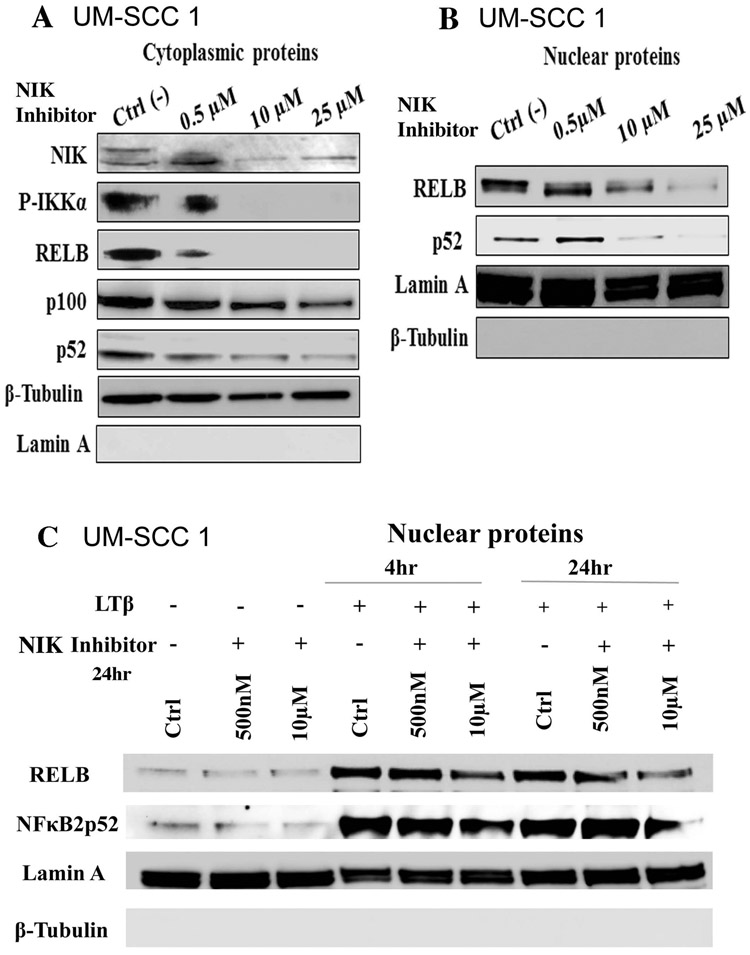
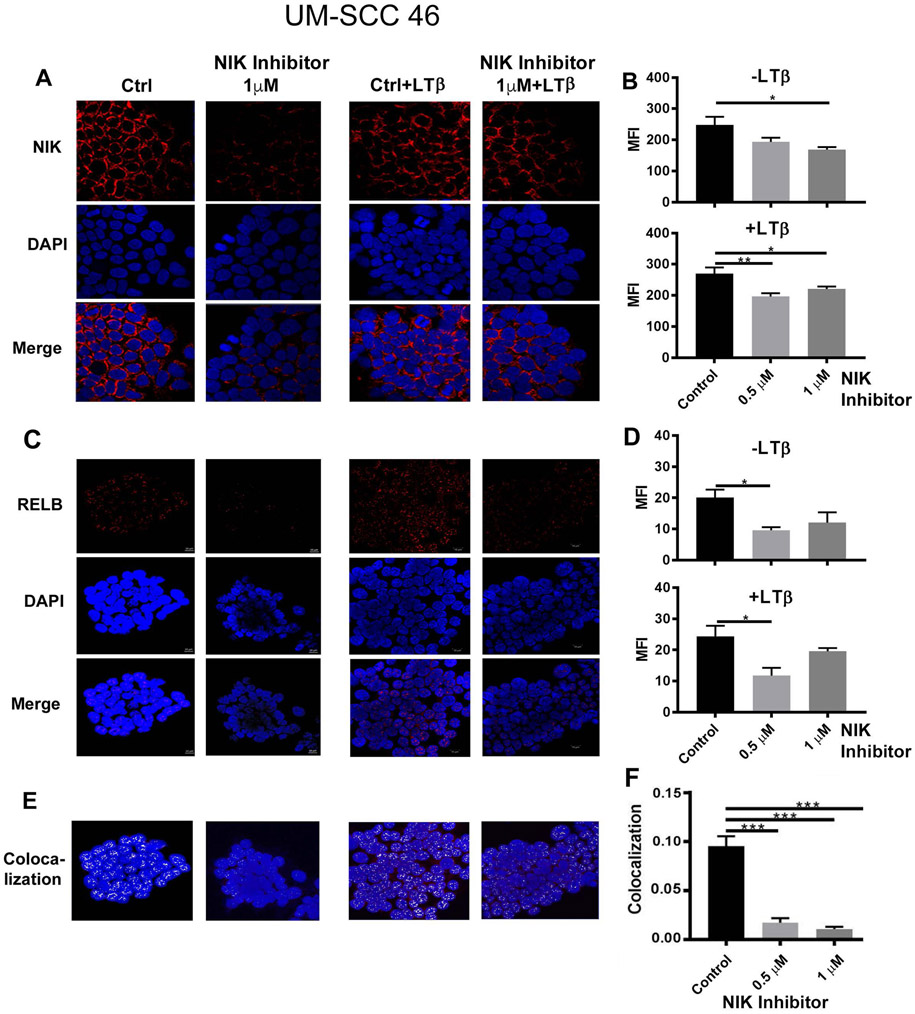
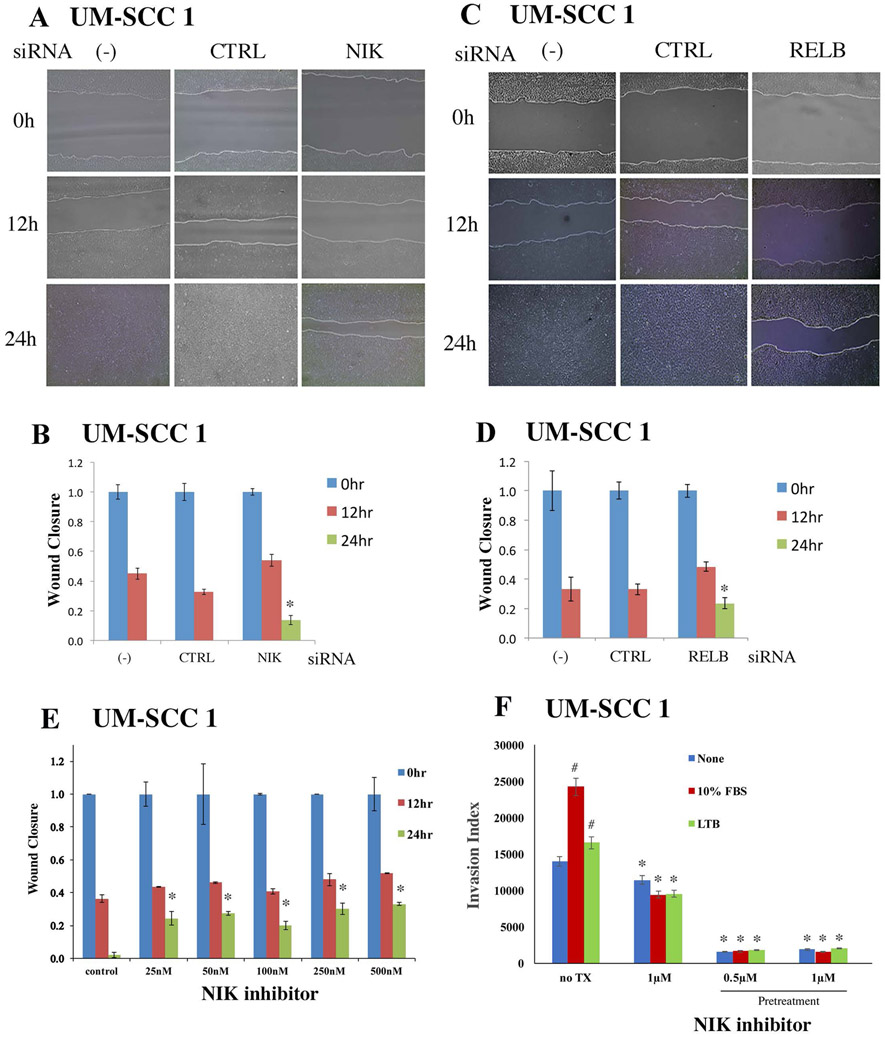
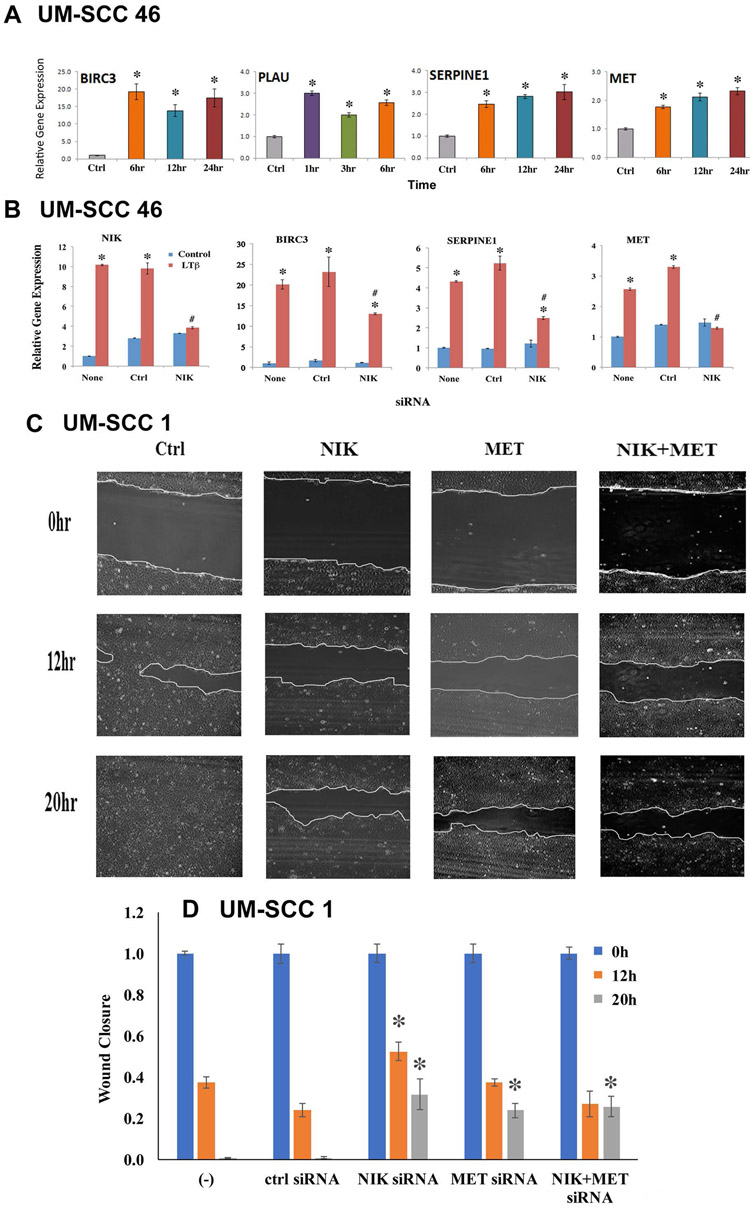
Head and neck squamous cell carcinomas (HNSCC) preferentially spread to regional cervical tissues and lymph nodes. Here, we hypothesized that lymphotoxin-β (LTβ), receptor LTβR, and NF-κB-inducing kinase (NIK), promote the aberrant activation of alternative NF-κB2/RELB pathway and genes, that enhance migration and invasion of HNSCC. Genomic and expression alterations of the alternative NF-kB pathway were examined in 279 HNSCC tumors from The Cancer Genome Atlas (TCGA) and a panel of HNSCC lines. LTβR is amplified or overexpressed in HNSCC of the larynx or oral cavity, while LTβ, NIK, and RELB are overexpressed in cancers arising within lymphoid oropharyngeal and tonsillar sites. Similarly, subsets of HNSCC lines displayed overexpression of LTβR, NIK, and RELB proteins. Recombinant LTβ, and siRNA depletion of endogenous LTβR and NIK, modulated expression of LTβR, NIK, and nuclear translocation of NF-κB2(p52)/RELB as well as functional NF-κB promoter reporter activity. Treatment with a NIK inhibitor (1,3[2H,4H]-Iso-Quinoline Dione) reduced the protein expression of NIK and NF-κB2(p52)/RELB, and blocked LTβ induced nuclear translocation of RELB. NIK and RELB siRNA knockdown or NIK inhibitor slowed HNSCC migration or invation in vitro. LTβ-induces expression of migration and metastasis related genes, including hepatocyte growth/scatter factor receptor MET. Knockdown of NIK or MET similarly inhibited the migration of HNSCC cell lines. This may help explain why HNSCC preferentially migrate to local lymph nodes, where LTβ is expressed. Our findings show that LTβ/LTβR promotes activation of the alternative NIK-NF-κB2/RELB pathway to enhance MET-mediated cell migration in HNSCC, which could be potential therapeutic targets in HNSCC.

Keywords: HNSCC; LTβ/LTβ receptor; NIK; RELB/NF-κB2; migration.


Conflict of interest statement

Conflict of Interest Statement: The authors have declared that no conflict of interest exists.

Figures

Figure 1.
Figure 1.. The genetic and expression alterations of LTB/and LTBR, NIK (MAP3K14), and RELB in HNSCC tissues and cell lines.
Data of genetic and expression alterations were extracted from TCGA HNSCC project through cbioportal. (A) Oncoprint presents individual cases (each bar) with genetic and expression alterations of LTBR, LTA, LTB, MAP3K14, RELB. 65 (23%) cases with genetic and/or expression alterations were shown. Genetic and expression alterations are presented as solid red: homozygous amplification; solid blue, homozygous deletion; green: mutation; grey bar with blue frame: mRNA down-regulation compared with tumor mean; grey bar with pink frame: mRNA up-regulation compared with tumor mean. Primary tumor sites are indicated at the top, blue: oral cavity; orange: oropharynx; red: Larynx. % on the left represents the percentage of cases with alterations. (B) RNA expression and DNA copy number variation (CNV) were correlated and presented. The statistical correlation of RNA expression with CNV was examined and presented as p value. The X-axis showed DNA CNV, as Hetloss (shallow deletion), Diploid (normal), Gain (one copy gain), and AMP (amplification of two copies or higher). Y-axis is mRNA expression and presented as log2 RSEM (RNA-Seq by Expectation-Maximization). Mutation status, blue: no mutation; red: missense mutation. The relationship between CNV and RNA expression is tested by Pearson correlation. (C) Protein expression of LTβR, NIK and RELB in whole cell lysates from a panel of UM-SCC lines and HOK cells were detected by Western blot, using β-actin as a loading control.
Figure 2.
Figure 2.. TNF-α and LTB stimulated and LTβR and NIK knocking down inhibited NF-κB proteins and function activity in HNSCC cell line.
The HNSCC cell line UM-SCC 46 was treated with TNFα (25ng/ml, A) or LTβ (100ng/ml, B), and the protein levels of NF-κB subunits were measured at different time points via Western blot. β-actin was used as a loading control for the cytoplasmic fraction, and PARP1 for the nuclear fraction. (C) Knockdown of LTβR modulated its target kinase NIK, RELB, NF-κB2/p100/p52 protein expression in UM-SCC-46 cells. Cells were transfected with LTβR siRNA, whole cell lysates were harvested 96h after transfection, and measured for LTβR, NIK, RELB and NF-κB2/p100/p52 by Western blot. β-tubulin was used as loading control. (D) Protein expression of LTβR and NIK after knockdown of LTBR and NIK by siRNAs in stable NF-κB Blazer Reporter UM-SCC-1 stable cell line. Whole cell lysates were harvested by sonication of samples from each well of the β-Lactamase assay plate. Western blot was performed and β-Actin was used as loading control. (E) Knockdown of LTBR and NIK by siRNAs affected NF-κB reporter function in NF-κB Blazer Reporter UM-SCC-1 stable cell line. Relative β-Lactamase units were measured after stimulation with LTβ (100ng/ml) for 24h before harvesting the cells at 96h. * indicates statistical significance induced by LTB treatment, and # indicates statistical significance after siRNA knockdown (p-value<0.05 by t-test). Data were calculated from triplicates of a representative experiment.
Figure 3.
Figure 3.. NIK Inhibitor (1, 3 [2H, 4H]-Isoquinolinedione) reduced expression and nuclear translocation of alternative NF-kB proteins.
The UM-SCC1 cells were treated with NIK inhibitor (1, 3 [2H, 4H]-Isoquinolinedione) at the concentration of 500nM, 10μM, 25μM for 24h. Cells were fractionated into cytoplasmic (A) and nuclear fractions (B) and analyzed by Western blot. Lamin A (Nuclear) and β-tubulin (cytoplasm) were used as loading controls. (C) Cells were treated with NIK inhibitor at 500nM, 10μM, for 24h, followed with LTβ (100ng/ml) treatment for 4h and 24h. RELB and NF-κB2/p52 were examined in the nuclear protein fractions. Lamin A and β-tubulin were used as loading controls.
Figure 4.
Figure 4.. NIK stability in perinuclear cytoplasm and RELB nuclear localization are inhibited by NIK inhibitor 1, 3[2H, 4H]-Isoquinolinedione.
(A) UM-SCC-46 cells were pre-treated with NIK inhibitor at 1μM for 24h (left panels), and then stimulated with LTB for 4h (100ng/ml, right panels). Cells were stained with anti-NIK antibody (red) and DAPI for nuclear staining (blue). The images were captured by immunofluorescence microscopy. (B) The quantifications of the images were presented as before (upper panel) or after treatment (lower panel) with different doses of NIK inhibitors (0.5 and 1μM). (C) The images of RELB immunostaining were presented, the left panels showed cells treated with NIK inhibitor but without LTB stimulation. The right panels showed cells treated with NIK inhibitor plus LTB stimulation. (D) Quantification of the images presented in panel C. Upper panel is from the cells treated with NIK inhibitor but without LTB treatment (left panels in C). The low panel is the quantification of the images from the right panel of C. RELB co-localization with DAPI nuclear staining (E) and quantification (F). The photography was taken by confocal microscopy with 63X. Statistical analysis: Student T-test, *p<0.05, **p<0.01, ***p<0.001.
Figure 5.
Figure 5.. Knockdown of NIK or RELB by siRNAs or by NIK inhibitor inhibited migration of UM-SCC1 cells in vitro.
UM-SCC1 cells were transfected with siRNAs for NIK (A) or RELB (C) for 48h. Scratches were made on cell monolayers, and wound closure was monitored at 0, 12, and 24 h. (B, D) Quantification of wound healing from images was done using Image J program, and statistical significance was calculated. The distances between the wounds were measured, and significant differences by individual knockdowns were examined by t-test (*p <0.05). (E) UM-SCC1 cells were pretreated with the NIK inhibitor, and after 24h the cell monolayers were scratched and treated with the inhibitor. Wound closure was measured at 0h, 12h, and 24h from images using Image J program. * indicates a statistical significance when compared with controls (p-value <0.05 by t-test). (F) UM-SCC1 cells were starved in serum free media for 24hr, and plated in 100mm plates at 1x10⁶cells per plate, with or without NIK inhibitor pretreatment for 4hr. The cells were subjected to invasion assay in EC matrix coated chamber in serum free media with chemoattractant in the outer wells, either adding 10% fetal bovine serum (FBS, red bar) or LTB (green bar). The invasion index was measured and calculated following the manufacturer’s protocol. # indicated a statistical significance of FBS or LTB induced invasion, and *indicates the statistical significance of NIK inhibitor decreased cell invasion compared to the corresponding controls (p-value <0.05 by t-test).
Figure 6:
Figure 6:. LTβ, NIK, and MET modulated expression of survival and metastasis genes, and promoted cell migration.
(A) UM-SCC 46 cells were treated with LTβ (100ng/ml), and the relative mRNA expression of LTβ upregulated genes were examined by qRT-PCR at different time points. The data were compared with time 0 (no treatment), and calculated with three replicates as mean + SD. An asterisk indicates p-value <0.05 using t-test. (B) UM-SCC46 cells were transfected with 50nM NIK siRNA for 48h, mRNA expression of NIK, BIRC3, and SERPINE1, and MET were measured by qRT-PCR. Statistical significance differences were calculated with three replicates at *p ≤0.05 by t-test. (C) UM-SCC1 cells were transfected with NIK or MET siRNA alone, or in combination for 48h. Scratches were made on cell monolayers, wound closure was monitored at 0, 12 and 20h, and images were taken using EVOS microscope. (D) Quantification of wound healing with statistical significance. The distances between the wounds were measured, and significant differences were examined using image J. * indicates a statistical difference calculated with three replicates and shown with p-value <0.05 by t-test.

Similar articles

Cited by

References

    1. Rothenberg SM, Ellisen LW. The molecular pathogenesis of head and neck squamous cell carcinoma. Journal of Clinical Investigation. 2012;122(6):1951–7. - PMC - PubMed
    1. Siegel RL, Miller KD, Jemal A. Cancer statistics, 2016. CA Cancer J Clin. 2016. Jan-Feb;66(1):7–30. PubMed PMID: 26742998. - PubMed
    1. Leemans CR, Braakhuis BJ, Brakenhoff RH. The molecular biology of head and neck cancer. Nat Rev Cancer. 2011. January;11(1):9–22. PubMed PMID: 21160525. - PubMed
    1. Shang Xie HX, Shan Xiaofeng, Liu Baozhong, Wang Kan, Cai* Zhigang. Clinicopathological and prognostic significance of survivin expression in patients with oral squamous cell carcinoma: evidence from a meta-analysis. PLOS One. 2015; 10(2):0116517. PubMed PMID: 25710884. Pubmed Central PMCID: PMC4339736. - PMC - PubMed
    1. Bauer J NS, Reisinger F, Zoller J, Yuan D,Heikenwalder M. Lymphotoxin, NF-kB, and cancer: the dark side of cytokines. Dig Dis. 2012;30(5):453–68. PubMed PMID: 23108301. - PubMed

Publication types

MeSH terms