

Statistical methodology for constructing gestational age-related charts using cross-sectional and longitudinal data: The INTERGROWTH-21st project as a case study
- PMID: 30488491
- PMCID: PMC6767451
- DOI: 10.1002/sim.8018
Statistical methodology for constructing gestational age-related charts using cross-sectional and longitudinal data: The INTERGROWTH-21st project as a case study
Abstract
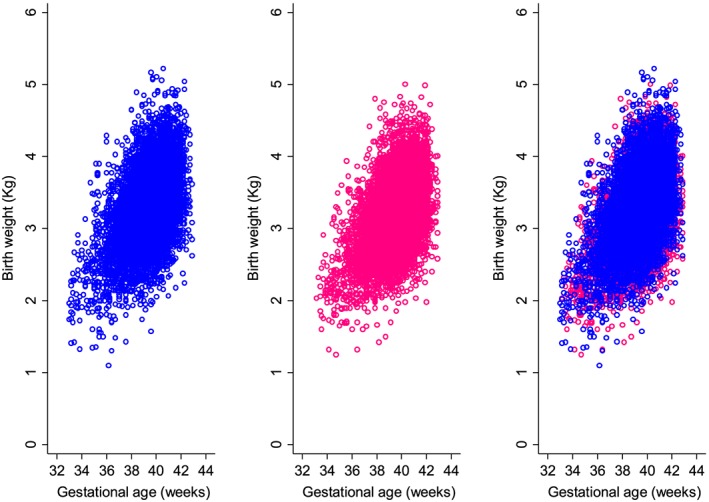
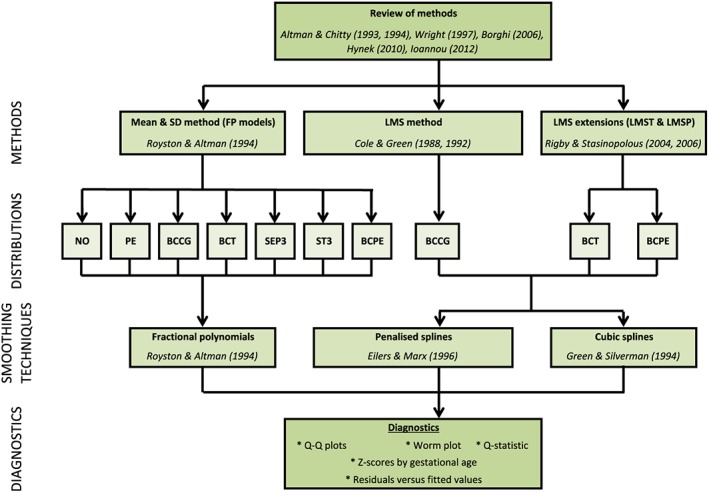
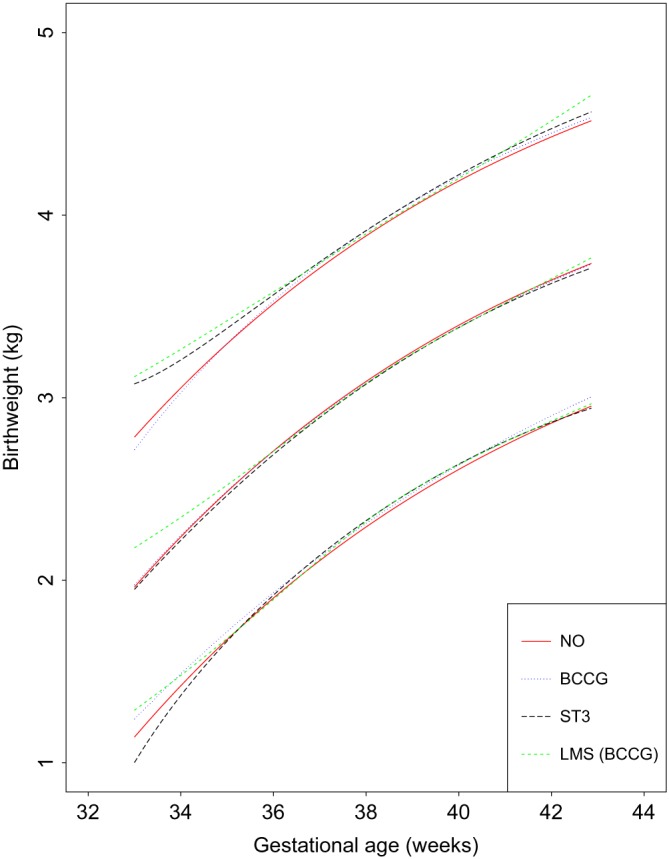
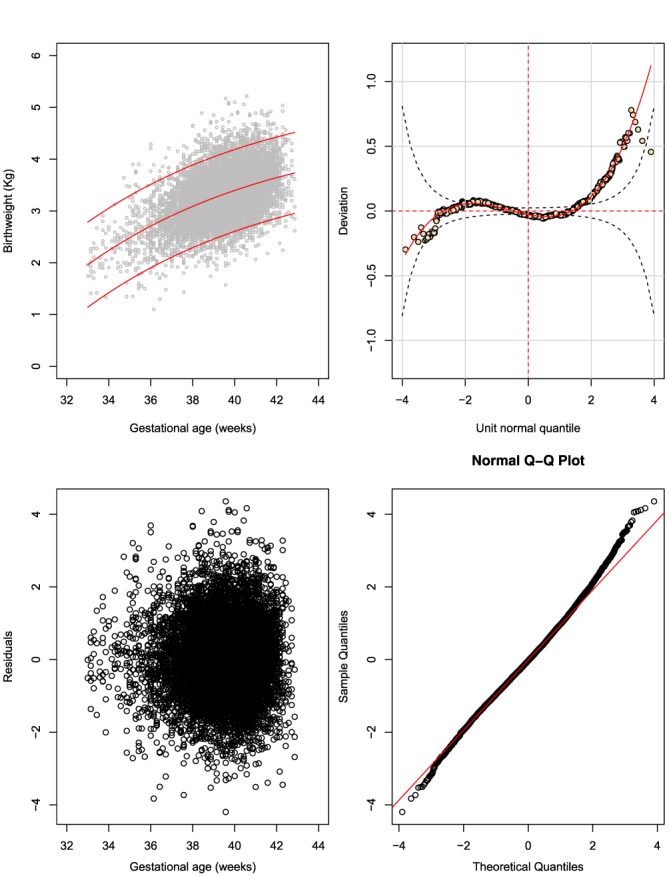
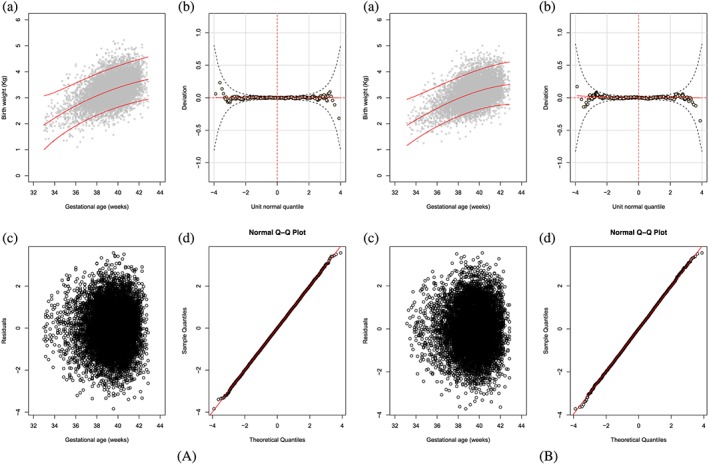
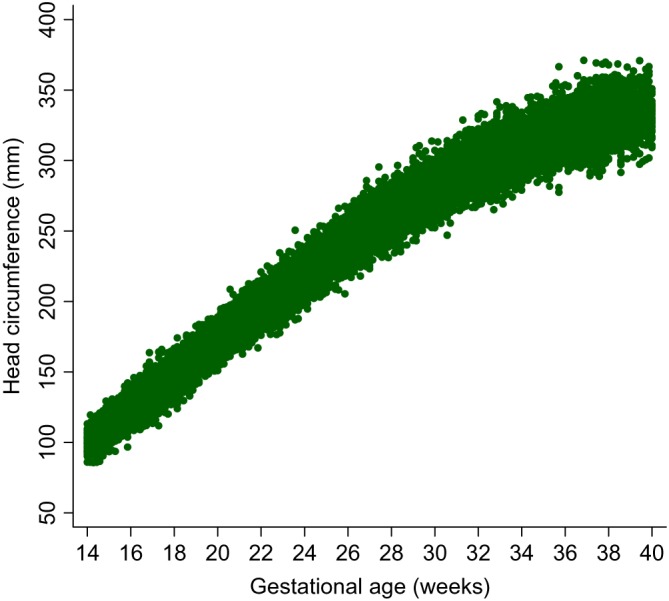
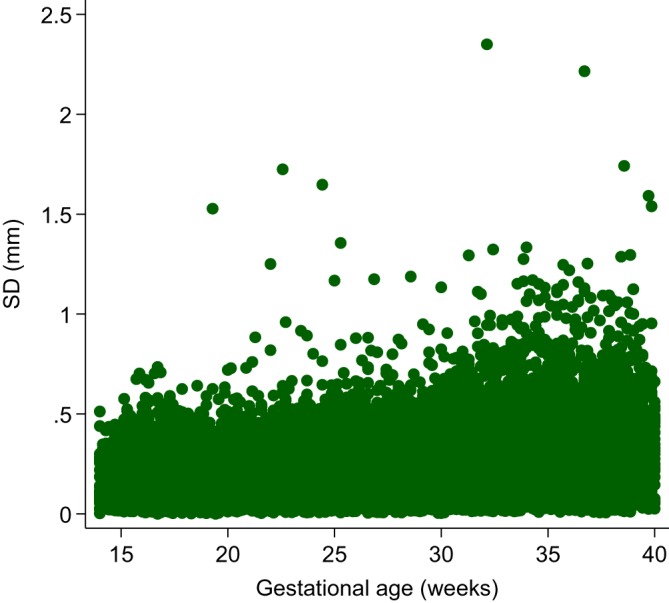
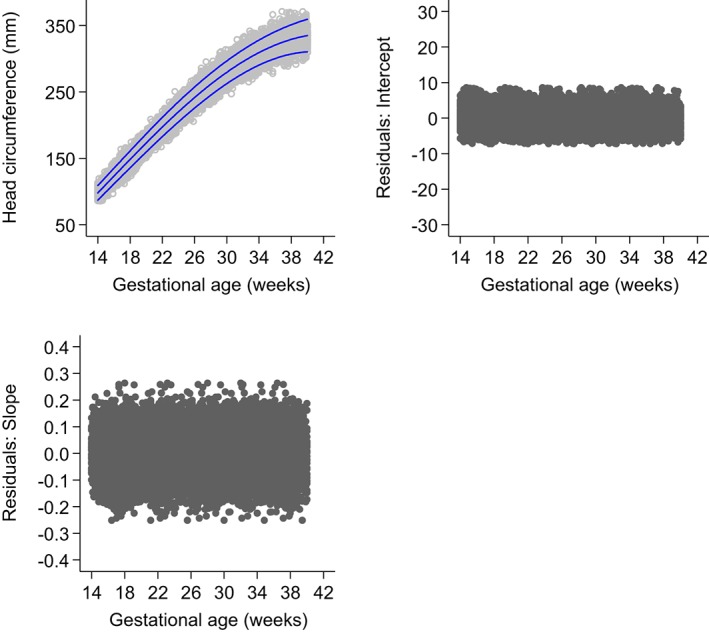
Most studies aiming to construct reference or standard charts use a cross-sectional design, collecting one measurement per participant. Reference or standard charts can also be constructed using a longitudinal design, collecting multiple measurements per participant. The choice of appropriate statistical methodology is important as inaccurate centiles resulting from inferior methods can lead to incorrect judgements about fetal or newborn size, resulting in suboptimal clinical care. Reference or standard centiles should ideally provide the best fit to the data, change smoothly with age (eg, gestational age), use as simple a statistical model as possible without compromising model fit, and allow the computation of Z-scores from centiles to simplify assessment of individuals and enable comparison with different populations. Significance testing and goodness-of-fit statistics are usually used to discriminate between models. However, these methods tend not to be useful when examining large data sets as very small differences are statistically significant even if the models are indistinguishable on actual centile plots. Choosing the best model from amongst many is therefore not trivial. Model choice should not be based on statistical considerations (or tests) alone as sometimes the best model may not necessarily offer the best fit to the raw data across gestational age. In this paper, we describe the most commonly applied methodologies available for the construction of age-specific reference or standard centiles for cross-sectional and longitudinal data: Fractional polynomial regression, LMS, LMST, LMSP, and multilevel regression methods. For illustration, we used data from the INTERGROWTH-21st Project, ie, newborn weight (cross-sectional) and fetal head circumference (longitudinal) data as examples.
Keywords: cross-sectional; human growth; longitudinal; statistical methodology.
© 2018 The Authors. Statistics in Medicine Published by John Wiley & Sons Ltd.
Conflict of interest statement
The authors declare that they have no competing interests.
Eric O. Ohuma performed the statistical analysis and wrote the manuscript. Douglas G. Altman read initial versions of the manuscript.
Eric O. Ohuma is a Senior Medical Statistician and Douglas G. Altman is Professor of Statistics in Medicine.
Figures
Comment in
-
Commentary: Methods for calculating growth trajectories and constructing growth centiles.Stat Med. 2019 Aug 30;38(19):3571-3579. doi: 10.1002/sim.8129. Stat Med. 2019. PMID: 31298428 Free PMC article.
-
Response to Professor Cole's commentary: Methods for calculating growth trajectories and constructing growth centiles.Stat Med. 2019 Aug 30;38(19):3580-3583. doi: 10.1002/sim.8128. Stat Med. 2019. PMID: 31298429 No abstract available.
References
Publication types
MeSH terms
Grants and funding
LinkOut - more resources
Full Text Sources
Other Literature Sources