. 2018 Nov;6(22):e13919.
doi: 10.14814/phy2.13919.

Obesity-induced reduction of adipose eosinophils is reversed with low-calorie dietary intervention

Affiliations

Obesity-induced reduction of adipose eosinophils is reversed with low-calorie dietary intervention

William Reid Bolus et al. Physiol Rep. 2018 Nov.

Abstract

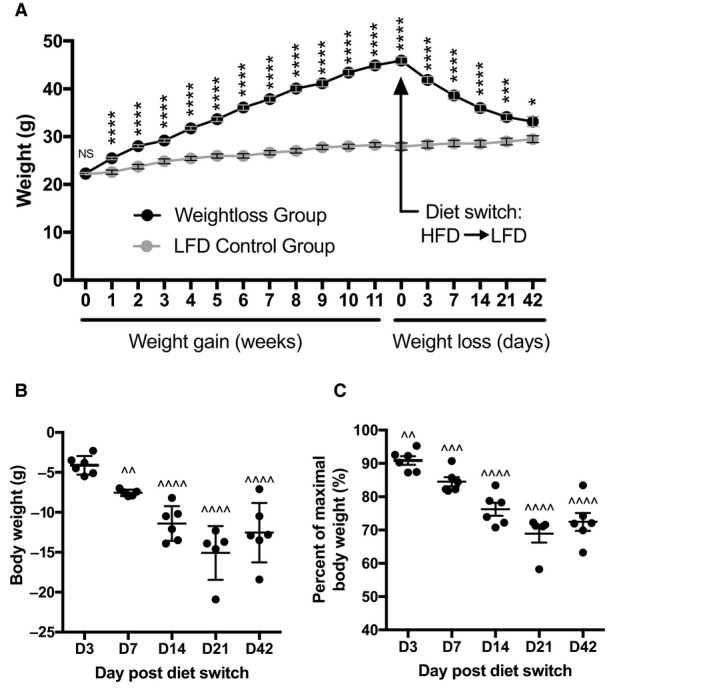
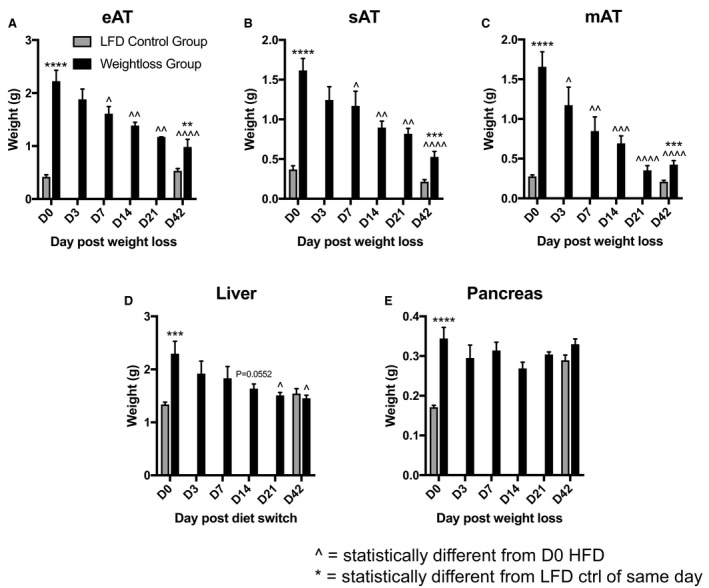
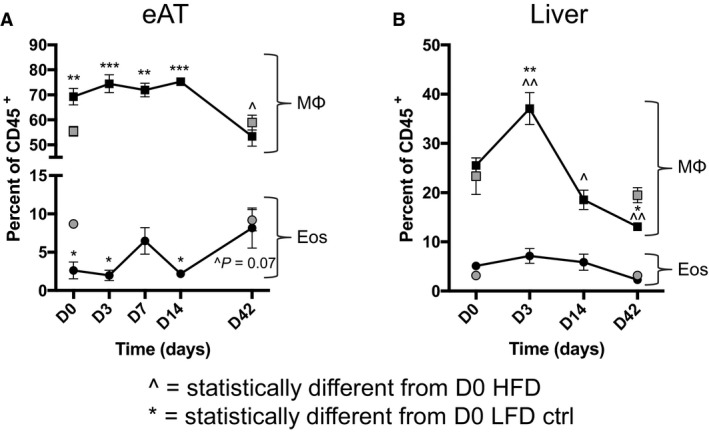
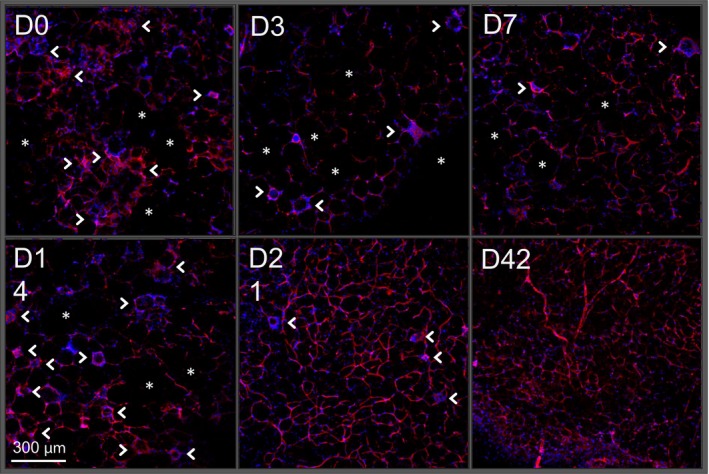
While many studies have characterized the inflammatory disposition of adipose tissue (AT) during obesity, far fewer have dissected how such inflammation resolves during the process of physiological weight loss. In addition, new immune cells, such as the eosinophil, have been discovered as part of the AT immune cell repertoire. We have therefore characterized how AT eosinophils, associated eosinophilic inflammation, and remodeling processes, fluctuate during a dietary intervention in obese mice. Similar to previous reports, we found that obesity induced by high-fat diet feeding reduced the AT eosinophil content. However, upon switching obese mice to a low fat diet, AT eosinophils were restored to lean levels as mice reached the body weight of controls. The rise in AT eosinophils during dietary weight loss was accompanied by reduced macrophage content and inflammatory expression, upregulated tissue remodeling factors, and a more uniformly distributed AT vascular network. Additionally, we show that eosinophils of another metabolically relevant tissue, the liver, did not oscillate with either dietary weight gain or weight loss. This study shows that eosinophil content is differentially regulated among tissues during the onset and resolution of obesity. Furthermore, AT eosinophils correlated with AT remodeling processes during weight loss and thus may play a role in reestablishing AT homeostasis.

Keywords: Adipose tissue; eosinophils; inflammation; macrophages; obesity; weight loss.


Figures

Figure 1
Figure 1
Weight loss study design and associated body weight parameters. (A) Body weight (g) of mice placed on high‐fat diet (HFD) (black circles) or control low fat diet (LFD) (gray circles) for 12 weeks, at which point HFD‐fed mice were switched to LFD (day 0); weights were also recorded at day 3, 7, 14, 21, & 42 postdiet switch. (B) Change in grams of body weight at each time point during low‐calorie dietary intervention compared to respective D0 weight. (C) The percent body weight at each time point postdietary intervention of maximal body weight gained immediately prior to LFD diet switch. Data are presented as mean ± SEM. Prior to weight loss, HFD and LFD groups had 36 and 18 mice/group, respectively. The HFD group decreased by six mice beginning at day 0 of diet switch, and at each subsequent day noted. The LFD control group had eight mice/group throughout weight loss of the HFD group. *P < 0.05; ***P < 0.001; ****P < 0.0001 compared to LFD control group. ^^P < 0.01; ^^^P < 0.001; ^^^^P < 0.0001 compared to respective HFD D0. T‐tests were used for all analysis.
Figure 2
Figure 2
Mass of tissues during low‐calorie dietary intervention. Total weight (g) of each tissue throughout diet‐induced weight loss (HFD→LFD) compared to LFD control, including (A) epididymal AT (eAT), (B) subcutaneous AT (sAT), (C) mesenteric AT (mAT), (D) liver, and (E) pancreas. Data are presented as mean ± SEM. LFD control = 8–9 mice/group; HFD = 4–6 mice/group. ***P < 0.001; ****P < 0.0001 compared to LFD control group. ^P < 0.05; ^^P < 0.01; ^^^P < 0.001; ^^^^P < 0.0001 compared to HFD D0. T‐tests were used to compare HFD to LFD groups. One‐way ANOVA was used to compare HFD D0 to all other HFD time points.
Figure 3
Figure 3
Variation in eosinophil and macrophage content during low‐calorie dietary intervention. Fluctuation in the percent of eosinophil and macrophage populations from mice undergoing dietary weight loss (black circles) compared to LFD controls (gray circles), in (A) eAT and (B) liver. Data are presented as mean ± SEM of 5–6 mice/group. *P < 0.05; **P < 0.01; ***P < 0.001 compared to D0 LFD control group. ^P < 0.05; ^^P < 0.01 compared to D0 HFD group. One‐way ANOVA was used to compare HFD D0 to all other HFD time points, as well as to compare LFD D0 to all HFD time points.
Figure 4
Figure 4
Inflammatory and tissue remodeling gene expression profile of adipose tissue during diet‐induced weight loss. (A–C) Eosinophil‐associated genes during dietary weight loss, including (A) Siglecf, (B) Prg2, (C) Ccr3. Macrophage marker (D) Emr1, proinflammatory macrophage markers (E) Tnfa and (F) Itgax and anti‐inflammatory macrophage marker (G) Arg1. Tissue remodeling factors (H) Mmp9, (I) Vegfa, and (J) Fgf2. Data are presented as mean ± SEM of 4–6 mice/group. *P < 0.05; **P < 0.01; ***P < 0.001 compared to D0 time point. One‐way ANOVA was used to compare HFD D0 to all other HFD time points.
Figure 5
Figure 5
Architectural transformation of adipose vasculature during dietary weight loss. Visualization of adipose vascular network by CD31 immunohistochemistry (red) beginning at the height of weight gain (D0) and continuing through the course of diet‐induced weight loss (D3‐D42). Nuclei are stained with DAPI (blue). Asterisks = areas devoid of vasculature. Arrowheads = crown‐like structures. Images are representative of 4–5 mice/group.

Similar articles

Cited by

References

    1. Amano, S. U. , Cohen J. L., Vangala P., Tencerova M., Nicoloro S. M., Yawe J. C., et al. 2014. Local proliferation of macrophages contributes to obesity‐associated adipose tissue inflammation. Cell Metab. 19:162–171. - PMC - PubMed
    1. van den Berg, S. M. , van Dam A. D., Kusters P. J. H., Beckers L., den Toom M., van der Velden S., et al. 2017. Helminth antigens counteract a rapid high‐fat diet‐induced decrease in adipose tissue eosinophils. J. Mol. Endocrinol. 59:245–255. - PubMed
    1. Bolus, W. R. , and Hasty A. H.. 2018. Contributions of Innate Type 2 Inflammation to Adipose Function. J. Lipid Res. 10.1194/jlr.R085993 - DOI - PMC - PubMed
    1. Bolus, W. R. , Gutierrez D. A., Kennedy A. J., Anderson‐Baucum E. K., and Hasty A. H.. 2015. CCR2 deficiency leads to increased eosinophils, alternative macrophage activation, and type 2 cytokine expression in adipose tissue. J. Leukoc. Biol. 98:467–477. - PMC - PubMed
    1. Bolus, W. R. , Peterson Kristin, Hubler Merla, Kennedy Arion J., Gruen Marnie, and Hasty Alyssa. 2017. Elevating adipose eosinophils in obese mice to physiologically normal levels does not rescue metabolic impairments. Mol. Metabol., In Revision. - PMC - PubMed