. 2019 Feb;18(1):e12873.
doi: 10.1111/acel.12873. Epub 2018 Nov 28.

Temporal and regional progression of Alzheimer's disease-like pathology in 3xTg-AD mice

Affiliations

Temporal and regional progression of Alzheimer's disease-like pathology in 3xTg-AD mice

Ramona Belfiore et al. Aging Cell. 2019 Feb.

Abstract

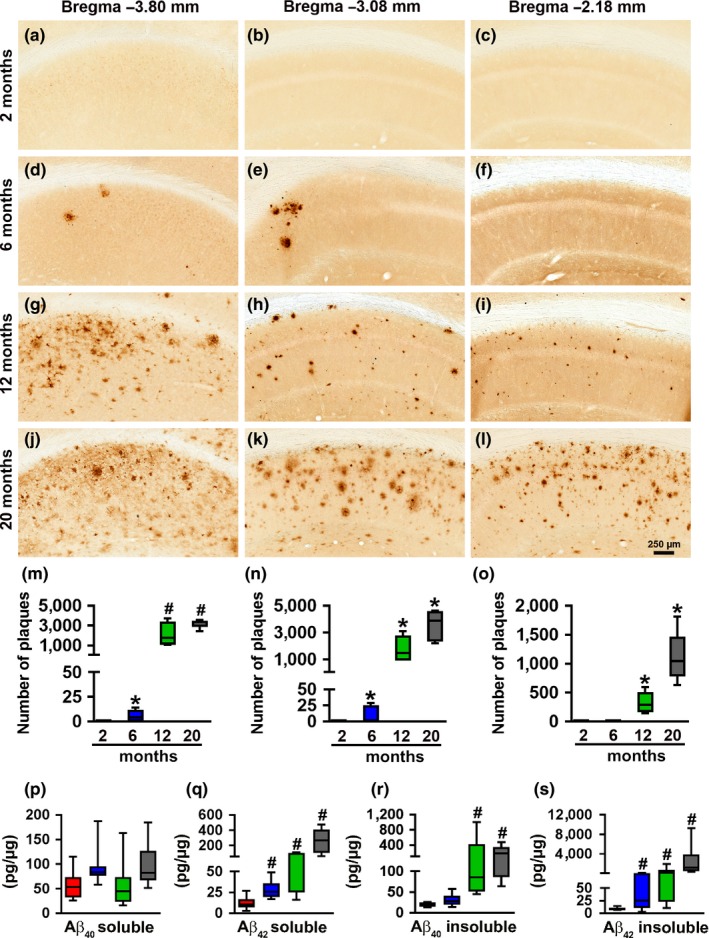
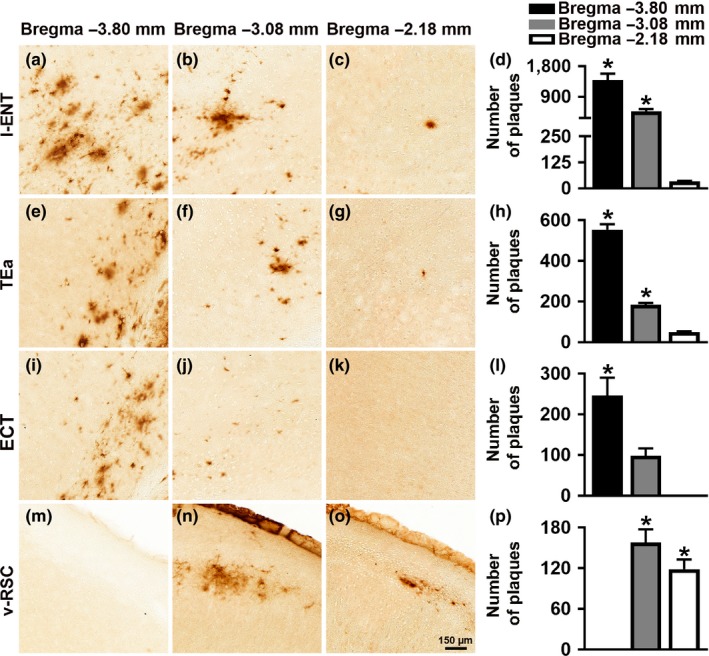
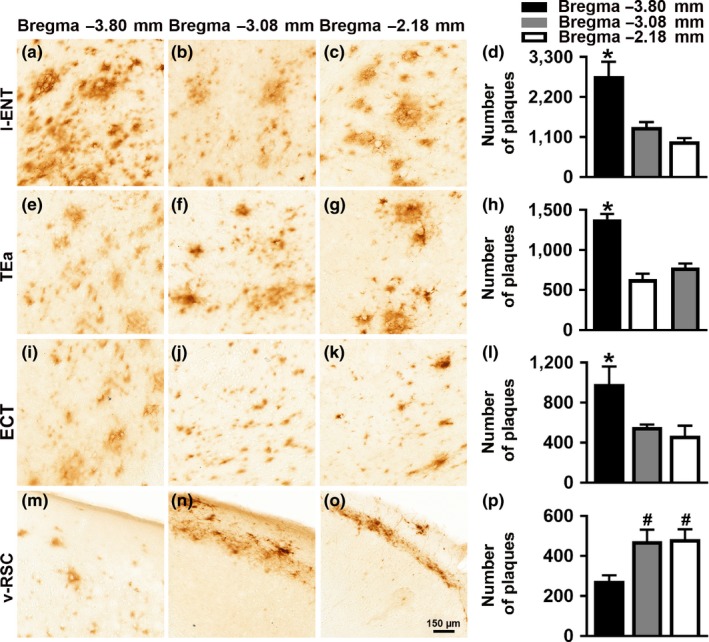
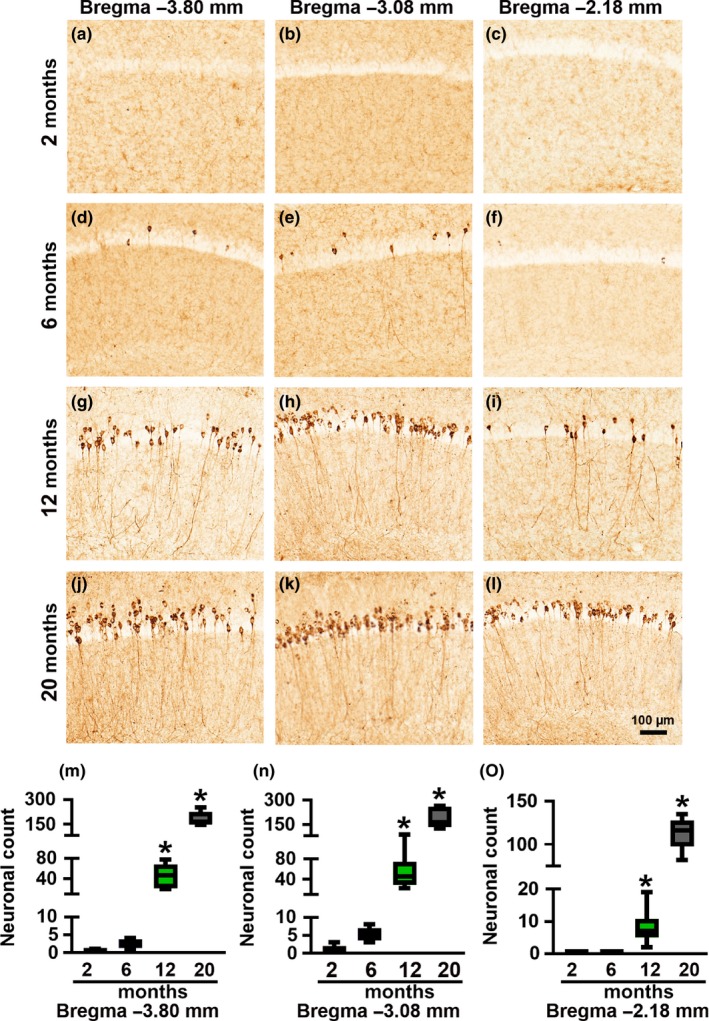
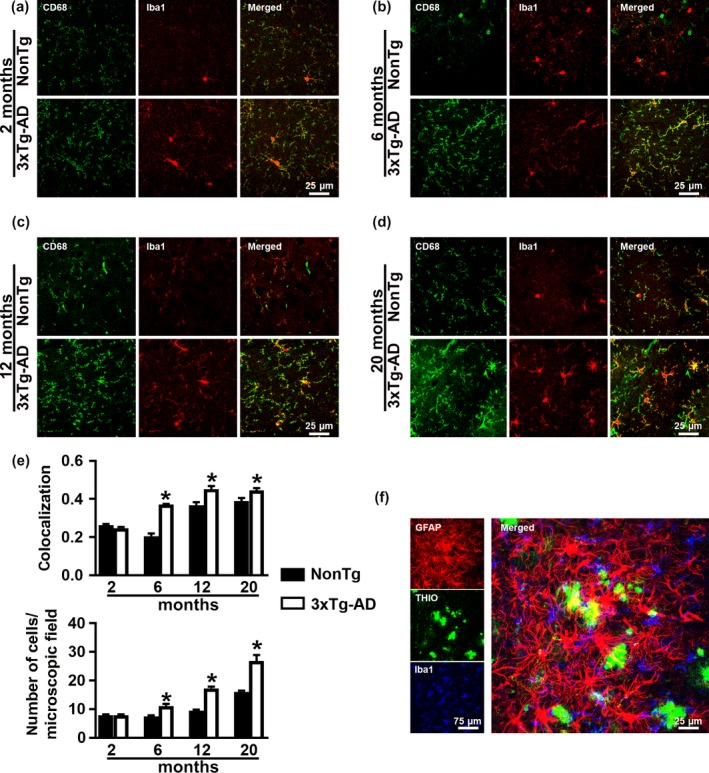
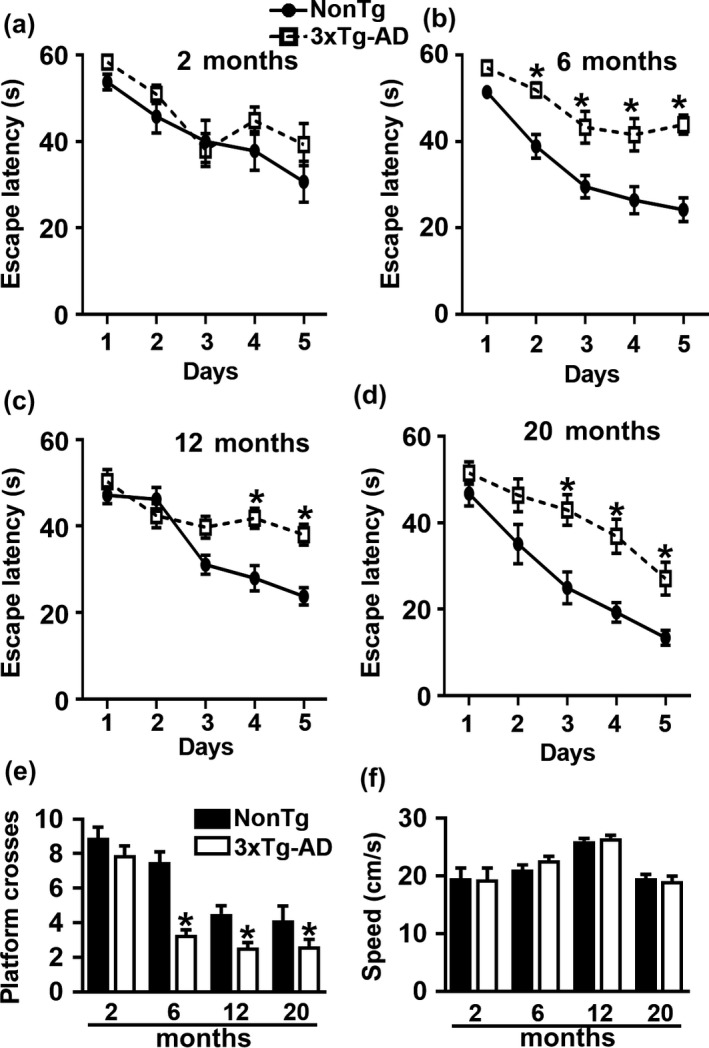
Accumulation of amyloid-β (Aβ) and fibrillary tangles, as well as neuroinflammation and memory loss, are hallmarks of Alzheimer's disease (AD). After almost 15 years from their generation, 3xTg-AD mice are still one of the most used transgenic models of AD. Converging evidence indicates that the phenotype of 3xTg-AD mice has shifted over the years and contradicting reports about onset of pathology or cognitive deficits are apparent in the literature. Here, we assessed Aβ and tau load, neuroinflammation, and cognitive changes in 2-, 6-, 12-, and 20-month-old female 3xTg-AD and nontransgenic (NonTg) mice. We found that ~80% of the mice analyzed had Aβ plaques in the caudal hippocampus at 6 months of age, while 100% of them had Aβ plaques in the hippocampus at 12 months of age. Cortical Aβ plaques were first detected at 12 months of age, including in the entorhinal cortex. Phosphorylated Tau at Ser202/Thr205 and Ser422 was apparent in the hippocampus of 100% of 6-month-old mice, while only 50% of mice showed tau phosphorylation at Thr212/Ser214 at this age. Neuroinflammation was first evident in 6-month-old mice and increased as a function of age. These neuropathological changes were clearly associated with progressive cognitive decline, which was first apparent at 6 months of age and became significantly worse as the mice aged. These data indicate a consistent and predictable progression of the AD-like pathology in female 3xTg-AD mice, and will facilitate the design of future studies using these mice.

Keywords: APP; Aβ; cognitive deficits; inflammation; microglia; neuroinflammation; plaques; tangles; tau; transgenic mice.


Figures

Figure 1
Figure 1
Age‐dependent Aβ pathology in the hippocampus. (a–l) Representative microphotographs of hippocampal sections from 2‐, 6‐, 12‐, and 20‐month‐old 3xTg‐AD mice stained with an anti‐Aβ42‐specific antibody (n = 6/age group). As indicated, brain sections were selected at −3.80, −3.08, and −2.18 mm posterior to bregma. (m–o), Quantitative analysis of the anti‐Aβ42 immunoreactivity from the caudal (p < 0.0001, F 3,20 = 39.97), medial (p < 0.0001, F 3,20 = 32.6) and rostral (p < 0.0001, F 3,20 = 26.74) hippocampus. Post hoc analysis indicated that Aβ42 immunoreactivity in the caudal hippocampus (m) was significantly increased between 6 and 12 months of age (p < 0.0001) but not significantly increased between 12‐ and 20‐month‐old mice 3xTg‐AD (p = 0.0764). In contrast, a quantitative analysis of medial (n) and rostral (o) hippocampus showed significant differences among all the age‐groups (p < 0.001). (p–s), Sandwich ELISA measurements of soluble and insoluble Aβ40 and Aβ42 levels. The levels of soluble Aβ40 did not change as a function of age, whereas soluble Aβ42 levels were significantly different among the four age‐groups (p < 0.0001, F 3,31 = 19.74). Specifically, post hoc evaluations showed that the levels of soluble Aβ42 were significantly different between all the pairwise comparisons (p < 0.0001) except when comparing the 6‐ and 12‐month‐old mice. Insoluble Aβ40 changed as a function of age (p = 0.0081, F 3,31 = 4.699). Post hoc analyses indicated that the 12‐ and 20‐month groups were significantly different than the other two groups (p < 0.0001 for both comparisons). Insoluble Aβ42 levels also increased as a function of age (p < 0.0001, F 3,30 = 15.15). Post hoc analyses showed the insoluble Aβ42 levels were significantly different between all the pairwise comparisons (p < 0.005), except when comparing the 6‐ and 12‐month‐old mice. Red bars indicate 2‐month‐old mice; blue bars indicate 6‐month‐old mice; green bars indicate 12‐month‐old mice; grey bars indicate 20‐month‐old mice. Data were analyzed by one‐way ANOVA followed by Bonferroni’s post hoc tests. Asterisks indicate differences within all the groups; hashtags indicate differences between selected groups. Error bars represent mean ± SEM
Figure 2
Figure 2
Cortical Aβ plaques deposition in 12‐month‐old 3xTg‐AD mice. Representative microphotographs of brain sections from 12‐month‐old 3xTg‐AD mice (n = 6/age group) stained with a selective Aβ42 antibody. Per each brain region, sections were taken at three different rostrocaudal levels. (a–c) Aβ42 immunoreactivity in the lateral entorhinal cortex (l‐ENT). (d) Quantitative analyses of the staining indicated that the number of Aβ plaques was higher in the caudal l‐ENT compared to the medial and rostral l‐ENT (p = 0.0013 and p < 0.0001, respectively). Also, there was a statistically significant difference between the medial and the rostral l‐ENT (p = 0.001). (e–g) Aβ42 immunoreactivity in the temporal association area (TEa). (h) Quantitative analyses of the staining indicated that in the caudal TEa the number of Aβ plaques was higher compared to medial and rostral TEa (p < 0.0001 for both comparisons). Further, the number of plaques was higher in the medial TEa compared to rostral TEa (p = 0.0008). (i–k) Aβ42 immunoreactivity in the ectorhinal cortex (ECT). (l) Quantitative analyses of the staining indicated that there was a higher number of Aβ plaques in the caudal ECT compared to medial and rostral ECT (p = 0.0125 and 0.0004, respectively). (m–o) Aβ42 immunoreactivity in the ventral retrosplenial cortex (v‐RSC). (p) Quantitative analyses of the staining indicated that the caudal v‐RSC had significantly fewer plaques compared to the medial and rostral v‐RSC (p = 0.003 and 0.004, respectively). Data were analyzed by one‐way ANOVA followed by Bonferroni’s post hoc evaluations. Asterisks indicate differences between all the groups. Error bars represent mean ± SEM
Figure 3
Figure 3
Cortical Aβ pathology in 20‐month‐old 3xTg‐AD mice. Representative microphotographs of brain sections from 20‐month‐old 3xTg‐AD mice (n = 6/age group) stained with a selective Aβ42 antibody. Per each brain region, sections were taken at three different rostrocaudal levels. (a–c) Aβ42 immunoreactivity in the lateral entorhinal cortex (l‐ENT). (d) Quantitative analyses of the staining indicated that the number of Aβ plaques was higher in the caudal l‐ENT compared to the medial and rostral l‐ENT (p = 0.0002 and p < 0.0001, respectively). (e–g) Aβ42 immunoreactivity in the temporal association area (TEa). (h) Quantitative analyses of the staining indicated that in the caudal TEa the number of Aβ plaques was higher than the medial and rostral TEa (p = 0.009 and 0.001, respectively). (i–k) Aβ42 immunoreactivity in the ectorhinal cortex (ECT). (l) Quantitative analyses of the staining indicated that there was a higher number of Aβ plaques in the caudal ECT compared to the medial and rostral ECT (p = 0.09 and 0.03, respectively. (m–o) Aβ42 immunoreactivity in the ventral retrosplenial cortex (v‐RSC). (p) Quantitative analyses of the staining indicated that the number of plaques was significantly increased in the medial and rostral v‐RSC compared to the caudal v‐RSC (p = 0.04 and 0.03, respectively). Data were analyzed by one‐way ANOVA followed by Bonferroni's post hoc evaluations. Asterisks indicate differences within all the groups; hashtags indicate differences with selected groups. Error bars represent mean ± SEM
Figure 4
Figure 4
Age‐dependent progression of tau phosphorylation at S422 in hippocampi of 3xTg‐AD mice. (a–l) Representative microphotographs of hippocampal sections from 2‐, 6‐, 12‐, and 20‐month‐old 3xTg‐AD mice stained with an anti‐pS422‐specific antibody (n = 6/age group). Brain sections were selected at −3.80, −3.08, and −2.18 mm posterior to bregma. (m–o) Quantitative analysis of the anti‐pS422 immunoreactivity by one‐way ANOVA followed by a Bonferroni’s multiple‐comparison test shows a statistically significant age‐dependent difference in the caudal (p < 0.0001, F 3,20 = 83.1), medial (p < 0.0001, F 3,20 = 47.88) and rostral (p < 0.0001, F 3,20 = 188.5) hippocampus. Post hoc analysis indicated that pS422 immunoreactivity in all three hippocampal regions was significantly higher in 12‐month‐old mice compared to the 2‐ and 6‐month groups (p < 0.005). Further, the 20‐month‐old mice have significantly higher pS422 immunoreactivity compared to all the other three age‐groups (p < 0.0001). Asterisks indicate differences within all the groups. Error bars represent mean ± SEM
Figure 5
Figure 5
Age‐dependent microglia activation in 3xTg‐AD mice. (a–d) Representative confocal microphotographs of CA1 sections from the medial hippocampus of NonTg and 3xTg‐AD mice (n = 6/genotype/age group). Sections were stained antibodies against Iba1 and CD68. (e) Quantitative analysis revealed that the number of colocalized pixels (top graph) and the number of Iba1‐positive cells (bottom graph) was significantly higher in 3xTg‐AD mice than NonTg mice at 6, 12 and 20 months. (f) Representative confocal microphotographs of CA1 section from 20‐month‐old 3xTg‐AD mice stained with Thioflavin (green), anti‐GFAP (red), and anti‐Iba1 (blue) antibodies. The image shows the different distribution of microglial (homogenously distributed) and reactive astrocytes (surrounding Aβ plaques). Statistical evaluation was obtained by the Pearson’s correlation coefficients. Error bars represent mean ± SEM
Figure 6
Figure 6
Age‐dependent spatial learning and memory deficits. (a–d) Learning curves of mice trained in the spatial reference version of the Morris water maze (2 months, n = 15/genotype; 6 months, n = 15 for 3xTg‐AD and n = 10 for NonTg; 12 months, n = 15 for 3xTg‐AD and n = 14 for NonTg; and 20 months, n = 15 for 3xTg‐AD and n = 11 for NonTg). The escape latency to find the hidden platform was plotted against the days of training. The values for each day represent the average of four training trials. At 2 months of age, we found a significant effect for day (p < 0.0001, F 4,135 = 10.90) but not a significant effect for genotype (p = 0.0623, F 1,135 = 3.53). At 6 months of age, we found significant effects for day (p < 0.0001, F 4,92 = 23.37) and genotype (p < 0.0001, F 1,23 = 41.86). Post hoc tests indicated that NonTg mice performed significantly better than 3xTg‐AD mice on day 2 (p = 0.0053), day 3 (p = 0.0028), day 4 (p = 0.0008), and day 5 (p < 0.0001). At 12 months of age, there was a significant effect for day (p < 0.0001, F 4,108 = 21.85) and genotype (p = 0.0022, F 1,27 = 11.46). Post hoc tests indicated that NonTg mice performed significantly better than 3xTg‐AD mice on day 4 (p = 0.0008) and day 5 (p = 0.0005). At 20 months of age, there was a significant effect for day (p < 0.0001, F 4,92 = 26.03) and for genotype (p < 0.0001, F 1,23 = 22.05). Post hoc tests showed that 3xTg‐AD mice performed significantly worse when compared with NonTg mice on day 3 (p = 0.0014), day 4 (p = 0.0018) and day 5 (p = 0.0259). (e) Number of platform location crosses during a single 60‐s probe trial. 3xTg‐AD mice performed significantly worse compared to NonTg mice at 6 (p = 0.0008), 12 (p = 0.0123), and 20 months of age (p = 0.01400). (f) Swim speed was similar between the two groups at all the ages (p > 0.05). Learning data were analyzed by two‐way ANOVA; probe trials were analyzed by one‐way ANOVA. Bonferroni’s was used for post hoc tests. *Significant difference between NonTg and 3xTg‐AD mice. Error bars represent mean ± SEM

Similar articles

Cited by

References

    1. Alzheimer’s Association (2016). 2016 Alzheimer’s disease facts and figures. Alzheimer's and Dementia: the Journal of the Alzheimer's Association, 12(4), 459–509. - PubMed
    1. Amin, J. , Paquet, C. , Baker, A. , Asuni, A. A. , Love, S. , Holmes, C. , & Boche, D. (2015). Effect of amyloid‐beta (Abeta) immunization on hyperphosphorylated tau: A potential role for glycogen synthase kinase (GSK)‐3beta. Neuropathology and Applied Neurobiology, 41(4), 445–457. 10.1111/nan.12205 - DOI - PubMed
    1. Augustinack, J. C. , Schneider, A. , Mandelkow, E. M. , & Hyman, B. T. (2002). Specific tau phosphorylation sites correlate with severity of neuronal cytopathology in Alzheimer’s disease. Acta Neuropathologica, 103(1), 26–35. 10.1007/s004010100423 - DOI - PubMed
    1. Bilkei‐Gorzo, A. (2014). Genetic mouse models of brain ageing and Alzheimer’s disease. Pharmacology and Therapeutics, 142(2), 244–257. 10.1016/j.pharmthera.2013.12.009 - DOI - PubMed
    1. Billings, L. M. , Oddo, S. , Green, K. N. , McGaugh, J. L. , & LaFerla, F. M. (2005). Intraneuronal Abeta causes the onset of early Alzheimer’s disease‐related cognitive deficits in transgenic mice. Neuron, 45(5), 675–688. 10.1016/j.neuron.2005.01.040 - DOI - PubMed

Publication types

LinkOut - more resources