

Toward an ecotoxicological risk assessment of microplastics: Comparison of available hazard and exposure data in freshwaters
- PMID: 30488983
- PMCID: PMC6849787
- DOI: 10.1002/etc.4323
Toward an ecotoxicological risk assessment of microplastics: Comparison of available hazard and exposure data in freshwaters
Abstract
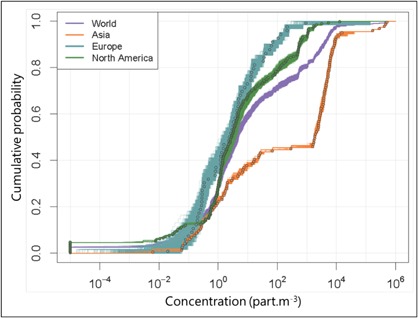
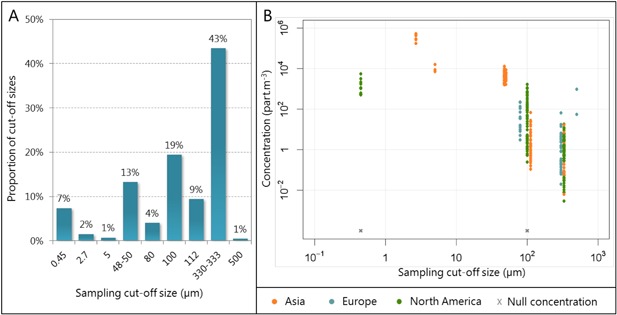
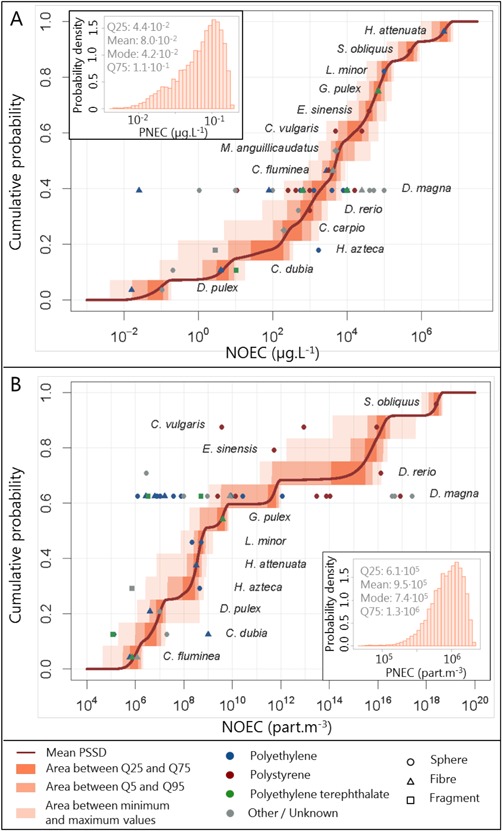
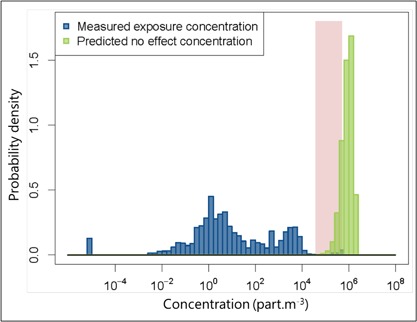
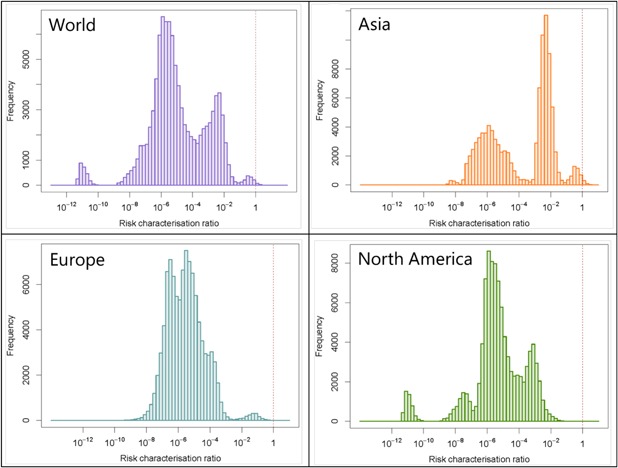
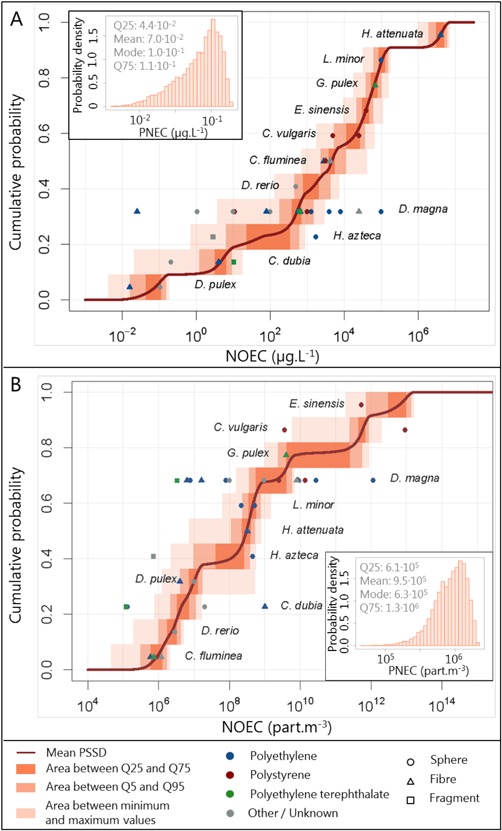
Microplastics have been detected in freshwaters all over the world in almost all samples, and ecotoxicological studies have shown adverse effects of microplastics on organisms. However, no risk assessment of microplastics has been performed specifically in freshwater so far. The aim of the present study was therefore to review all exposure and ecotoxicity data available for microplastics in freshwaters and to perform a preliminary probabilistic risk assessment. The exposure probability distribution was based on 391 concentrations measured in Asia, Europe, and North America. Because exposure data are mainly available in particle number-based metrics but results from hazard studies are mostly mass-based, the hazard results were converted into particle number concentrations. A statistical analysis of the hazard data showed that there was no significant influence of particle shape or type of polymer on the no-observed-effect concentration. The predicted-no-effect concentration (PNEC) was calculated as the fifth percentile of the probabilistic species sensitivity distribution, based on 53 values from 14 freshwater species, to have a mode of 7.4 × 10⁵ particles · m-3 (25th and 75th quantiles of 6.1 × 10⁵ and 1.3 × 10⁶ particles · m-3 , respectively). The exposure probability distribution was divided by the PNEC probability distribution to calculate risk characterization ratios (RCRs), with modes of 1.3 × 10⁻⁶ in North America, 3.3 × 10⁻⁶ in Europe, and 4.6 × 10⁻³ in Asia. Probability distributions associated with the RCRs showed that ecological risks cannot be entirely excluded in Asia, where 0.4% of the RCR values were above 1. Environ Toxicol Chem 2019;38:436-447. © 2018 SETAC.
Keywords: Freshwater; Microplastics; Probabilistic risk assessment; Probabilistic species sensitivity distribution.
© 2018 SETAC.
Figures
References
-
- Avio CG, Gorbi S, Regoli F. 2015. Experimental development of a new protocol for extraction and characterization of microplastics in fish tissues: First observations in commercial species from Adriatic Sea. Mar Environ Res 111:18–26. - PubMed
-
- Baldwin AK, Corsi SR, Mason SA. 2016. Plastic debris in 29 Great Lakes tributaries: Relations to watershed attributes and hydrology. Environ Sci Technol 50:10377–10385. - PubMed
-
- Blettler MCM, Abrial E, Khan FR, Sivri N, Espinola LA. 2018. Freshwater plastic pollution: Recognizing research biases and identifying knowledge gaps. Water Res 28:416–424. - PubMed
-
- Burns E, Boxall ABA. 2018. Microplastics in the aquatic environment: Evidence for or against adverse impacts and major knowledge gaps. Environ Toxicol Chem 37:2776–2796. - PubMed
-
- Cable RN, Beletsky D, Beletsky R, Wigginton K, Locke BW, Duhaime MB. 2017. Distribution and modeled transport of plastic pollution in the Great Lakes, the world's largest freshwater resource. Front Environ Sci 5 DOI: 10.3389/fenvs.2017.00045. - DOI
MeSH terms
Substances
LinkOut - more resources
Full Text Sources
