Cost-effectiveness of Maintenance Capecitabine and Bevacizumab for Metastatic Colorectal Cancer
- PMID: 30489611
- PMCID: PMC6440196
- DOI: 10.1001/jamaoncol.2018.5070
Cost-effectiveness of Maintenance Capecitabine and Bevacizumab for Metastatic Colorectal Cancer
Abstract
Importance: Unregulated drug prices increase cancer therapy costs. After induction chemotherapy, patients with metastatic colon cancer can receive maintenance capecitabine and bevacizumab therapy based on improved progression-free survival, but whether this treatment's cost justifies its benefits has not been evaluated in the United States.
Objective: This study sought to determine the influence of capecitabine and bevacizumab drug prices on cost-effectiveness from a Medicare payer's perspective.
Design, setting, and participants: The incremental cost-effectiveness of capecitabine and bevacizumab maintenance therapy was determined with a Markov model using a quality-of-life penalty based on outcomes data from the CAIRO phase 3 randomized clinical trial (RCT), which included 558 adults in the Netherlands with unresectable metastatic colorectal cancer who had stable disease or better following induction chemotherapy. The outcomes were modeled using Markov chains to account for patients who had treatment complications or cancer progression. Transition probabilities between patient states were determined, and each state's costs were determined using US Medicare data on payments for capecitabine and bevacizumab treatment. Deterministic and probabilistic sensitivity analyses identified factors affecting cost-effectiveness.
Main outcomes and measures: Life-years gained were adjusted using CAIRO3 RCT quality-of-life data to determine quality-adjusted life-years (QALYs). The primary end point was the incremental cost-effectiveness ratio, representing incremental costs per QALY gained using a capecitabine and bevacizumab maintenance regimen compared with observation alone.
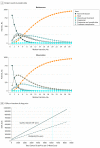
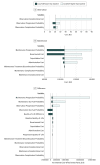
Results: Markov model estimated survival and complication outcomes closely matched those reported in the CAIRO3 RCT, which included 558 adults (n = 197 women, n = 361 men; median age, 64 and 63 years for patients in the observation and maintenance therapy groups, respectively) in the Netherlands with unresectable metastatic colorectal cancer who had stable disease or better following induction chemotherapy. Incremental costs for a 3-week maintenance chemotherapy cycle were $6601 per patient. After 29 model iterations corresponding to 60 months of follow-up, mean per-patient costs were $105 239 for maintenance therapy and $21.10 for observation. Mean QALYs accrued were 1.34 for maintenance therapy and 1.20 for observation. The incremental cost-effectiveness ratio favored maintenance treatment, at an incremental cost of $725 601 per QALY. The unadjusted ratio was $438 394 per life-year. Sensitivity analyses revealed that cost-effectiveness varied with changes in drug costs. To achieve an incremental cost-effectiveness ratio of less than $59 039 (median US household income) per unadjusted life-year would require capecitabine and bevacizumab drug costs to be reduced from $6173 (current cost) to $452 per 3-week chemotherapy cycle.
Conclusions and relevance: Antineoplastic therapy is expensive for payers and society. The price of capecitabine and bevacizumab maintenance therapy would need to be reduced by 93% to make it cost-effective, a finding useful for policy decision making and payment negotiations.
Conflict of interest statement
Figures


Similar articles
-
Cost-effectiveness of capecitabine and bevacizumab maintenance treatment after first-line induction treatment in metastatic colorectal cancer.Eur J Cancer. 2017 Apr;75:204-212. doi: 10.1016/j.ejca.2017.01.019. Epub 2017 Feb 24. Eur J Cancer. 2017. PMID: 28237866 Clinical Trial.
-
Cost-effectiveness analysis of capecitabine plus bevacizumab versus capecitabine alone in elderly patients with previously untreated metastatic colorectal cancer from Chinese societal perspective.Clin Transl Oncol. 2020 Jan;22(1):103-110. doi: 10.1007/s12094-019-02114-x. Epub 2019 May 6. Clin Transl Oncol. 2020. PMID: 31062173
-
First- and second-line bevacizumab in addition to chemotherapy for metastatic colorectal cancer: a United States-based cost-effectiveness analysis.J Clin Oncol. 2015 Apr 1;33(10):1112-8. doi: 10.1200/JCO.2014.58.4904. Epub 2015 Feb 17. J Clin Oncol. 2015. PMID: 25691669 Free PMC article.
-
The cost-effectiveness of bevacizumab in the first-line treatment of metastatic colorectal cancer in England and Wales.Eur J Cancer. 2007 Nov;43(17):2487-94. doi: 10.1016/j.ejca.2007.08.017. Epub 2007 Oct 1. Eur J Cancer. 2007. PMID: 17910914 Review.
-
Economic Evaluation of Bevacizumab for the First-Line Treatment of Newly Diagnosed Glioblastoma Multiforme.J Clin Oncol. 2015 Jul 10;33(20):2296-302. doi: 10.1200/JCO.2014.59.7245. Epub 2015 May 26. J Clin Oncol. 2015. PMID: 26014296 Review.
Cited by
-
Signaling pathways in colorectal cancer implications for the target therapies.Mol Biomed. 2024 Jun 7;5(1):21. doi: 10.1186/s43556-024-00178-y. Mol Biomed. 2024. PMID: 38844562 Free PMC article. Review.
-
Recent Advancements, Limitations, and Future Perspectives of the use of Personalized Medicine in Treatment of Colon Cancer.Technol Cancer Res Treat. 2023 Jan-Dec;22:15330338231178403. doi: 10.1177/15330338231178403. Technol Cancer Res Treat. 2023. PMID: 37248615 Free PMC article. Review.
-
Metronomic capecitabine as maintenance treatment after first line induction with XELOX for metastatic colorectal cancer patients.Medicine (Baltimore). 2020 Dec 18;99(51):e23719. doi: 10.1097/MD.0000000000023719. Medicine (Baltimore). 2020. PMID: 33371122 Free PMC article. Clinical Trial.
-
Cost-effectiveness analysis of capecitabine maintenance therapy plus best supportive care vs. best supportive care alone as first-line treatment of newly diagnosed metastatic nasopharyngeal carcinoma.Front Public Health. 2023 Jan 26;10:1086393. doi: 10.3389/fpubh.2022.1086393. eCollection 2022. Front Public Health. 2023. PMID: 36777769 Free PMC article.
-
Predictive value of chromosome 18q11.2-q12.1 loss for benefit from bevacizumab in metastatic colorectal cancer: A post hoc analysis of the randomized phase III-trial AGITG-MAX.Int J Cancer. 2022 Oct 1;151(7):1166-1174. doi: 10.1002/ijc.34061. Epub 2022 May 23. Int J Cancer. 2022. PMID: 35489024 Free PMC article. Clinical Trial.
References
-
- Simkens LH, van Tinteren H, May A, et al. . Maintenance treatment with capecitabine and bevacizumab in metastatic colorectal cancer (CAIRO3): a phase 3 randomised controlled trial of the Dutch Colorectal Cancer Group. Lancet. 2015;385(9980):1843-1852. doi:10.1016/S0140-6736(14)62004-3 - DOI - PubMed
-
- National Comprehensive Cancer Network NCCN guidelines. Colon cancer. https://www.nccn.org/professionals/physician_gls/default.aspx. Accessed December 21, 2017.
MeSH terms
Substances
LinkOut - more resources
Full Text Sources
Medical

