

Population and fertility by age and sex for 195 countries and territories, 1950-2017: a systematic analysis for the Global Burden of Disease Study 2017
- PMID: 30496106
- PMCID: PMC6227915
- DOI: 10.1016/S0140-6736(18)32278-5
Population and fertility by age and sex for 195 countries and territories, 1950-2017: a systematic analysis for the Global Burden of Disease Study 2017
Erratum in
-
Department of Error.Lancet. 2019 Jun 22;393(10190):e44. doi: 10.1016/S0140-6736(19)31045-1. Lancet. 2019. PMID: 31232381 Free PMC article. No abstract available.
Abstract
Background: Population estimates underpin demographic and epidemiological research and are used to track progress on numerous international indicators of health and development. To date, internationally available estimates of population and fertility, although useful, have not been produced with transparent and replicable methods and do not use standardised estimates of mortality. We present single-calendar year and single-year of age estimates of fertility and population by sex with standardised and replicable methods.
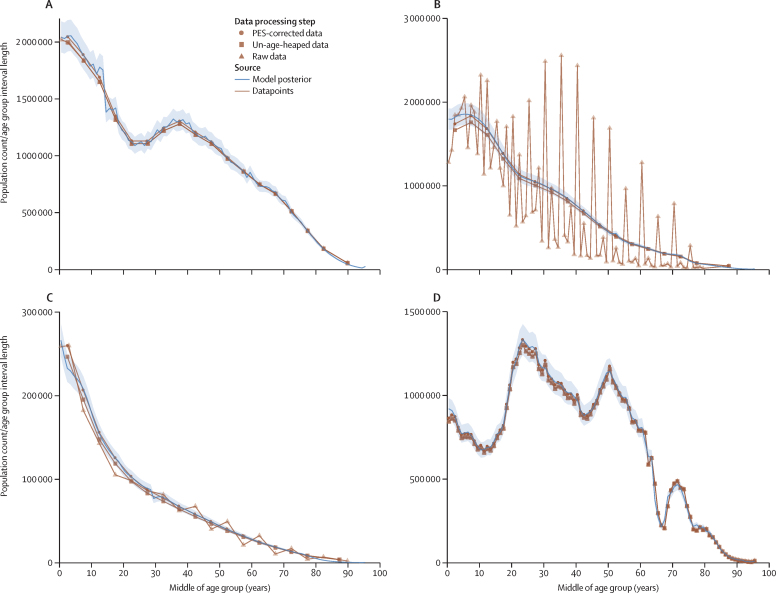
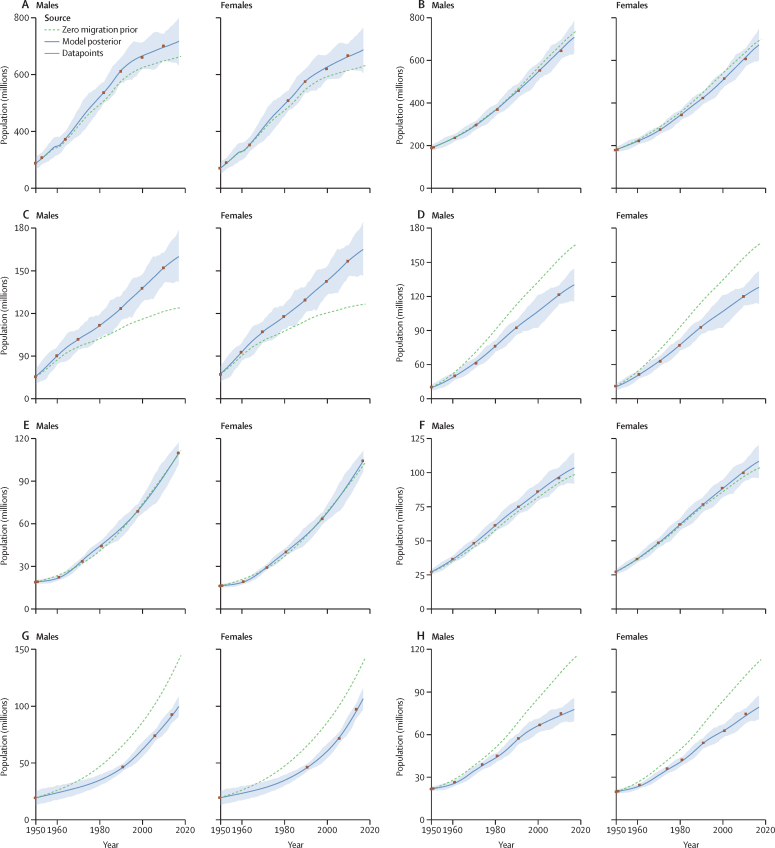
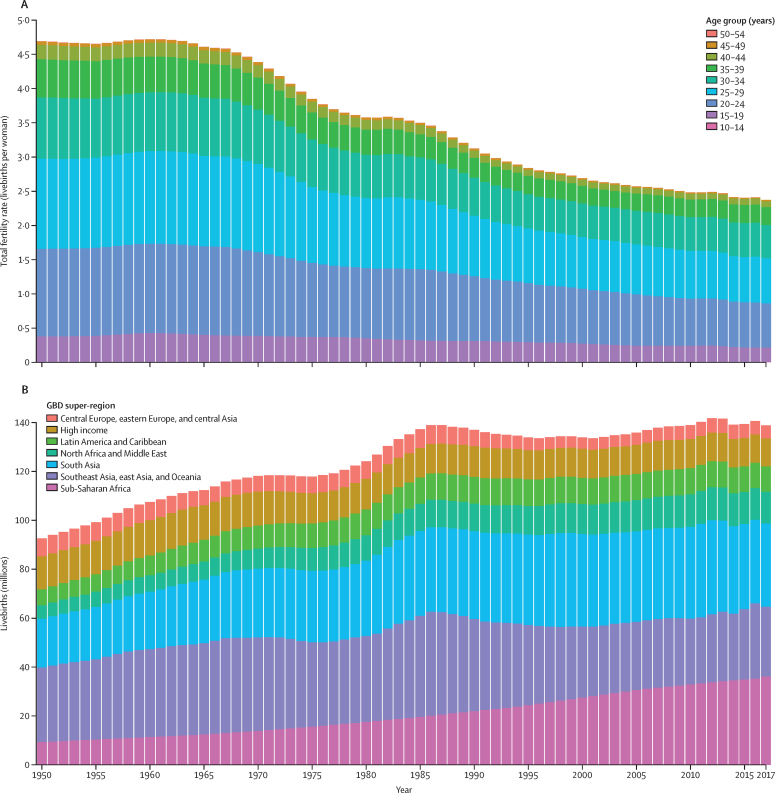
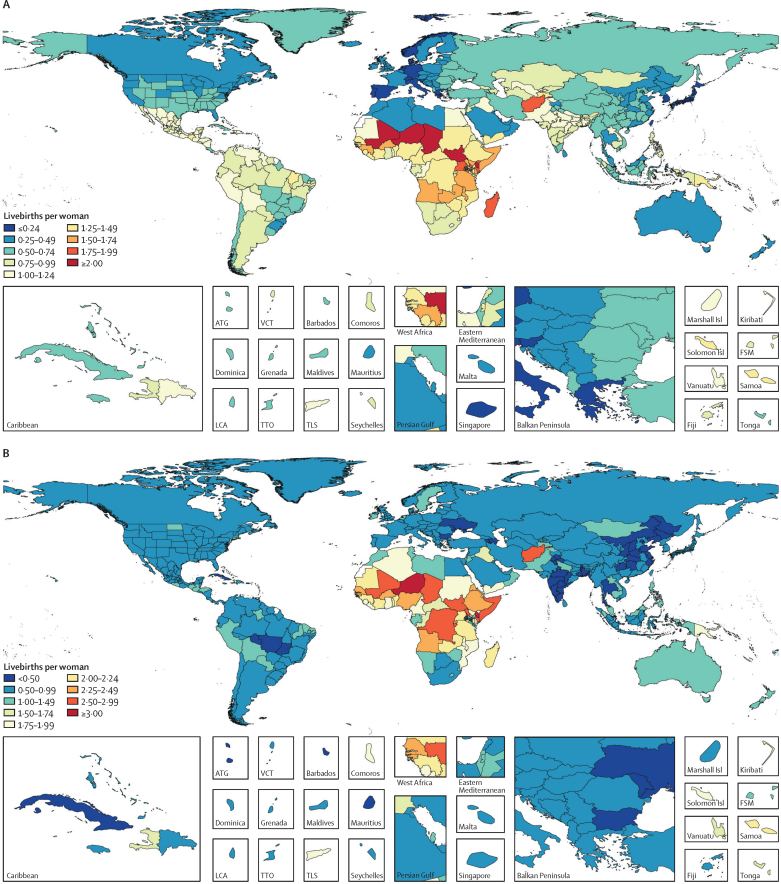
Methods: We estimated population in 195 locations by single year of age and single calendar year from 1950 to 2017 with standardised and replicable methods. We based the estimates on the demographic balancing equation, with inputs of fertility, mortality, population, and migration data. Fertility data came from 7817 location-years of vital registration data, 429 surveys reporting complete birth histories, and 977 surveys and censuses reporting summary birth histories. We estimated age-specific fertility rates (ASFRs; the annual number of livebirths to women of a specified age group per 1000 women in that age group) by use of spatiotemporal Gaussian process regression and used the ASFRs to estimate total fertility rates (TFRs; the average number of children a woman would bear if she survived through the end of the reproductive age span [age 10-54 years] and experienced at each age a particular set of ASFRs observed in the year of interest). Because of sparse data, fertility at ages 10-14 years and 50-54 years was estimated from data on fertility in women aged 15-19 years and 45-49 years, through use of linear regression. Age-specific mortality data came from the Global Burden of Diseases, Injuries, and Risk Factors Study (GBD) 2017 estimates. Data on population came from 1257 censuses and 761 population registry location-years and were adjusted for underenumeration and age misreporting with standard demographic methods. Migration was estimated with the GBD Bayesian demographic balancing model, after incorporating information about refugee migration into the model prior. Final population estimates used the cohort-component method of population projection, with inputs of fertility, mortality, and migration data. Population uncertainty was estimated by use of out-of-sample predictive validity testing. With these data, we estimated the trends in population by age and sex and in fertility by age between 1950 and 2017 in 195 countries and territories.
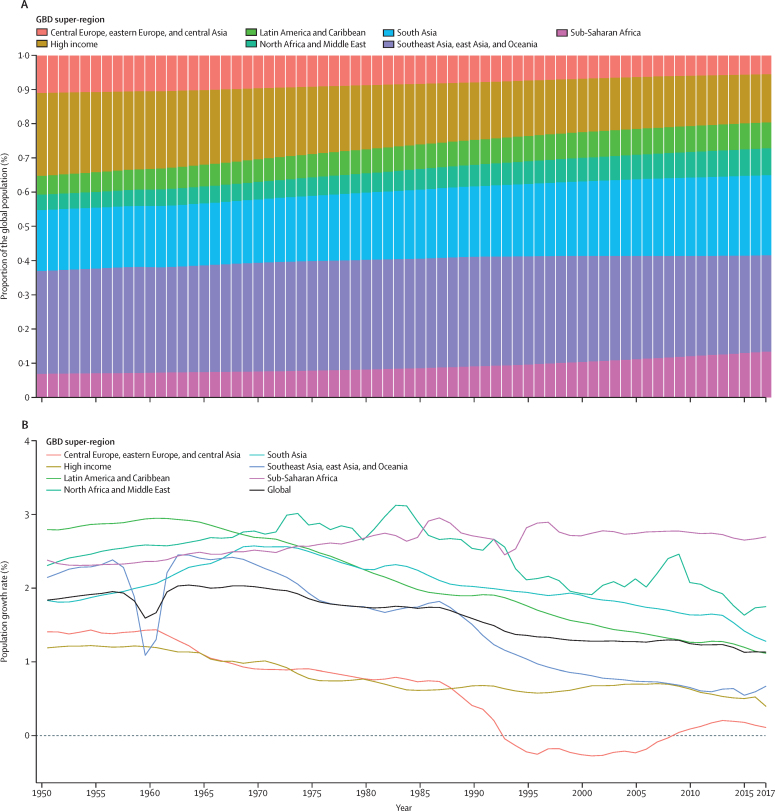
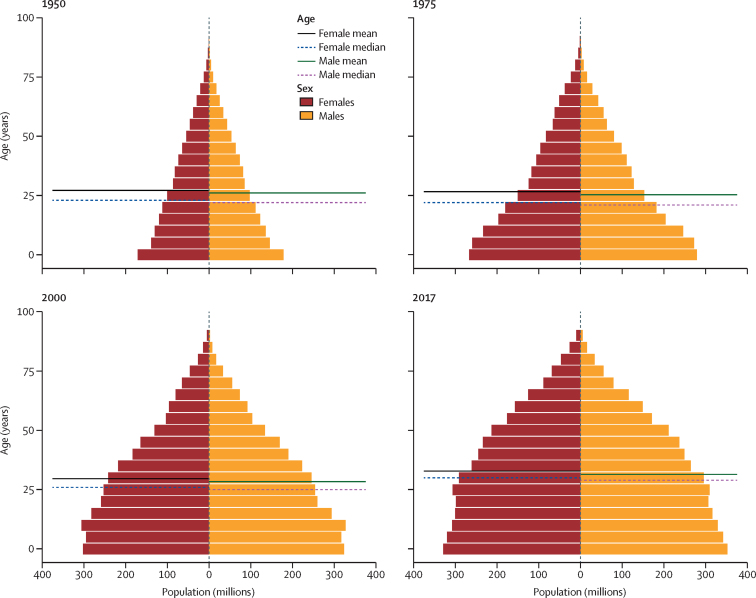
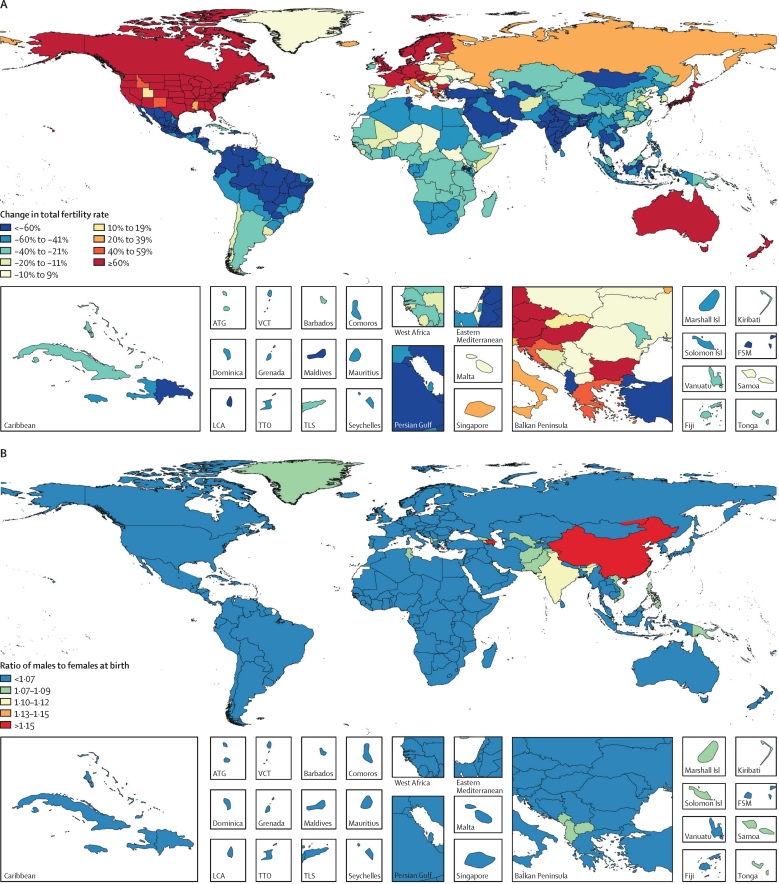
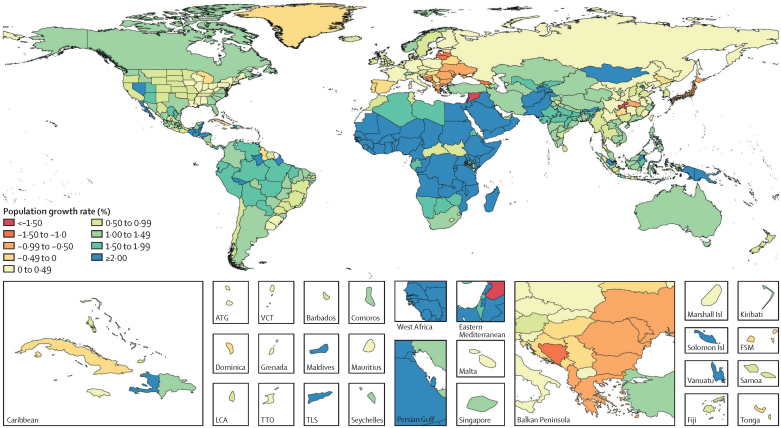
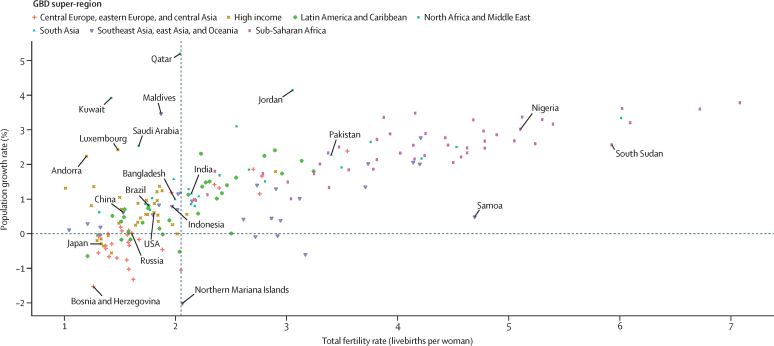
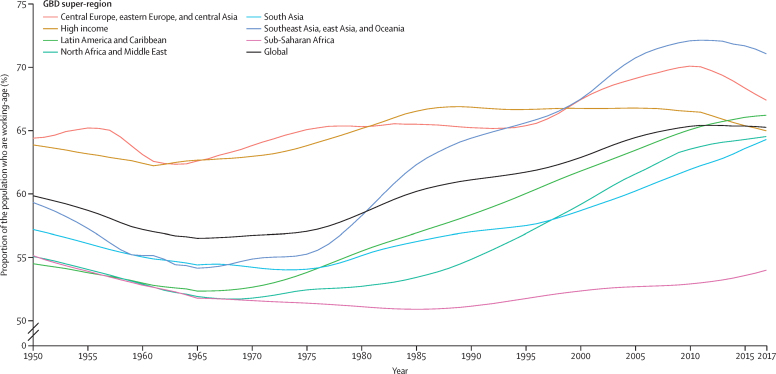
Findings: From 1950 to 2017, TFRs decreased by 49·4% (95% uncertainty interval [UI] 46·4-52·0). The TFR decreased from 4·7 livebirths (4·5-4·9) to 2·4 livebirths (2·2-2·5), and the ASFR of mothers aged 10-19 years decreased from 37 livebirths (34-40) to 22 livebirths (19-24) per 1000 women. Despite reductions in the TFR, the global population has been increasing by an average of 83·8 million people per year since 1985. The global population increased by 197·2% (193·3-200·8) since 1950, from 2·6 billion (2·5-2·6) to 7·6 billion (7·4-7·9) people in 2017; much of this increase was in the proportion of the global population in south Asia and sub-Saharan Africa. The global annual rate of population growth increased between 1950 and 1964, when it peaked at 2·0%; this rate then remained nearly constant until 1970 and then decreased to 1·1% in 2017. Population growth rates in the southeast Asia, east Asia, and Oceania GBD super-region decreased from 2·5% in 1963 to 0·7% in 2017, whereas in sub-Saharan Africa, population growth rates were almost at the highest reported levels ever in 2017, when they were at 2·7%. The global average age increased from 26·6 years in 1950 to 32·1 years in 2017, and the proportion of the population that is of working age (age 15-64 years) increased from 59·9% to 65·3%. At the national level, the TFR decreased in all countries and territories between 1950 and 2017; in 2017, TFRs ranged from a low of 1·0 livebirths (95% UI 0·9-1·2) in Cyprus to a high of 7·1 livebirths (6·8-7·4) in Niger. The TFR under age 25 years (TFU25; number of livebirths expected by age 25 years for a hypothetical woman who survived the age group and was exposed to current ASFRs) in 2017 ranged from 0·08 livebirths (0·07-0·09) in South Korea to 2·4 livebirths (2·2-2·6) in Niger, and the TFR over age 30 years (TFO30; number of livebirths expected for a hypothetical woman ageing from 30 to 54 years who survived the age group and was exposed to current ASFRs) ranged from a low of 0·3 livebirths (0·3-0·4) in Puerto Rico to a high of 3·1 livebirths (3·0-3·2) in Niger. TFO30 was higher than TFU25 in 145 countries and territories in 2017. 33 countries had a negative population growth rate from 2010 to 2017, most of which were located in central, eastern, and western Europe, whereas population growth rates of more than 2·0% were seen in 33 of 46 countries in sub-Saharan Africa. In 2017, less than 65% of the national population was of working age in 12 of 34 high-income countries, and less than 50% of the national population was of working age in Mali, Chad, and Niger.
Interpretation: Population trends create demographic dividends and headwinds (ie, economic benefits and detriments) that affect national economies and determine national planning needs. Although TFRs are decreasing, the global population continues to grow as mortality declines, with diverse patterns at the national level and across age groups. To our knowledge, this is the first study to provide transparent and replicable estimates of population and fertility, which can be used to inform decision making and to monitor progress.
Funding: Bill & Melinda Gates Foundation.
Copyright © 2018 The Author(s). Published by Elsevier Ltd. This is an Open Access article under the CC BY 4.0 license. Published by Elsevier Ltd.. All rights reserved.
Figures
Comment in
-
Populations, decreasing fertility, and reproductive health.Lancet. 2019 Apr 13;393(10180):1500-1501. doi: 10.1016/S0140-6736(19)30690-7. Lancet. 2019. PMID: 30983583 No abstract available.
References
-
- Thomas RK. Springer International Publishing; Cham, Switzerland: 2018. Concepts, methods and practical applications in applied demography: an introductory textbook.
-
- WHO World health statistics 2018: monitoring health for the SDGs. May 2, 2018. http://apps.who.int/iris/bitstream/handle/10665/272596/9789241565585-eng...
-
- WHO Health in 2015: from MDGs to SDGs. December, 2015. http://www.who.int/gho/publications/mdgs-sdgs/en/
-
- UN Department of Economic and Social Affairs. Population Division World population prospects: the 2017 revision, key findings and advance tables. June 21, 2017. https://esa.un.org/unpd/wpp/Publications/Files/WPP2017_KeyFindings.pdf
-
- UN Department of Economic and Social Affairs. Population Division World population prospects: the 2017 revision, methodology of the united nations population estimates and projections. 2017. https://esa.un.org/unpd/wpp/publications/Files/WPP2017_Methodology.pdf
Publication types
MeSH terms
Grants and funding
- R21 AG032572/AG/NIA NIH HHS/United States
- 206471/Z/17/Z/WT_/Wellcome Trust/United Kingdom
- P30 AG047845/AG/NIA NIH HHS/United States
- 201900/WT_/Wellcome Trust/United Kingdom
- MR/L003120/1/MRC_/Medical Research Council/United Kingdom
- MC_UP_A620_1014/MRC_/Medical Research Council/United Kingdom
- R01 AG030153/AG/NIA NIH HHS/United States
- SCAF/15/02/CSO_/Chief Scientist Office/United Kingdom
- MC_UU_12011/1/MRC_/Medical Research Council/United Kingdom
- MC_UU_12017/15/MRC_/Medical Research Council/United Kingdom
- R03 AG043052/AG/NIA NIH HHS/United States
- 201900/Z/16/Z/WT_/Wellcome Trust/United Kingdom
- MC_UU_12017/13/MRC_/Medical Research Council/United Kingdom
- R01 MH110163/MH/NIMH NIH HHS/United States
- RG/13/13/30194/BHF_/British Heart Foundation/United Kingdom
- MC_U147585819/MRC_/Medical Research Council/United Kingdom
- MC_UU_12026/2/MRC_/Medical Research Council/United Kingdom
LinkOut - more resources
Full Text Sources
Other Literature Sources
