Integrating evidence, models and maps to enhance Chagas disease vector surveillance
- PMID: 30496172
- PMCID: PMC6289469
- DOI: 10.1371/journal.pntd.0006883
Integrating evidence, models and maps to enhance Chagas disease vector surveillance
Abstract
Background: Until recently, the Chagas disease vector, Triatoma infestans, was widespread in Arequipa, Perú, but as a result of a decades-long campaign in which over 70,000 houses were treated with insecticides, infestation prevalence is now greatly reduced. To monitor for T. infestans resurgence, the city is currently in a surveillance phase in which a sample of houses is selected for inspection each year. Despite extensive data from the control campaign that could be used to inform surveillance, the selection of houses to inspect is often carried out haphazardly or by convenience. Therefore, we asked, how can we enhance efforts toward preventing T. infestans resurgence by creating the opportunity for vector surveillance to be informed by data?
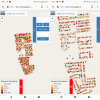
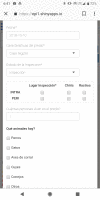
Methodology/principal findings: To this end, we developed a mobile app that provides vector infestation risk maps generated with data from the control campaign run in a predictive model. The app is intended to enhance vector surveillance activities by giving inspectors the opportunity to incorporate the infestation risk information into their surveillance activities, but it does not dictate which houses to surveil. Therefore, a critical question becomes, will inspectors use the risk information? To answer this question, we ran a pilot study in which we compared surveillance using the app to the current practice (paper maps). We hypothesized that inspectors would use the risk information provided by the app, as measured by the frequency of higher risk houses visited, and qualitative analyses of inspector movement patterns in the field. We also compared the efficiency of both mediums to identify factors that might discourage risk information use. Over the course of ten days (five with each medium), 1,081 houses were visited using the paper maps, of which 366 (34%) were inspected, while 1,038 houses were visited using the app, with 401 (39%) inspected. Five out of eight inspectors (62.5%) visited more higher risk houses when using the app (Fisher's exact test, p < 0.001). Among all inspectors, there was an upward shift in proportional visits to higher risk houses when using the app (Mantel-Haenszel test, common odds ratio (OR) = 2.42, 95% CI 2.00-2.92), and in a second analysis using generalized linear mixed models, app use increased the odds of visiting a higher risk house 2.73-fold (95% CI 2.24-3.32), suggesting that the risk information provided by the app was used by most inspectors. Qualitative analyses of inspector movement revealed indications of risk information use in seven out of eight (87.5%) inspectors. There was no difference between the app and paper maps in the number of houses visited (paired t-test, p = 0.67) or inspected (p = 0.17), suggesting that app use did not reduce surveillance efficiency.
Conclusions/significance: Without staying vigilant to remaining and re-emerging vector foci following a vector control campaign, disease transmission eventually returns and progress achieved is reversed. Our results suggest that, when provided the opportunity, most inspectors will use risk information to direct their surveillance activities, at least over the short term. The study is an initial, but key, step toward evidence-based vector surveillance.
Conflict of interest statement
The authors have declared that no competing interests exist.
Figures


Similar articles
-
Improved vector control of Triatoma infestans limited by emerging pyrethroid resistance across an urban-to-rural gradient in the Argentine Chaco.Parasit Vectors. 2021 Aug 28;14(1):437. doi: 10.1186/s13071-021-04942-9. Parasit Vectors. 2021. PMID: 34454569 Free PMC article.
-
A decade of vector control activities: Progress and limitations of Chagas disease prevention in a region of Guatemala with persistent Triatoma dimidiata infestation.PLoS Negl Trop Dis. 2018 Nov 6;12(11):e0006896. doi: 10.1371/journal.pntd.0006896. eCollection 2018 Nov. PLoS Negl Trop Dis. 2018. PMID: 30399143 Free PMC article.
-
Implementing a vector surveillance-response system for chagas disease control: a 4-year field trial in Nicaragua.Infect Dis Poverty. 2017 Mar 6;6(1):18. doi: 10.1186/s40249-016-0225-7. Infect Dis Poverty. 2017. PMID: 28260529 Free PMC article.
-
Can wild Triatoma infestans foci in Bolivia jeopardize Chagas disease control efforts?Trends Parasitol. 2005 Jan;21(1):7-10. doi: 10.1016/j.pt.2004.10.007. Trends Parasitol. 2005. PMID: 15639733 Review.
-
Insecticide resistance in vector Chagas disease: evolution, mechanisms and management.Acta Trop. 2015 Sep;149:70-85. doi: 10.1016/j.actatropica.2015.05.014. Epub 2015 May 21. Acta Trop. 2015. PMID: 26003952 Review.
Cited by
-
Incentivizing optimal risk map use for Triatoma infestans surveillance in urban environments.PLOS Glob Public Health. 2022 Aug 3;2(8):e0000145. doi: 10.1371/journal.pgph.0000145. eCollection 2022. PLOS Glob Public Health. 2022. PMID: 36962496 Free PMC article.
-
Risk maps for cities: Incorporating streets into geostatistical models.Spat Spatiotemporal Epidemiol. 2018 Nov;27:47-59. doi: 10.1016/j.sste.2018.08.003. Epub 2018 Aug 29. Spat Spatiotemporal Epidemiol. 2018. PMID: 30409376 Free PMC article.
-
Insights from quantitative and mathematical modelling on the proposed WHO 2030 goals for Chagas disease.Gates Open Res. 2019 Sep 17;3:1539. doi: 10.12688/gatesopenres.13069.1. eCollection 2019. Gates Open Res. 2019. PMID: 31781687 Free PMC article.
-
Barriers to surveillance and control of re-emergence of the Chagas disease vector Triatoma infestans in Arequipa, Peru.PLoS Negl Trop Dis. 2025 Aug 7;19(8):e0013373. doi: 10.1371/journal.pntd.0013373. eCollection 2025 Aug. PLoS Negl Trop Dis. 2025. PMID: 40773455 Free PMC article.
-
Irrigation, migration and infestation: a case study of Chagas disease vectors and bed bugs in El Pedregal, Peru.Mem Inst Oswaldo Cruz. 2024 Sep 2;119:e240002. doi: 10.1590/0074-02760240002. eCollection 2024. Mem Inst Oswaldo Cruz. 2024. PMID: 39230138 Free PMC article.
References
-
- Who. Chagas Disease Fact Sheet [Internet]. Geneva, Switzerland: World Health Organization; 2017. Available: http://www.who.int/mediacentre/factsheets/fs340/en/
-
- Vos T, Barber RM, Bell B, Bertozzi-Villa A, Biryukov S, Bolliger I, et al. Global, regional, and national incidence, prevalence, and years lived with disability for 301 acute and chronic diseases and injuries in 188 countries, 1990–2013: A systematic analysis for the Global Burden of Disease Study 2013. Lancet. 2015;386: 743–800. 10.1016/S0140-6736(15)60692-4 - DOI - PMC - PubMed
-
- World Health Organization. Chagas disease in Latin America: an epidemiological update based on the 2010 estimates. Weekly epidemiological record. 2015;6: 33–44. - PubMed
-
- Bern C. Chagas’ Disease. N Engl J Med. 2015;373: 456–466. 10.1056/NEJMra1410150 - DOI - PubMed
-
- Rassi A Jr, Rassi A, Marin-Neto JA. Chagas disease. Lancet. Elsevier Ltd; 2010;375: 1388–1402. 10.1016/S0140-6736(10)60061-X - DOI - PubMed
Publication types
MeSH terms
Substances
Grants and funding
LinkOut - more resources
Full Text Sources
Medical
Miscellaneous

