. 2018 Nov 29;13(11):e0208276.
doi: 10.1371/journal.pone.0208276. eCollection 2018.

A robust method for the estimation and visualization of IgE cross-reactivity likelihood between allergens belonging to the same protein family

Affiliations

A robust method for the estimation and visualization of IgE cross-reactivity likelihood between allergens belonging to the same protein family

Maksymilian Chruszcz et al. PLoS One. .

Abstract

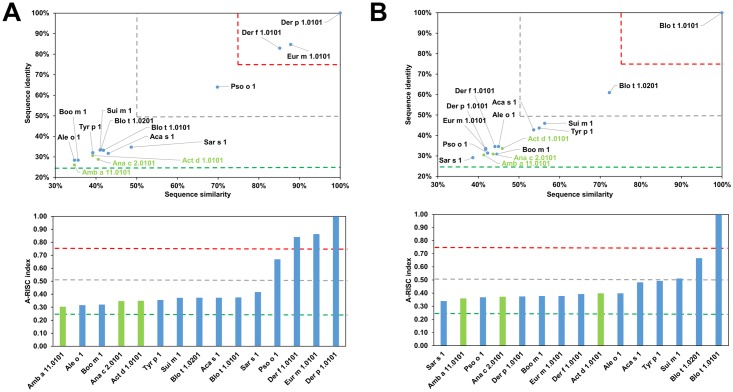
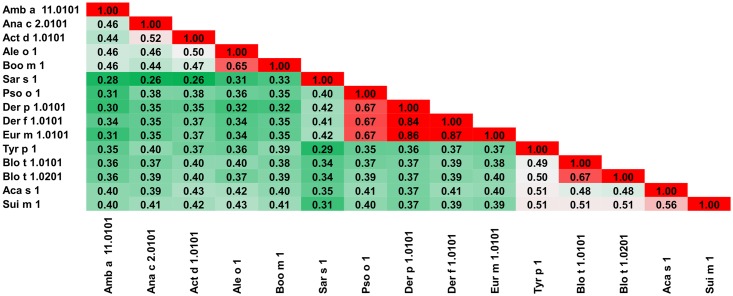
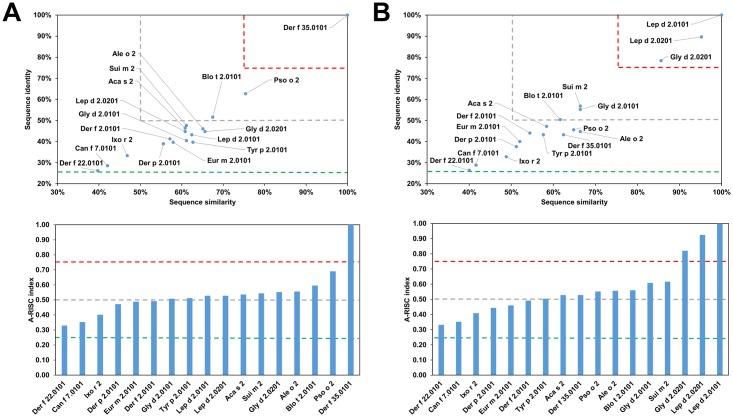
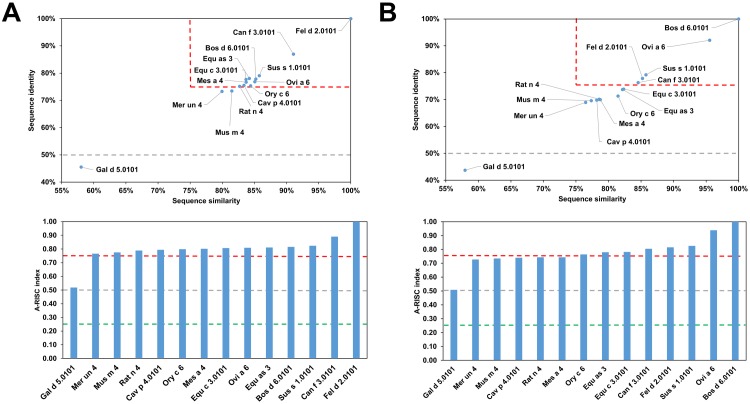
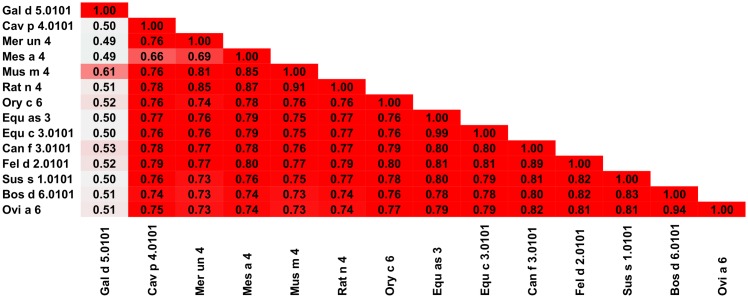
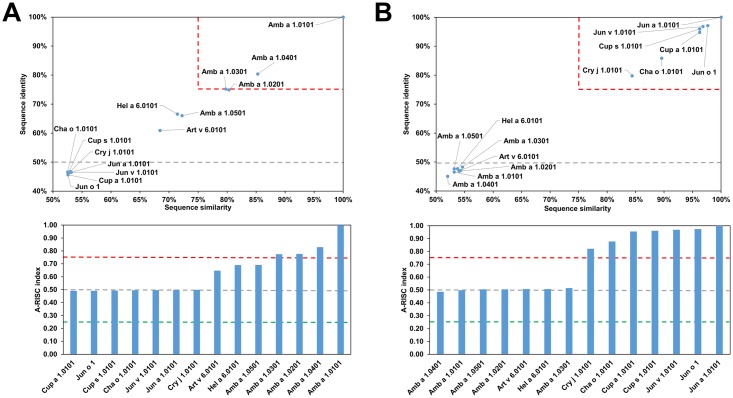
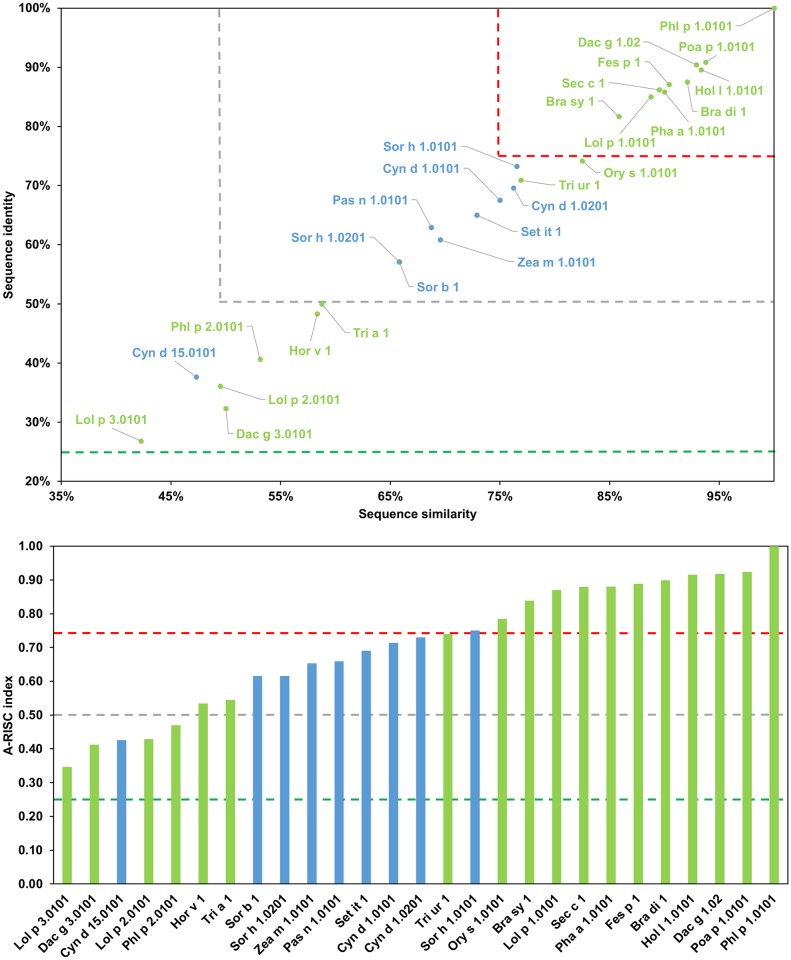
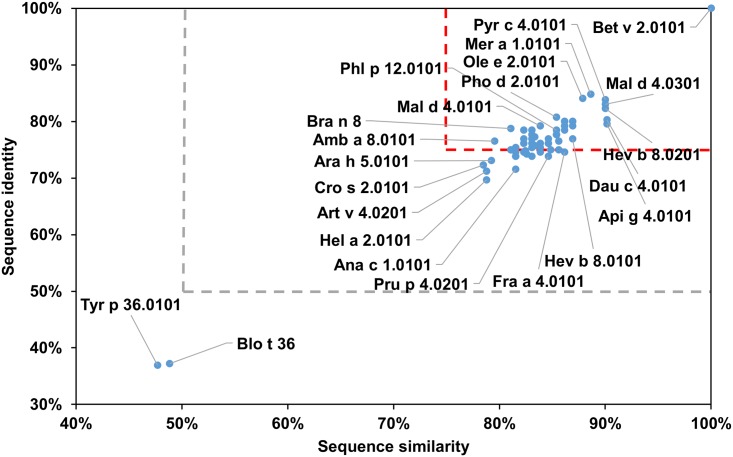
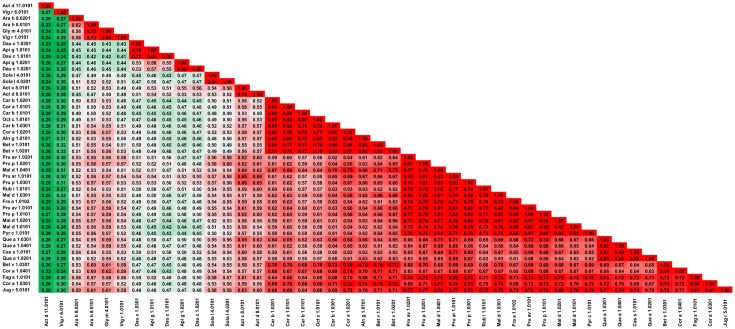
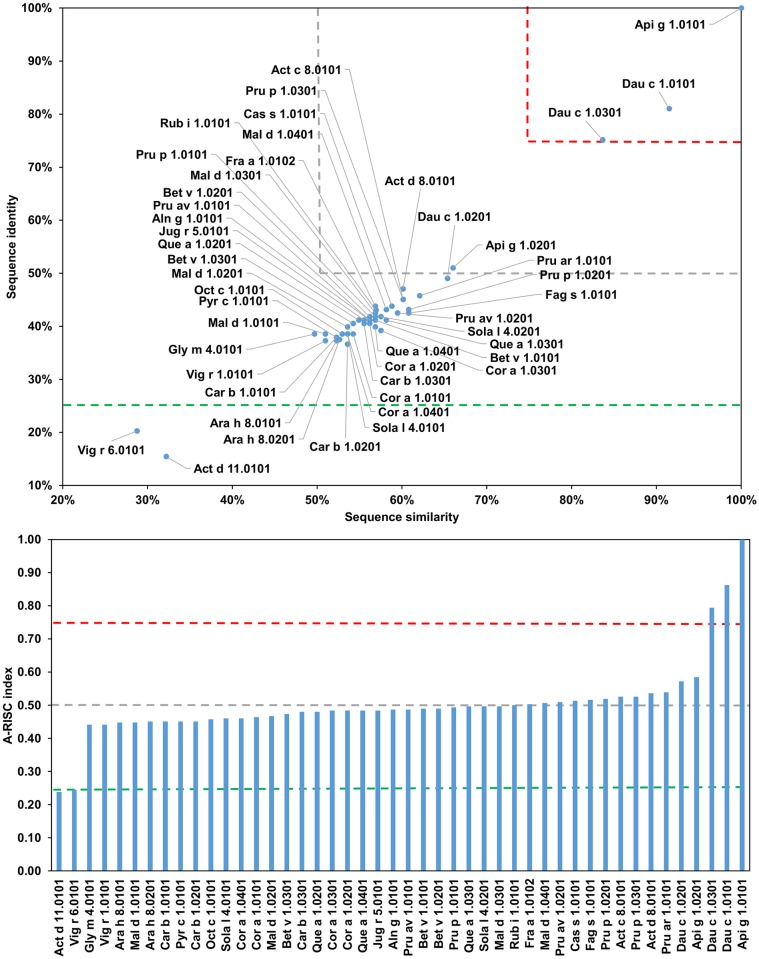
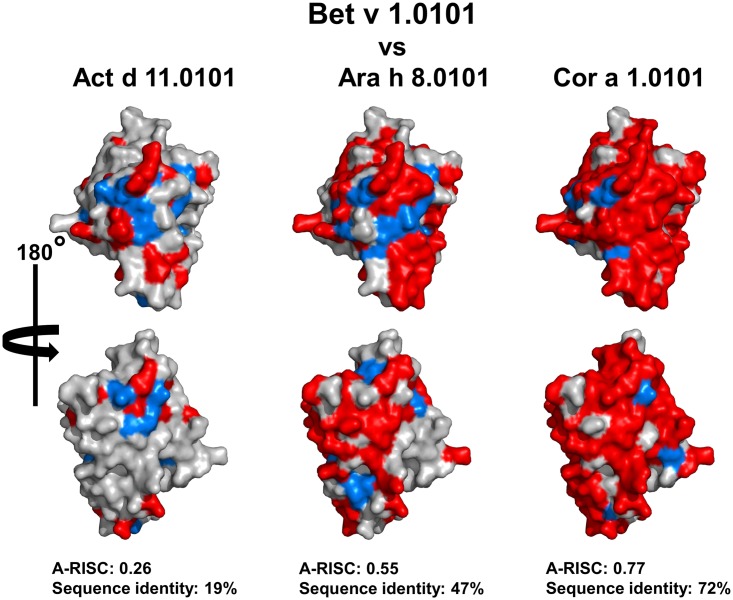
Among the vast number of identified protein families, allergens emanate from relatively few families which translates to only a small fraction of identified protein families. In allergy diagnostics and immunotherapy, interactions between immunoglobulin E and allergens are crucial because the formation of an allergen-antibody complex is necessary for triggering an allergic reaction. In allergic diseases, there is a phenomenon known as cross-reactivity. Cross-reactivity describes a situation where an individual has produced antibodies against a particular allergenic protein, but said antibodies fail to discriminate between the original sensitizer and other similar proteins that usually belong to the same family. To expound the concept of cross-reactivity, this study examines ten protein families that include allergens selected specifically for the analysis of cross-reactivity. The selected allergen families had at least 13 representative proteins, overall folds that differ significantly between families, and include relevant allergens with various potencies. The selected allergens were analyzed using information on sequence similarities and identities between members of the families as well as reports on clinically relevant cross-reactivities. Based on our analysis, we propose to introduce a new A-RISC index (Allergens'-Relative Identity, Similarity and Cross-reactivity) which describes homology between two allergens belonging to the same protein family and is used to predict the likelihood of cross-reactivity between them. Information on sequence similarities and identities, as well as on the values of the proposed A-RISC index is used to introduce four categories describing a risk of a cross-reactive reaction, namely: high, medium-high, medium-low and low. The proposed approach can facilitate analysis in component-resolved allergy diagnostics, generation of avoidance guidelines for allergic individuals, and help with the design of immunotherapy.


Conflict of interest statement

The authors have declared that no competing interests exist.

Figures

Fig 1
Fig 1. Comparison of Der p 1.0101 and Blot 1.0101.
(A) Sequence alignment of Der p 1.0101 and Blo t 1.0101 made with Clustal Omega. Similar residues are marked with bold font type. Similarity definition corresponds to a default setting of the SIAS server. Identical residues are marked in red, while residues marked in light blue correspond to the difference between similar and identical residues. Consensus line corresponds to the similarity definition used by Clustal Omega. It is important to note that the similarity definition used by SIAS is more conservative than the one used by Clustal Omega. (B) Similar amino acids (blue) marked on the structure of Der p 1. The structure is shown in ribbon (top) and space-filling representation (bottom). (C) Identical amino acids (red) mapped on the structure of Der p 1. Residues marked in light blue correspond to the difference between similar and identical residues. We assume that only half of the amino acids marked in light blue (similar, but not identical) will participate in the binding of cross-reactive antibodies. A-RISC index for Der p 1.0101 and Blo t 1.0101pair has a value of 0.37. Figures B and C were generated in Pymol [37].
Fig 2
Fig 2. Plots showing relative homology and A-RISC indexes of allergens from the papain-like cysteine protease family.
Comparison of other family members to Der p 1.0101 (A) and Blo t 1.0101 (B). Allergens originating from plants are shown in green. Red, gray and dark green dashed lines indicate 75%, 50% and 25% sequence identity and similarity respectively, or 0.75, 0.50 and 0.25 A-RISC values.
Fig 3
Fig 3. Plot showing A-RISC index values for allergen pairs from the papain-like cysteine protease family.
Red color indicates a high risk of cross-reactivity, a dark green color indicates a low risk of cross-reactivity, and intermediate colors correspond to a medium risk of cross-reactivity.
Fig 4
Fig 4. Plots showing relative homology and A-RISC indexes of allergens from the NPC2 family.
Comparison of family members to Der p 2.0101 (A) and Blo t 2.0101 (B). Red, gray, and dark green dashed lines indicate respectively 75%, 50% and 25% sequence identity and similarity, or 0.75, 0.50 and 0.25 A-RISC values.
Fig 5
Fig 5. Plots showing relative homology and A-RISC indexes of allergens from the NPC2 family.
Comparison of family members to Der f 35.0101 (A) and Lep d 2.0101 (B). Red, gray, and dark green dashed lines indicate respectively 75%, 50% and 25% sequence identity and similarity, or 0.75, 0.50 and 0.25 A-RISC values.
Fig 6
Fig 6. Plot showing A-RISC index values for allergen pairs from the NPC2 family.
Red color indicates a high risk of cross-reactivity, a dark green color indicates a low risk of cross-reactivity, and intermediate colors correspond to a medium risk of cross-reactivity.
Fig 7
Fig 7. Plots showing relative homology and A-RISC indexes of allergens from serum albumin family.
Comparison of family members to Fel d 2.0101 (A) and Bos d 6.0101 (B). Red, gray, and dark green dashed lines indicate respectively 75%, 50% and 25% sequence identity and similarity, or 0.75, 0.50 and 0.25 A-RISC values.
Fig 8
Fig 8. Plot showing A-RISC index values for allergen pairs from the serum albumin family of proteins.
Red color indicates a high risk of cross-reactivity, a dark green color indicates a low risk of cross-reactivity, and intermediate colors correspond to a medium risk of cross-reactivity.
Fig 9
Fig 9. Plot showing A-RISC index values for allergen pairs from the pectate lyase family of proteins.
Red color indicates a high risk of cross-reactivity, a dark green color indicates a low risk of cross-reactivity, and intermediate colors correspond to a medium risk of cross-reactivity.
Fig 10
Fig 10. Plots showing relative homology and A-RISC indexes of allergens from pectate lyase family.
Comparison of family members to Amb a 1.0101 (A) and Jun a 1.0101 (B). Red, gray, and dark green dashed lines indicate respectively 75%, 50% and 25% sequence identity and similarity, or 0.75, 0.50 and 0.25 A-RISC values.
Fig 11
Fig 11. Plot showing A-RISC index values for allergen pairs from lipocalin family of proteins.
Red color indicates a high risk of cross-reactivity, a dark green color indicates a low risk of cross-reactivity, and intermediate colors correspond to a medium risk of cross-reactivity.
Fig 12
Fig 12. Plots showing relative homology and A-RISC indexes of allergens from lipocalin family of proteins.
Comparison of family members to Can f 1.0101. Allergens originating from Arthropods are marked in purple, while mammalian lipocalins are shown in blue. Red, gray and dark green dashed lines indicate respectively 75%, 50% and 25% sequence identity and similarity, or 0.75, 0.50 and 0.25 A-RISC values.
Fig 13
Fig 13. Plots showing relative homology and A-RISC indexes of allergens from lipocalin family of proteins.
Comparison of family members to Equ c 1.0101. Allergens originating from Arthropods are marked in purple, while mammalian lipocalins are shown in blue. Red, gray, and dark green dashed lines indicate respectively 75%, 50% and 25% sequence identity and similarity, or 0.75, 0.50 and 0.25 A-RISC values.
Fig 14
Fig 14. Plot showing A-RISC index values for allergen pairs from the β-expansin family and expansin-related proteins.
Red color indicates a high risk of cross-reactivity, a dark green color indicates a low risk of cross-reactivity, and intermediate colors correspond to a medium risk of cross-reactivity.
Fig 15
Fig 15. Plots showing relative homology and A-RISC indexes of allergens from β-expansin family of proteins.
Comparison of family members to Phl p 2.0101. Temperate grasses are marked in green, while subtropical grasses are marked in blue. Red, gray and dark green dashed lines indicate respectively 75%, 50% and 25% sequence identity and similarity, or 0.75, 0.50 and 0.25 A-RISC values.
Fig 16
Fig 16. Plots showing relative homology and A-RISC indexes of allergens from β-expansin family of proteins.
Comparison of family members to Phl p 1.0101. Temperate grasses are marked in green, while subtropical grasses are marked in blue. Red, gray and dark green dashed lines indicate respectively 75%, 50% and 25% sequence identity and similarity, or 0.75, 0.50 and 0.25 A-RISC values.
Fig 17
Fig 17. Plot showing A-RISC index values for allergen pairs from Group V/VI grass pollen allergens.
Red color indicates a high risk of cross-reactivity, a dark green color indicates a low risk of cross-reactivity, and intermediate colors correspond to a medium risk of cross-reactivity.
Fig 18
Fig 18. Plots showing relative homology and A-RISC indexes of allergens from Group V/VI grass pollen family.
Comparison of family members to Phl p 6.0101 (A) and Phl p 5.0101 (B). Red, gray and dark green dashed lines indicate respectively 75%, 50% and 25% sequence identity and similarity, or 0.75, 0.50 and 0.25 A-RISC values.
Fig 19
Fig 19. Plot showing A-RISC index values for allergen pairs from profilin family of proteins.
Red color indicates a high risk of cross-reactivity, a dark green color indicates a low risk of cross-reactivity, and intermediate colors correspond to a medium risk of cross-reactivity.
Fig 20
Fig 20. Plots showing a relative homology of allergens from profilin family.
Comparison of family members to Bet v 2.0101. Only selected members of the family are labeled. Red and gray dashed lines indicate respectively 75% and 50% sequence identity and similarity, or 0.75, and 0.50 A-RISC values.
Fig 21
Fig 21. Plot showing A-RISC index values for allergen pairs from nsLTP family.
Red color indicates a high risk of cross-reactivity, a dark green color indicates a low risk of cross-reactivity, and intermediate colors correspond to a medium risk of cross-reactivity.
Fig 22
Fig 22. Plots showing relative homology and A-RISC indexes of allergens from nsLTP family.
Comparison of the family members to Art v 3.0201. Red, gray and dark green dashed lines indicate respectively 75%, 50% and 25% sequence identity and similarity, or 0.75, 0.50 and 0.25 A-RISC values.
Fig 23
Fig 23. Plots showing relative homology and A-RISC indexes of allergens from nsLTP family.
Comparison of the family members to Ara h 9.0101. Red, gray, and dark green dashed lines indicate respectively 75%, 50% and 25% sequence identity and similarity, or 0.75, 0.50 and 0.25 A-RISC values.
Fig 24
Fig 24. Plots showing relative homology and A-RISC indexes of allergens from nsLTP family.
Comparison of the family members to Pru p 3.0101. Red, gray and dark green dashed lines indicate respectively 75%, 50% and 25% sequence identity and similarity, or 0.75, 0.50 and 0.25 A-RISC values.
Fig 25
Fig 25. Plot showing A-RISC index values for allergen pairs from PR-10 (Bet v 1-like) family.
Red color indicates a high risk of cross-reactivity, a dark green color indicates a low risk of cross-reactivity, and intermediate colors correspond to a medium risk of cross-reactivity.
Fig 26
Fig 26. Plots showing relative homology and A-RISC indexes of allergens from PR-10 (Bet v 1-like) family.
Comparison of the family members to Api g 1.0101. Red, gray, and dark green dashed lines indicate respectively 75%, 50% and 25% sequence identity and similarity, or 0.75, 0.50 and 0.25 A-RISC values.
Fig 27
Fig 27. Plots showing relative homology and A-RISC indexes of allergens from PR-10 (Bet v 1-like) family.
Comparison of the family members to Bet v 1.0101. Red, gray, and dark green dashed lines indicate respectively 75%, 50% and 25% sequence identity and similarity, or 0.75, 0.50 and 0.25 A-RISC values.
Fig 28
Fig 28. Comparison of Bet v 1.0101 with Act d 11.0101, Ara h 8.0101 and Cor a 1.0101.
Identical amino acids (red) mapped on the structure of Bet v 1. Residues marked in light blue correspond to the difference between similar and identical residues.
Fig 29
Fig 29. A-RISC indexes for various allergen families.
Gray bars correspond to observed A-RISC ranges. The black horizontal lines indicate an average A-RISC index for a family.

References

    1. Radauer C, Nandy A, Ferreira F, Goodman RE, Larsen JN, Lidholm J, et al. Update of the WHO/IUIS Allergen Nomenclature Database based on analysis of allergen sequences. Allergy. 2014;69(4):413–9. . - PubMed
    1. Jenkins JA, Breiteneder H, Mills EN. Evolutionary distance from human homologs reflects allergenicity of animal food proteins. J Allergy Clin Immunol. 2007;120(6):1399–405. 10.1016/j.jaci.2007.08.019 . - DOI - PubMed
    1. Radauer C, Breiteneder H. Pollen allergens are restricted to few protein families and show distinct patterns of species distribution. J Allergy Clin Immunol. 2006;117(1):141–7. 10.1016/j.jaci.2005.09.010 . - DOI - PubMed
    1. Radauer C, Breiteneder H. Evolutionary biology of plant food allergens. J Allergy Clin Immunol. 2007;120(3):518–25. 10.1016/j.jaci.2007.07.024 . - DOI - PubMed
    1. Radauer C, Bublin M, Wagner S, Mari A, Breiteneder H. Allergens are distributed into few protein families and possess a restricted number of biochemical functions. J Allergy Clin Immunol. 2008;121(4):847–52 e7. 10.1016/j.jaci.2008.01.025 . - DOI - PubMed

Publication types