. 2019 Jan 1;11(1):109-120.
doi: 10.1093/gbe/evy259.

The Pseudomonas aeruginosa Pan-Genome Provides New Insights on Its Population Structure, Horizontal Gene Transfer, and Pathogenicity

Affiliations

The Pseudomonas aeruginosa Pan-Genome Provides New Insights on Its Population Structure, Horizontal Gene Transfer, and Pathogenicity

Luca Freschi et al. Genome Biol Evol. .

Abstract

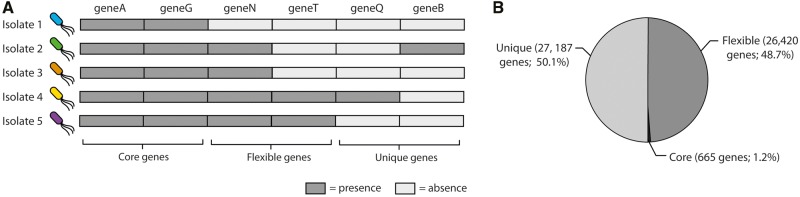
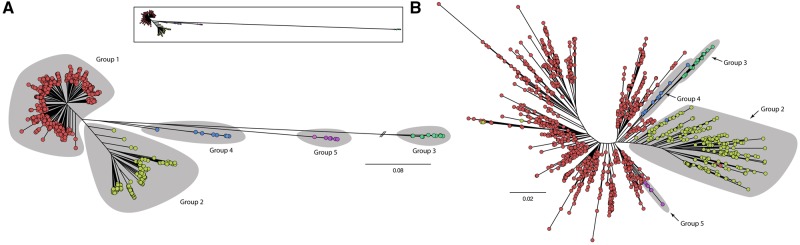
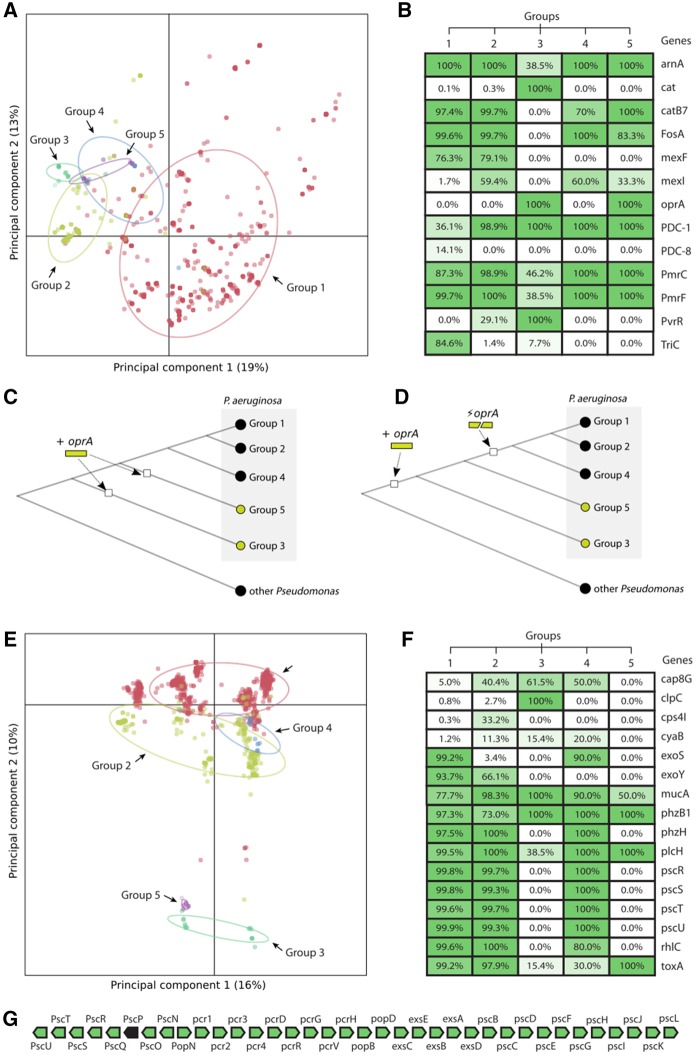
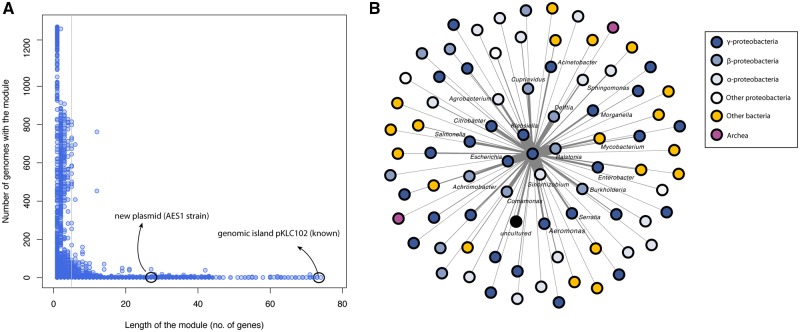
The huge increase in the availability of bacterial genomes led us to a point in which we can investigate and query pan-genomes, for example, the full set of genes of a given bacterial species or clade. Here, we used a data set of 1,311 high-quality genomes from the human pathogen Pseudomonas aeruginosa, 619 of which were newly sequenced, to show that a pan-genomic approach can greatly refine the population structure of bacterial species, provide new insights to define species boundaries, and generate hypotheses on the evolution of pathogenicity. The 665-gene P. aeruginosa core genome presented here, which constitutes only 1% of the entire pan-genome, is the first to be in the same order of magnitude as the minimal bacterial genome and represents a conservative estimate of the actual core genome. Moreover, the phylogeny based on this core genome provides strong evidence for a five-group population structure that includes two previously undescribed groups of isolates. Comparative genomics focusing on antimicrobial resistance and virulence genes showed that variation among isolates was partly linked to this population structure. Finally, we hypothesized that horizontal gene transfer had an important role in this respect, and found a total of 3,010 putative complete and fragmented plasmids, 5% and 12% of which contained resistance or virulence genes, respectively. This work provides data and strategies to study the evolutionary trajectories of resistance and virulence in P. aeruginosa.


Figures

<sc>Fig</sc>. 1.
Fig. 1.
—The P. aeruginosa pan-genome (A) a pan-genome is constituted by three types of genes: core, flexible, and unique. Core genes are present in all isolates of a given bacterial species, flexible genes are present in more than one isolates but not all of them, unique genes are present in one single isolate. (B) Pie chart showing the proportions of core, flexible and unique genes determined by SaturnV (https://github.com/ejfresch/saturnV; last accessed May 18, 2017). Unique genes constitute 51% of the P. aeruginosa pan-genome, whereas flexible genes constitute 48% of it. Core genes constitute only 1% of the pan-genome.
<sc>Fig</sc>. 2.
Fig. 2.
—Five groups of P. aeruginosa (A) Phylogenetic tree of all P. aeruginosa isolates calculated with all SNPs (n = 55,664) present in the 448 core genes that do not have paralog ambiguities (1:1 core genes). The different groups of isolates are highlighted by gray areas. Isolates belonging to each group are identified by a specific color (group 1: red; group 2: green; group 3: aquamarine; group 4: blue; group 5: violet). The small tree on the top of the panel shows the actual genetic distance between group 3 isolates and the other groups of isolates. (B) Tree representing the distances between isolates based on their genome architecture (calculated using flexible gene presence/absence, n = 26,420). Isolates belonging to each group are identified by a specific color (group 1: red; group 2: green; group 3: aquamarine; group 4: blue; group 5: violet).
<sc>Fig</sc>. 3.
Fig. 3.
—Links between population structure and the occurrence of resistance as well as virulence genes (A) PCA analysis of the profiles of predicted antibiotic resistance genes. Isolates belonging to each group are identified by a specific color (group 1: red; group 2: green; group 3: aquamarine; group 4: blue; group 5: violet). (B) Candidate genes that explain the differences between the five groups of isolates. The genes were hits in DAPC analyses. Percentage values represent isolates of a given group in which one particular antibiotic resistance gene was found, according to RGI (best hit ARO field). (C) First scenario to explain the evolutionary history of oprA: it has been acquired independently by the ancestors of group 3 and 5 isolates. (D) Second scenario to explain the evolutionary history of oprA: it has been acquired by the ancestor of all P. aeruginosa modern isolates and subsequently lost in the ancestor of group 1, 2, and 4 isolates. (E) PCA analysis of the profiles of predicted virulence factors. Isolates belonging to each group are identified by a specific color (group 1: red; group 2: green; group 3: aquamarine; group 4: blue; group 5: violet). (F) Candidate genes that explain the differences between the five groups of isolates. The genes were best hits of DAPC analyses. Percentage values represent isolates of a given group in which one particular virulence factor was found, according to usearch searches. (G) Stretch of 36 genes that codes for a type-three secretion system, which is missing from group 3 and 5 isolates (green: found in our DAPC analysis; black: not found in our DAPC analysis).
<sc>Fig</sc>. 4.
Fig. 4.
—Pan-genomic analysis of plasmid-mediated HGT (A) Frequency distribution of plasmid-gene modules, that is, adjacent genes with the same orientation (positive or negative strand) that match one or more sequences present on the NCBI database of plasmid proteins (sequence comparisons were performed at protein level). The gray line defines the threshold used to perform analyses (modules had to include 5 or more genes). Black circles define two examples (a known genetic island and an unknown plasmid) of regions we identified using this module approach that are related to HGT. (B) Network of bacterial genera that are likely to have exchanged plasmid genes with P. aeruginosa. The network was generated by getting the species information of the best match in the NCBI plasmid protein database for each of the genes present in the modules (sequence comparisons were performed at protein level). A force directed layout was applied to the graph so that the closer the nodes are to the center node, the more genes they exchanged with P. aeruginosa. Node colors reflects taxonomy. For clarity, only the names of the top candidate species are shown.

References

    1. Bodey GP, Bolivar R, Fainstein V, Jadeja L. 1983. Infections caused by Pseudomonas aeruginosa. Rev Infect Dis. 5(2):279–313. - PubMed
    1. Bosi E. 2016. Comparative genome-scale modelling of Staphylococcus aureus strains identifies strain-specific metabolic capabilities linked to pathogenicity. Proc Natl Acad Sci U S A. 113(26):E3801–E3809. - PMC - PubMed
    1. Chen L, Zheng D, Liu B, Yang J, Jin Q. 2016. VFDB 2016: hierarchical and refined dataset for big data analysis—10 years on. Nucleic Acids Res. 44(D1):D694–D697. - PMC - PubMed
    1. Criscuolo A, Gribaldo S. 2010. BMGE (block mapping and gathering with entropy): a new software for selection of phylogenetic informative regions from multiple sequence alignments. BMC Evol Biol. 10(1):210. - PMC - PubMed
    1. Dray S, Dufour A. 2007. The ade4 package: implementing the duality diagram for ecologists. J Stat Softw. 22:1–20.

Publication types

MeSH terms