Randomized Controlled Trial
. 2018 Nov 28;67(suppl_3):S284-S292.
doi: 10.1093/cid/ciy610.

Artificial intelligence-derived 3-Way Concentration-dependent Antagonism of Gatifloxacin, Pyrazinamide, and Rifampicin During Treatment of Pulmonary Tuberculosis

Affiliations
Randomized Controlled Trial

Artificial intelligence-derived 3-Way Concentration-dependent Antagonism of Gatifloxacin, Pyrazinamide, and Rifampicin During Treatment of Pulmonary Tuberculosis

Jotam G Pasipanodya et al. Clin Infect Dis. .

Abstract

Background: In the experimental arm of the OFLOTUB trial, gatifloxacin replaced ethambutol in the standard 4-month regimen for drug-susceptible pulmonary tuberculosis. The study included a nested pharmacokinetic (PK) study. We sought to determine if PK variability played a role in patient outcomes.

Methods: Patients recruited in the trial were followed for 24 months, and relapse ascertained using spoligotyping. Blood was drawn for drug concentrations on 2 separate days during the first 2 months of therapy, and compartmental PK analyses was performed. Failure to attain sustained sputum culture conversion at the end of treatment, relapse, or death during follow-up defined therapy failure. In addition to standard statistical analyses, we utilized an ensemble of machine-learning methods to identify patterns and predictors of therapy failure from among 27 clinical and laboratory features.

Results: Of 126 patients, 95 (75%) had favorable outcomes and 19 (15%) failed therapy, relapsed, or died. Pyrazinamide and rifampicin peak concentrations and area under the concentration-time curves (AUCs) were ranked higher (more important) than gatifloxacin AUCs. The distribution of individual drug concentrations and their ranking varied significantly between South African and West African trial sites; however, drug concentrations still accounted for 31% and 75% of variance of outcomes, respectively. We identified a 3-way antagonistic interaction of pyrazinamide, gatifloxacin, and rifampicin concentrations. These negative interactions disappeared if rifampicin peak concentration was above 7 mg/L.

Conclusions: Concentration-dependent antagonism contributed to death, relapse, and therapy failure but was abrogated by high rifampicin concentrations. Therefore, increasing both rifampin and gatifloxacin doses could improve outcomes.

Clinical trials registration: NCT00216385.


Figures

Figure 1.
Figure 1.
Distribution of drug doses and concentrations in the 126 study patients. (A) The distribution of gatifloxacin dose in milligrams per kilogram received by each patient is shown. (B) Distribution of the gatifloxacin 24-hour area under the concentration-time curve (AUC0-24) has a different shape from that of the dose since each patient has a different clearance of the drug due to pharmacokinetic (PK) variability. The median AUC0-24 (range) was 33.95 (5.27–94.92) mg*h/L. (C) Distribution of gatifloxacin peak (Cmax) concentration differs from the dose, indicating influence of between-patient variability in volume of distribution. (D) The distribution of rifampicin peak concentration; the ratio of the lowest-to-highest peak concentration was 9.0. (E) Distribution of pyrazinamide peak concentration was much narrower than for rifampin. (F) Distribution of isoniazid AUC was wide, with a highest-to-lowest AUC ratio of 13.5, to be expected given the acetylation rates in patients. Detailed description of the PKs of drugs used in the OFLOTUB trial, including the clearance and volume of distribution of each of these drugs in the study population, have been described y Smythe et al [7]. Abbreviations: AUC0-24, 24-hour area under the concentration-time curve; MIC, minimum inhibitory concentration.
Figure 2.
Figure 2.
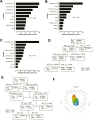
Artificial intelligence approach to identifying predictors of therapy failure. (A) The variable importance ranking from a random forests model, which started with 27 clinical, radiologic, and laboratory variables from 114 study patients. The ranking is produced by several classification and regression trees (CART) generated from the data “voting” for the variable most used as a surrogate or as a main variable for splitting data into homogenous groups. Here, the target variable was binary favorable outcome (ie, microbiologic cure) vs unfavorable (ie, microbiologic failure, relapse, or death) outcome. (B) The variable importance ranking from 47 patients from the West African sites. (C) Variable importance ranking in 67 patients from the South African sites. (D) Trees generated for predictors of patients from West Africa. All 8 patients who failed therapy had low rifampicin peak concentrations (≤7.01 mg/L) but pyrazinamide peak concentrations higher than 29.08 mg/L. (E) Boosted CART from South African patients; all 11 patients who failed therapy weighed ≥48 kg and also had low rifampicin peak concentration, although the threshold was slightly higher at 8.86 mg/L. (F) The impact of the interactions between gatifloxacin area under the concentration-time curve and rifampicin peak concentrations on outcome. Blue/green color zones indicate either drug concentrations with negative effects contributing to therapy failure, while brown/red color indicates drug concentration with positive effects associated with cure. Abbreviations: AUC0-24, 24-hour area under the concentration-time curve; BMI, body mass index; Fav, favorable; GATI, gatifloxacin, HIV, human immunodeficiency virus; PZA, pyrazinamide; RIF, rifampin; ROC, receiver operating characteristic; SS, steady state; Unfav, unfavorable.
Figure 3.
Figure 3.
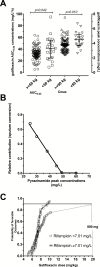
Statistical analyses approach to identifying predictors of therapy failure. (A) Gatifloxacin peak and 0–24 hour area under the concentration-time curve (AUC0-24) concentrations were significantly higher in patients with weight <50 kg compared to those with weight >50 kg. Mean ± standard deviation peak concentration was 4.42 ± 0.98 mg/L in patients weighing <50 kg and 3.79 ± 0.90 mg/L in patients >50 kg (P = .003). Similarly, gatifloxacin AUC0-24 concentrations were also significantly lower in heavier patients: 40.61 ± 17.57 mg*h/L in patients weighing <50 kg and 32.67 ± 11.23 mg/L*h in patients weighing >50 kg (P = .014). (B) Relative contribution of changes in pyrazinamide peak concentration basis function (BF) to probability of microbiologic cure, from Table 2 and equation 1. The BF was (0, 49.511 – pyrazinamide Cmax). Each decrease in pyrazinamide concentration below 49.511 mg/L contributes to lower microbiologic cure up to 27 mg/L conditional on low rifampin concentration. (C) Regression of probability of microbiologic cure vs gatifloxacin dose in milligrams per kilogram stratified by the rifampin peak concentration threshold of 7.01 mg/L identified by the machine-learning methods. Based on extrapolation of the data from 72 patients with rifampin peak concentration below thresholds, a minimum of 800 mg gatifloxacin dose would be required to attain cure in 90% of patients. Abbreviations: AUC0-24, 24-hour area under the concentration-time curve.

References

    1. Rustomjee R, Lienhardt C, Kanyok T, et al. ; Gatifloxacin for TB (OFLOTUB) Study Team. A phase II study of the sterilising activities of ofloxacin, gatifloxacin and moxifloxacin in pulmonary tuberculosis. Int J Tuberc Lung Dis 2008; 12:128–38. - PubMed
    1. Yoshimatsu T, Nuermberger E, Tyagi S, Chaisson R, Bishai W, Grosset J. Bactericidal activity of increasing daily and weekly doses of moxifloxacin in murine tuberculosis. Antimicrob Agents Chemother 2002; 46:1875–9. - PMC - PubMed
    1. Gumbo T, Louie A, Deziel MR, Parsons LM, Salfinger M, Drusano GL. Selection of a moxifloxacin dose that suppresses drug resistance in Mycobacterium tuberculosis, by use of an in vitro pharmacodynamic infection model and mathematical modeling. J Infect Dis 2004; 190:1642–51. - PubMed
    1. Lanoix JP, Chaisson RE, Nuermberger EL. Shortening tuberculosis treatment with fluoroquinolones: lost in translation?Clin Infect Dis 2016; 62:484–90. - PMC - PubMed
    1. Alffenaar JW, Gumbo T, Aarnoutse R. Shorter moxifloxacin-based regimens for drug-sensitive tuberculosis. N Engl J Med 2015; 372:576. - PubMed

Publication types

Associated data