. 2019 Feb 28;47(4):e20.
doi: 10.1093/nar/gky1204.

Recovery and analysis of transcriptome subsets from pooled single-cell RNA-seq libraries

Affiliations

Recovery and analysis of transcriptome subsets from pooled single-cell RNA-seq libraries

Kent A Riemondy et al. Nucleic Acids Res. .

Abstract

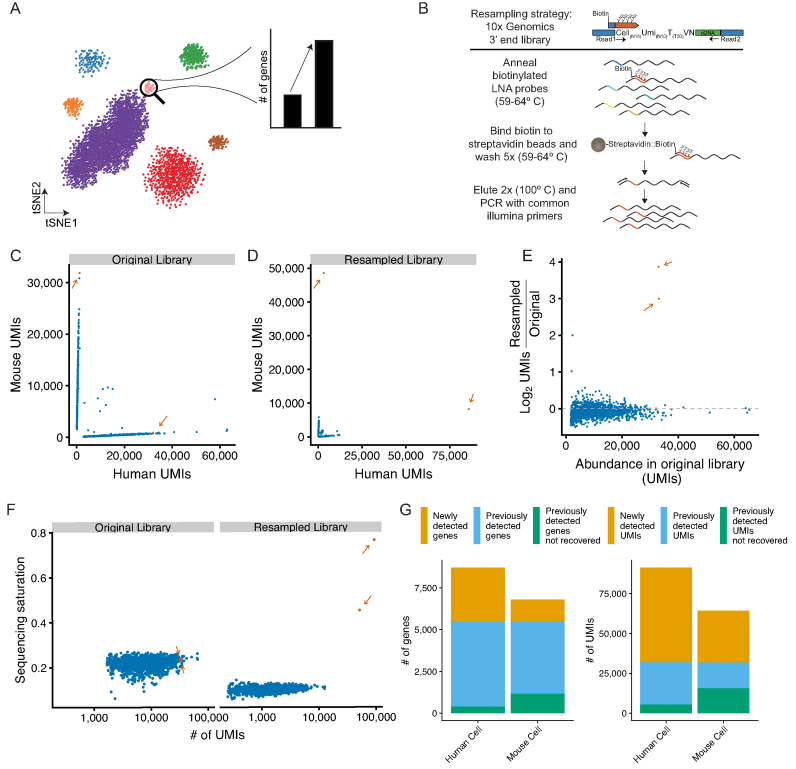
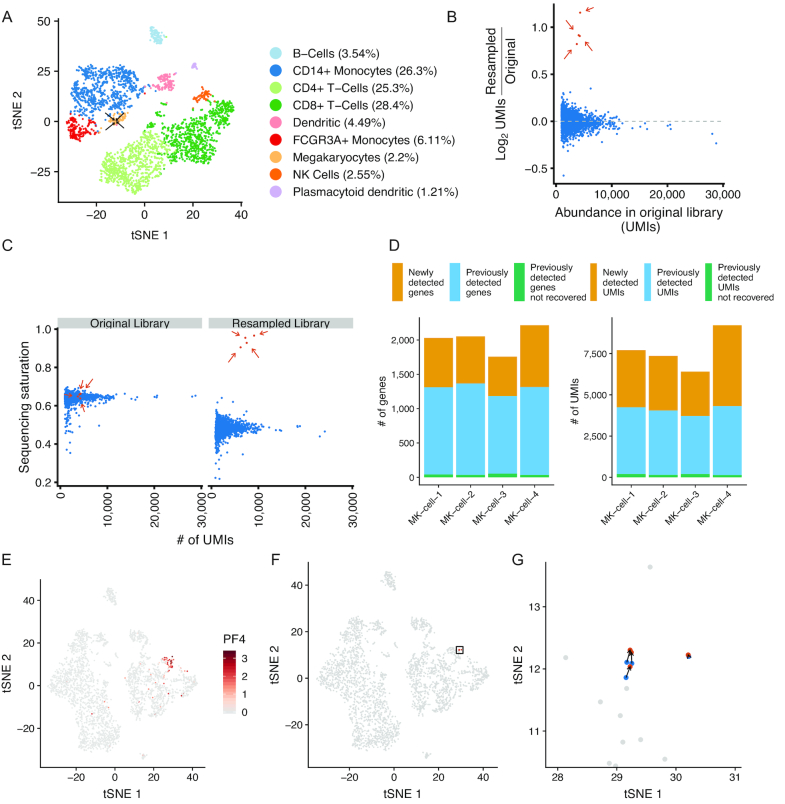
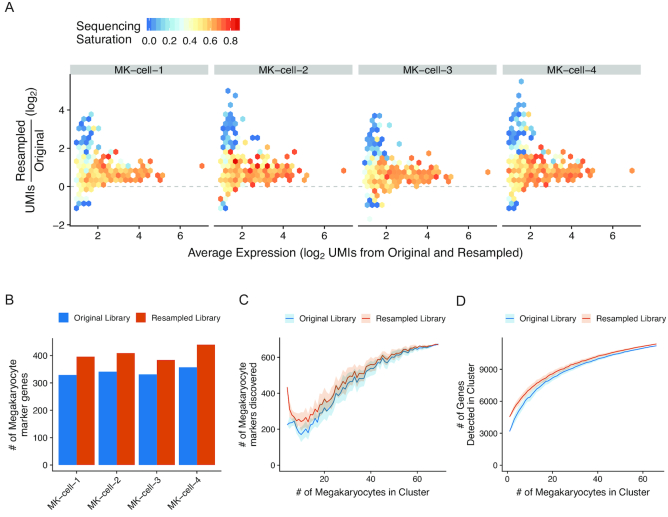
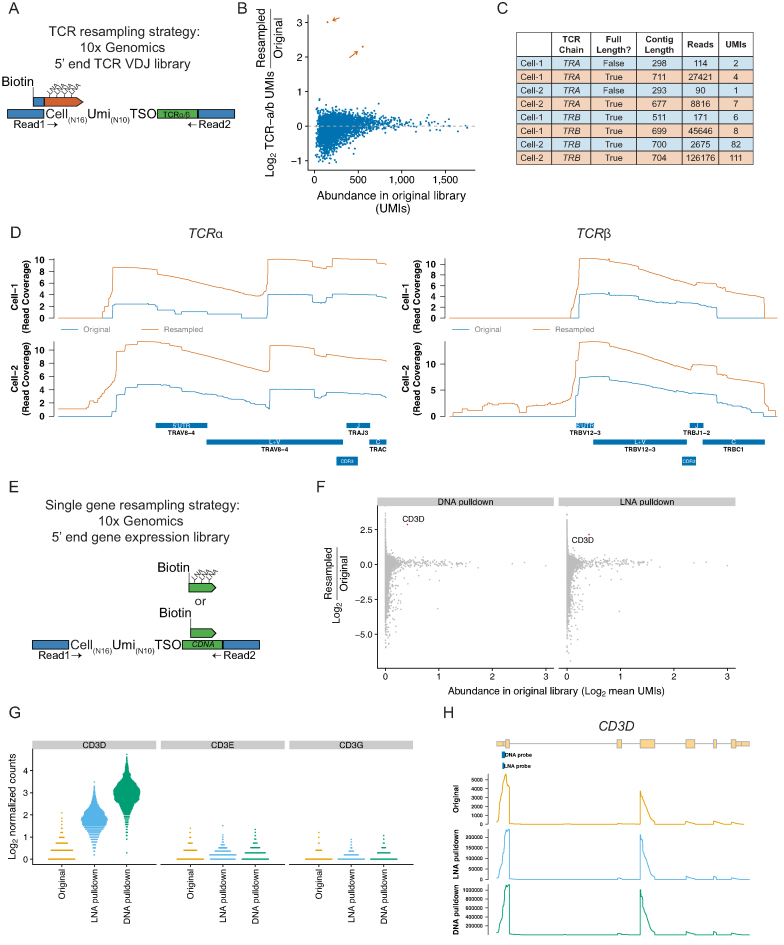
Single-cell RNA sequencing (scRNA-seq) methods generate sparse gene expression profiles for thousands of single cells in a single experiment. The information in these profiles is sufficient to classify cell types by distinct expression patterns but the high complexity of scRNA-seq libraries often prevents full characterization of transcriptomes from individual cells. To extract more focused gene expression information from scRNA-seq libraries, we developed a strategy to physically recover the DNA molecules comprising transcriptome subsets, enabling deeper interrogation of the isolated molecules by another round of DNA sequencing. We applied the method in cell-centric and gene-centric modes to isolate cDNA fragments from scRNA-seq libraries. First, we resampled the transcriptomes of rare, single megakaryocytes from a complex mixture of lymphocytes and analyzed them in a second round of DNA sequencing, yielding up to 20-fold greater sequencing depth per cell and increasing the number of genes detected per cell from a median of 1313 to 2002. We similarly isolated mRNAs from targeted T cells to improve the reconstruction of their VDJ-rearranged immune receptor mRNAs. Second, we isolated CD3D mRNA fragments expressed across cells in a scRNA-seq library prepared from a clonal T cell line, increasing the number of cells with detected CD3D expression from 59.7% to 100%. Transcriptome resampling is a general approach to recover targeted gene expression information from single-cell RNA sequencing libraries that enhances the utility of these costly experiments, and may be applicable to the targeted recovery of molecules from other single-cell assays.


Figures

Figure 1.
Figure 1.
Resampling specific cell transcriptomes from pooled single-cell RNA-seq libraries. (A) Resampling single cell libraries from rare cell populations to enable deeper characterization of a targeted cell type. (B) Schematic of Locked Nucleic Acid (LNA) hybridization-based approach to enrich mRNAs from targeted cells from 10X Genomics single-cell mRNA-seq libraries. (C) Species specificity of cells recovered from a 10X Genomics 3′ end gene expression scRNA-seq library containing a 1:1 mix of mouse (NIH-3T3) and human (293T) cells. Orange dots and arrows (n = 2) indicate cells selected for resampling; blue dots (n = 1505) are untargeted cells. (D) Species specificity of cells from the resampled library. Colors are are the same as in C. (E) Enrichment of targeted libraries after resampling. The y-axis plots the log2 enrichment of UMIs normalized by the size of the entire scRNA-seq library. Colors are the same as in C. (F) Sequencing saturation, as defined by 1 minus the ratio of the number of UMIs to the number of reads, per cell for resampled and untargeted cells in the original scRNA-seq library or after resampling. Colors are the same as in C. (G) Number of genes (left) or UMIs (right) in the resampled cells that are either newly detected by resampling (orange), previously detected in the original library (blue), or previously detected in the original library but not found after resampling (green).
Figure 2.
Figure 2.
Resampling rare megakaryocytes from peripheral blood mononuclear cells. (A) tSNE projection of a sample of peripheral blood mononuclear cells (PBMCs; n = 3194 cells) with cells labeled by their inferred cell type. Arrows indicate megakaryocytes selected for resampling (n = 4 resampled megakaryocytes; n = 69 total megakaryocytes). (B) Enrichment of UMIs in targeted cells following resampling. Y-axis indicates log2 enrichment of UMIs normalized by library size of the entire resampled scRNA-seq library. Orange dots and arrows (n = 4) indicate cells selected for resampling; blue dots (n = 3190) are untargeted cells. (C) Sequencing saturation of the targeted cells in the original library and after resampling. Colors are the same as in B. (D) Number of genes or UMIs in the resampled megakaryocyte (MK) cells that are either newly detected in the resampled library (orange), previously detected in the original library (blue), or previously detected in the original library but not found after resampling (green). (E) tSNE projection of the original scRNA-seq dataset supplemented with the resampled cells. Cells are colored by the expression (natural log) of the megakaryocyte marker PF4. (F) tSNE with the original cell transcriptomes (blue), resampled transcriptomes (orange), and non-targeted cells (gray). The rectangle indicates the location of cells highlighted in panel G. (G) tSNE projection of resampled cells in the region highlighted in panel F.
Figure 3.
Figure 3.
Enrichment of megakaryocyte markers in resampled cells. (A) Relationship between sequencing saturation and enrichment of genes in the resampled libraries. X-axis indicates the normalized expression as the average of the expression values in the original and resampled libraries. Y-axis indicates UMI enrichment. Genes are binned into hexagons colored by their sequencing saturation (1 – UMIs/reads) calculated from the original library values (scale bar from 0 to 1.0). For genes not detected in the original library, the average sequencing saturation from all megakaryocytes is displayed. (B) The number of genes recovered in each resampled cell that were defined as megakaryocyte markers in the original scRNA-seq dataset. Orange dots are for the resampled libraries; blue is from the original. (C) Markers for megakaryocytes were calculated using the resampled cells (first set of dots), using either the UMI counts from the original library (blue dots) or the UMI counts from the resampled library (orange dots). The same procedure was repeated with increasing numbers of randomly selected non-resampled megakaryocytes supplementing the resampled cells. The random selection was repeated 10 times and the average is shown with the standard deviation displayed in the shaded areas. (D) Number of unique genes detected in a hypothetical megakaryocyte cluster containing the cells selected for resampling from the resampled library (orange line) or the original library (blue line) with increasing numbers of randomly selected non-targeted megakaryocytes supplementing the resampled cells. The random selection was repeated 100 times and the average is shown with the standard deviation displayed in the shaded areas.
Figure 4.
Figure 4.
Resampling individual mRNAs and TCR sequences. (A) Schematic of hybridization method applied to resampling single cell VDJ sequences from a 5′ end VDJ enrichment library. (B) Enrichment of UMIs derived from the TCR alpha or TCR beta chains for the targeted cells (resampled cells; n = 2, shown in orange). (C) Summary statistics of the TCR assemblies from the original (blue) or resampled libraries (orange). *Note that UMIs with less than 10 reads were excluded from the assembly and are not included in the displayed UMI and read counts. (D) Read coverage (Log scale) across the consensus Jurkat TCR-alpha and TCR-beta sequences in the original library (blue) or the resampled library (orange). (E) Schematic of hybridization method applied to resampling a single mRNA from a 5′ end gene expression library. Hybridization probes were designed with LNA nucleotides or with only DNA. (F) Average fold-change of normalized UMI counts across all cells after resampling with a DNA only oligo or an LNA oligo targeting CD3D. X-axis indicates the normalized expression as average of the expression values in the original and resampled libraries. (G) CD3 expression per cell for each CD3 chain. (H) Read coverage across CD3D in the original or resampled libraries.

Similar articles

Cited by

References

    1. Zheng G.X.Y., Terry J.M., Belgrader P., Ryvkin P., Bent Z.W., Wilson R., Ziraldo S.B., Wheeler T.D., McDermott G.P., Zhu J. et al. . Massively parallel digital transcriptional profiling of single cells. Nat. Commun. 2017; 8:14049. - PMC - PubMed
    1. Macosko E.Z., Basu A., Satija R., Nemesh J., Shekhar K., Goldman M., Tirosh I., Bialas A.R., Kamitaki N., Martersteck E.M. et al. . Highly parallel Genome-wide expression profiling of individual cells using nanoliter droplets. Cell. 2015; 161:1202–1214. - PMC - PubMed
    1. Klein A.M., Mazutis L., Akartuna I., Tallapragada N., Veres A., Li V., Peshkin L., Weitz D.A., Kirschner M.W.. Droplet barcoding for single-cell transcriptomics applied to embryonic stem cells. Cell. 2015; 161:1187–1201. - PMC - PubMed
    1. Cao J., Packer J.S., Ramani V., Cusanovich D.A., Huynh C., Daza R., Qiu X., Lee C., Furlan S.N., Steemers F.J. et al. . Comprehensive single-cell transcriptional profiling of a multicellular organism. Science. 2017; 357:661–667. - PMC - PubMed
    1. Pollen A.A., Nowakowski T.J., Shuga J., Wang X., Leyrat A.A., Lui J.H., Li N., Szpankowski L., Fowler B., Chen P. et al. . Low-coverage single-cell mRNA sequencing reveals cellular heterogeneity and activated signaling pathways in developing cerebral cortex. Nat. Biotechnol. 2014; 32:1053–1058. - PMC - PubMed

Publication types