. 2019 Feb 20;47(3):1255-1267.
doi: 10.1093/nar/gky1207.

Super-enhancer-associated MEIS1 promotes transcriptional dysregulation in Ewing sarcoma in co-operation with EWS-FLI1

Affiliations

Super-enhancer-associated MEIS1 promotes transcriptional dysregulation in Ewing sarcoma in co-operation with EWS-FLI1

Lehang Lin et al. Nucleic Acids Res. .

Abstract

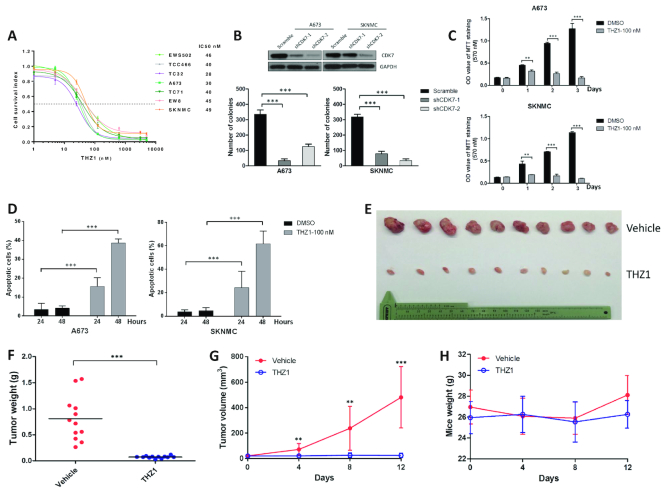
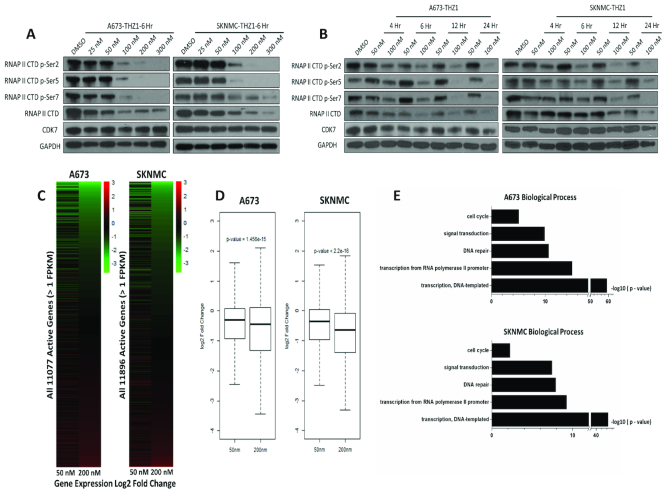
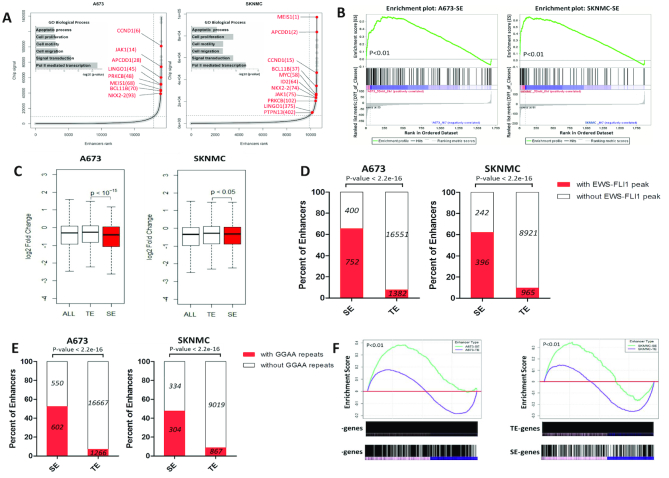
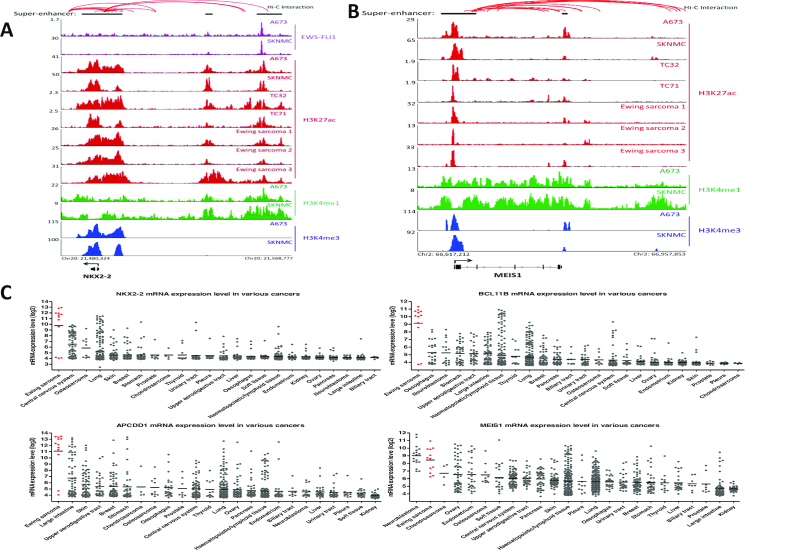
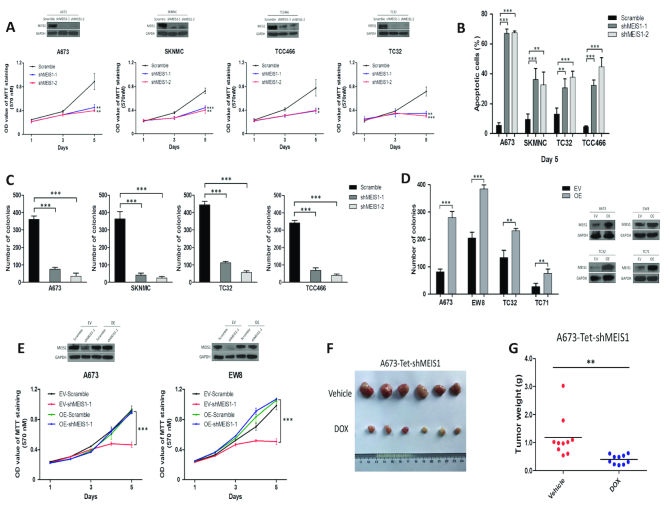
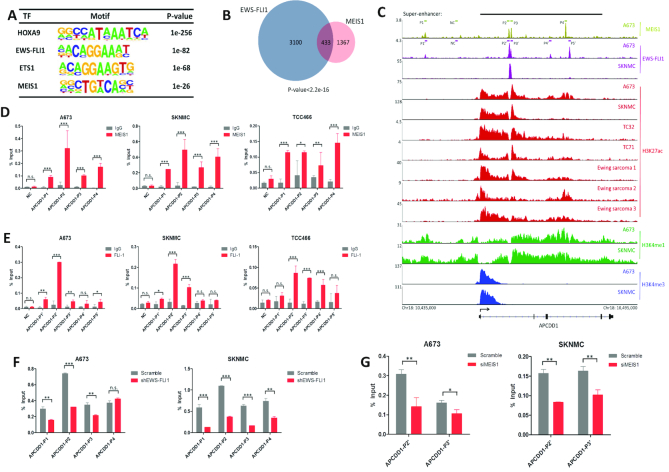
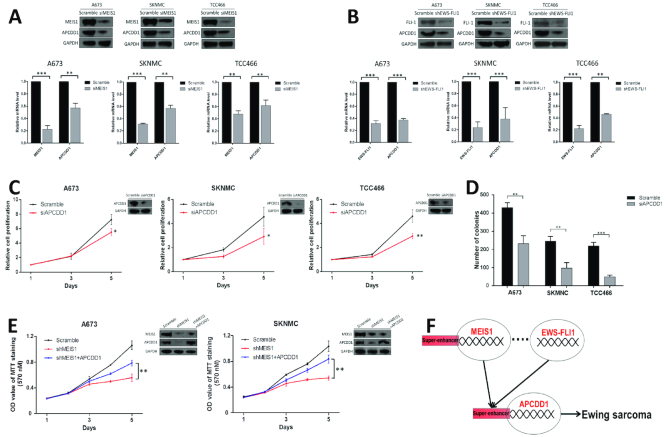
As the second most common malignant bone tumor in children and adolescents, Ewing sarcoma is initiated and exacerbated by a chimeric oncoprotein, most commonly, EWS-FLI1. In this study, we apply epigenomic analysis to characterize the transcription dysregulation in this cancer, focusing on the investigation of super-enhancer and its associated transcriptional regulatory mechanisms. We demonstrate that super-enhancer-associated transcripts are significantly enriched in EWS-FLI1 target genes, contribute to the aberrant transcriptional network of the disease, and mediate the exceptional sensitivity of Ewing sarcoma to transcriptional inhibition. Through integrative analysis, we identify MEIS1 as a super-enhancer-driven oncogene, which co-operates with EWS-FLI1 in transcriptional regulation, and plays a key pro-survival role in Ewing sarcoma. Moreover, APCDD1, another super-enhancer-associated gene, acting as a downstream target of both MEIS1 and EWS-FLI1, is also characterized as a novel tumor-promoting factor in this malignancy. These data delineate super-enhancer-mediated transcriptional deregulation in Ewing sarcoma, and uncover numerous candidate oncogenes which can be exploited for further understanding of the molecular pathogenesis for this disease.


Figures

Figure 1.
Figure 1.
THZ1 exhibits strong anti-neoplastic property against Ewing sarcoma. (A) Dose-response curves of 7 Ewing sarcoma cell lines to THZ1 treatment for 72 hr. IC50 values were measured by MTT assay. Data were represented as mean ± SD of three replicates. (B) A673 and SKMNC cells stably expressing either CDK7-specific shRNAs or scrambled shRNA control (Scramble) were subjected to immunoblotting assay (upper panel) and colony formation assay (lower panel). Bars represent mean ± SD of three replicates (*** P < 0.001). (C) MTT assay and (D) apoptosis assay showing the effect of THZ1 treatment on Ewing sarcoma cell lines at indicated time points. Bars represent mean ± SD of three replicates (**P < 0.01, ***P < 0.001). (E–G) THZ1 suppressed the growth of A673 xenografts. (E) Images and (F) weights of resected tumors from both vehicle and THZ1 treatment groups at the end point. (G) Tumor volumes of mice treated either with vehicle or THZ1. Data represent mean ± SD of each group (**P < 0.01, ***P < 0.001). (H) No significant loss of body weight was observed in mice during treatment.
Figure 2.
Figure 2.
THZ1 selectively inhibits RNAPII-mediated transcription in Ewing sarcoma, (AB) Immunoblotting analyses of RNAP II CTD phosphorylation in A673 and SKMNC cells treated either with THZ1 or DMSO at the indicated concentrations for the indicated durations. (C) Heatmap and (D) Box plots showing changes in gene expression in A673 and SKNMC cells following treatment with either 50 or 200 nM THZ1 for 6 h. (E) Selected Gene ontology (GO) functional categories of transcripts decreased over 2-fold in A673 and SKNMC cells following 50 nM THZ1 treatment for 6 h.
Figure 3.
Figure 3.
Profiling of super-enhancer landscapes in Ewing sarcoma cell lines, (A) Hockey stick plots showing rank order of H3K27ac signals for all enhancers in A673 and SKNMC cells. Inserted panels showing selected GO functional categories of super-enhancer-associated genes. (B) Gene Set Enrichment analysis (GSEA) of the fold changes of super-enhancer (SE)-associated transcripts following treatment with 50 nM THZ1 for 6 h in A673 and SKNMC. (C) Box plots showing log2 fold changes of transcripts associated with typical-enhancer (TE) and SE upon 50 nM THZ1 treatment for 6 h in A673 and SKNMC. (D, E) Pearson's Chi-squared tests showed SE regions had significantly more (D) EWS-FLI1 binding peaks and (E) motif (GGAA repeats) than TE regions. EWS-FLI1 ChIP-seq data are publicly accessible on NCBI GEO under the accession number ‘GSE61953′. (F) GSEA of the fold changes of either SE- or TE-associated transcripts upon EWS-FLI1 depletion (48 hr) in A673 and SKNMC cells. Gene expression data for A673 and SKNMC cells in either the presence or absence of EWS-FLI1 knockdown were also obtained from NCBI GEO (GSE61953).
Figure 4.
Figure 4.
Nomination of super-enhancer-associated transcripts in Ewing sarcoma, (AB) ChIP-seq profiles of EWS-FLI1, H3K27ac, H3K4me1 and H3K4me3 at representative super-enhancer-associated gene loci across Ewing sarcoma cell lines and primary tumors. Y axis represents the value of reads per million per base pair (rpm/bp). Above the ChIP-seq profiles were interactions among cis-regulatory elements in SKNMC cells predicted by Hi-C from ENCODE project, and visualized using public browser (http://promoter.bx.psu.edu/hi-c/index.html). (C) Data retrieved from CCLE project depicting mRNA expression of representative super-enhancer-associated transcripts across various types of human cancer cells.
Figure 5.
Figure 5.
Oncogenic function of MEIS1 in Ewing sarcoma, (A) MTT assay, (B) apoptosis assay and (C) soft-agar assay evaluating the knockdown effects of MEIS1 on Ewing sarcoma cells. Error bars represent mean ± SD of three replicates (*P < 0.05, **P < 0.01, ***P < 0.001). Efficiency of MEIS1 knockdown in Ewing sarcoma cells was shown by immunoblotting assays. (D) Ewing sarcoma cells were stably transfected with either empty vector (EV) or plasmid encoding MEIS1 (OE). Immunoblotting was performed to determine MEIS1 expression, and cell anchorage-independent growth was measured by soft agar assay. Error bars represent mean ± SD of three replicates (**P < 0.01, *** P < 0.001). (E) A673 and EW8 cells stably expressing indicated plasmids were infected again with either shMEIS1 or shRNA control (Scramble), and subjected to immunoblotting and MTT assays. Bars represent mean ± SD of three replicates (***P < 0.001). (F–G) Nude mice were inoculated subcutaneously with A673 cells stably expressing inducible MEIS1 shRNA (A673-Tet-shMEIS1). Mice were randomly allocated to either doxycycline (DOX)-treated or vehicle-treated groups (n = 5 per group). (F) Representative images and (G) weights of resected tumors at the end point (**P < 0.01).
Figure 6.
Figure 6.
MEIS1 and EWS-FLI1 directly co-bind super-enhancer regions of APCDD1, (A) Homer Motif Enrichment results of known transcription factor binding motifs enriched at MEIS1 binding regions in A673 cells. (B) Venn diagram displaying the overlap between EWS-FLI1 and MEIS1 peaks in A673 cells. P value was calculated using Fisher's exact test. (C) Integrative Genomics Viewer showing MEIS1, EWS-FLI1, H3K27ac, H3K4me1 and H3K4me3 occupancy in APCDD1 gene in A673 and SKNMC cells as well as primary tumors. Olive and purple bars indicate template regions subjected to ChIP-qPCR experiments. (D-E) Confirmation of selected (D) MEIS1 and (E) EWS-FLI1 binding sites in APCDD1 locus by ChIP-qPCR. NC, negative control. Error bars represent mean ± SD of three replicates (n.s., statistically no significance, *P < 0.05, **P < 0.01, ***P < 0.001). (F–G) Either (F) EWS-FLI1 or (G) MEIS1 was silenced in A673 and SKNMC cells, and antibodies against either (F) MEIS1 or (G) FLI-1 were used to determine the transcription fator change in occupancy at selected regions of APCDD1 by ChIP-qPCR. Error bars represent mean ± SD of three replicates (n.s., statistically no significance, *P < 0.05, **P < 0.01, ***P < 0.001).
Figure 7.
Figure 7.
APCDD1 is co-regulated by MEIS1 and EWS-FLI1 and mediates the oncogenic role of MEIS1. (A, B) Silencing of (A) MEIS1 or (B) EWS-FLI1 downregulated expression of both APCDD1 mRNA and protein. Error bars represent mean ± SD of three replicates (**P < 0.01, ***P < 0.001). (C, D) APCDD1 knockdown potently (C) inhibited cell proliferation and (D) decreased colony formation. Error bars represent mean ± SD of three replicates (*P < 0.05, **P < 0.01, ***P < 0.001). (E) A673 and SKNMC cells stably expressing shMEIS1 were transiently transfected with plasmid encoding APCDD1, and subjected to immunoblotting and MTT assays. Bars represent mean ± SD of three replicates (**P < 0.01). (F) Proposed model showing that MEIS1 and EWS-FLI1 co-operatively activate APCDD1 transcription, thereby promoting the malignant phenotype of Ewing sarcoma cells.

Similar articles

Cited by

References

    1. Stoll G., Surdez D., Tirode F., Laud K., Barillot E., Zinovyev A., Delattre O.. Systems biology of Ewing sarcoma: a network model of EWS-FLI1 effect on proliferation and apoptosis. Nucleic Acids Res. 2013; 41:8853–8871. - PMC - PubMed
    1. Mackintosh C., Madoz-Gurpide J., Ordonez J.L., Osuna D., Herrero-Martin D.. The molecular pathogenesis of Ewing's sarcoma. Cancer Biol. Ther. 2010; 9:655–667. - PubMed
    1. Riggi N., Stamenkovic I.. The biology of Ewing sarcoma. Cancer Lett. 2007; 254:1–10. - PubMed
    1. Riggi N., Knoechel B., Gillespie S.M., Rheinbay E., Boulay G., Suva M.L., Rossetti N.E., Boonseng W.E., Oksuz O., Cook E.B. et al. . EWS-FLI1 utilizes divergent chromatin remodeling mechanisms to directly activate or repress enhancer elements in Ewing sarcoma. Cancer Cell. 26:668–681. - PMC - PubMed
    1. Tomazou E.M., Sheffield N.C., Schmidl C., Schuster M., Schonegger A., Datlinger P., Kubicek S., Bock C., Kovar H.. Epigenome mapping reveals distinct modes of gene regulation and widespread enhancer reprogramming by the oncogenic fusion protein EWS-FLI1. Cell Rep. 2015; 10:1082–1095. - PMC - PubMed

Publication types

MeSH terms

Substances