

Macula Vessel Density and Thickness in Early Primary Open-Angle Glaucoma
- PMID: 30496723
- PMCID: PMC6382614
- DOI: 10.1016/j.ajo.2018.11.012
Macula Vessel Density and Thickness in Early Primary Open-Angle Glaucoma
Abstract
Purpose: To characterize and compare the ganglion cell complex (GCC) thickness and macula vessel density in preperimetric and early primary open-angle glaucoma (POAG) eyes.
Design: Cross-sectional study.
Methods: Fifty-seven healthy, 68 preperimetric, and 162 early POAG eyes enrolled in the Diagnostic Innovations in Glaucoma Study. Optical coherence tomography angiography (OCT-A)-based superficial macula vessel density and OCT-based GCC thickness were evaluated simultaneously. Percent loss from normal of GCC thickness and macula vessel density was compared. Area under the receiver operating characteristic curve was used to describe the diagnostic utility.
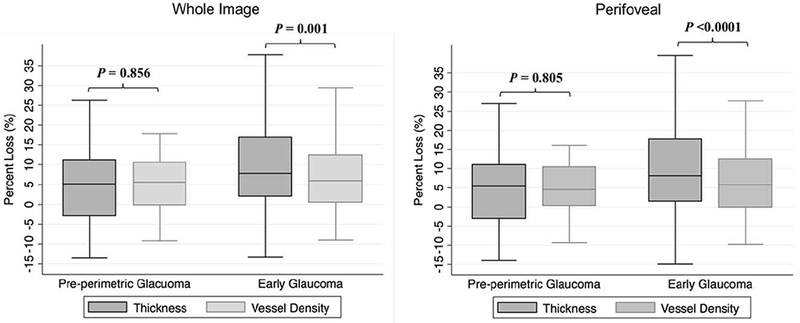
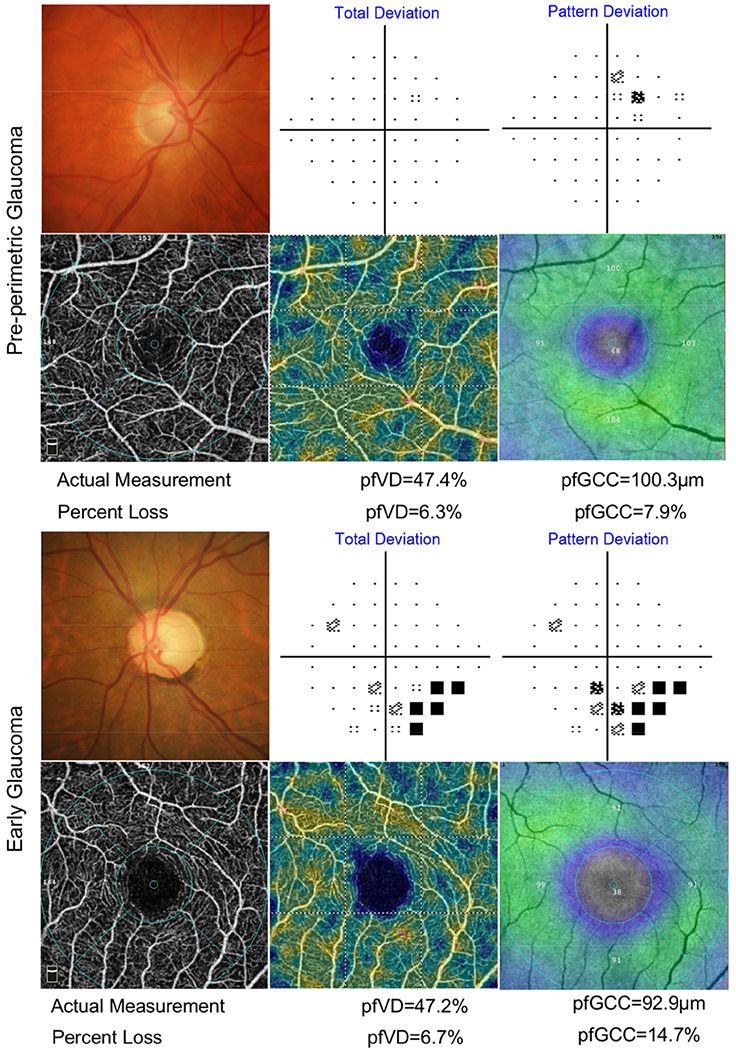
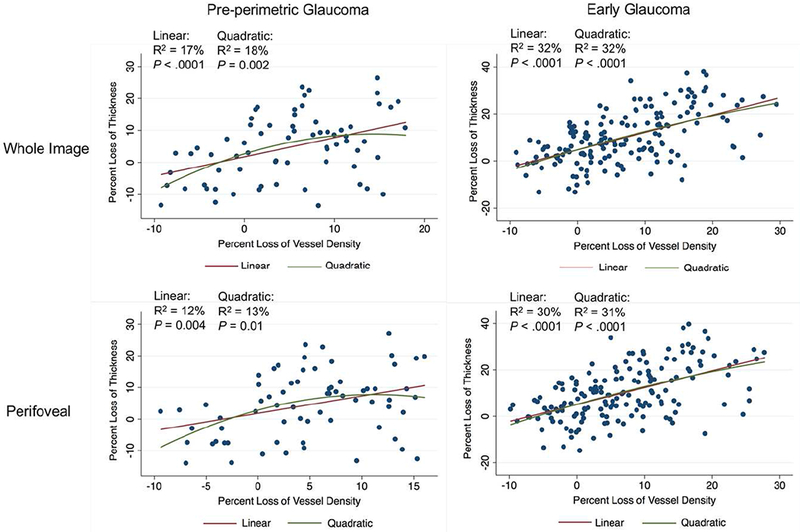
Results: Both GCC thickness and vessel density were significantly lower in preperimetric and early POAG eyes compared to healthy eyes. Compared to the preperimetric POAG group, the early POAG group showed larger GCC thickness percent loss (whole image 4.72% vs 9.86%; all P < .01) but similar vessel density percent loss (whole image 4.97% vs 6.93%; all P > .05). In preperimetric POAG, GCC thickness and vessel density percent losses were similar (all P > .1). In contrast, in early POAG, GCC thickness percent loss was larger than that of vessel density (all P ≤ .001). To discriminate preperimetric or early glaucoma eyes from healthy eyes, GCC thickness and macula vessel density showed similar diagnostic accuracy (all P > .05).
Conclusions: Both GCC thinning and macula vessel density dropout were detectable in preperimetric and early POAG eyes. GCC loss was greater than macula vessel density loss in early perimetric POAG. However, OCT-A and OCT measurements showed similar efficiency to detect early glaucoma.
Copyright © 2018 Elsevier Inc. All rights reserved.
Figures
Similar articles
-
Ganglion Cell Complex Thickness and Macular Vessel Density Loss in Primary Open-Angle Glaucoma.Ophthalmology. 2020 Aug;127(8):1043-1052. doi: 10.1016/j.ophtha.2019.12.030. Epub 2020 Jan 13. Ophthalmology. 2020. PMID: 32085875 Free PMC article.
-
Progressive Macula Vessel Density Loss in Primary Open-Angle Glaucoma: A Longitudinal Study.Am J Ophthalmol. 2017 Oct;182:107-117. doi: 10.1016/j.ajo.2017.07.011. Epub 2017 Jul 20. Am J Ophthalmol. 2017. PMID: 28734815 Free PMC article.
-
Quantitative Analysis of Microvasculature in Macular and Peripapillary Regions in Early Primary Open-Angle Glaucoma.Curr Eye Res. 2020 May;45(5):629-635. doi: 10.1080/02713683.2019.1676912. Epub 2019 Oct 14. Curr Eye Res. 2020. PMID: 31587582
-
Utility of Ganglion Cell Complex Analysis in Early Diagnosis and Monitoring of Glaucoma using a Different Spectral Domain Optical Coherence Tomography.J Curr Glaucoma Pract. 2014 Sep-Dec;8(3):101-6. doi: 10.5005/jp-journals-10008-1171. Epub 2015 Jan 15. J Curr Glaucoma Pract. 2014. PMID: 26997820 Free PMC article. Review.
-
Macular Thickness Variability in Primary Open Angle Glaucoma Patients using Optical Coherence Tomography.J Curr Glaucoma Pract. 2014 Jan-Apr;8(1):10-4. doi: 10.5005/jp-journals-10008-1154. Epub 2014 Jan 16. J Curr Glaucoma Pract. 2014. PMID: 26997801 Free PMC article. Review.
Cited by
-
Effects of Tafluprost on Ocular Blood Flow.Ophthalmol Ther. 2022 Dec;11(6):1991-2003. doi: 10.1007/s40123-022-00566-z. Epub 2022 Sep 15. Ophthalmol Ther. 2022. PMID: 36109465 Free PMC article. Review.
-
Capillary Density Measured by Optical Coherence Tomography Angiography in Glaucomatous Optic Disc Phenotypes.Am J Ophthalmol. 2020 Nov;219:261-270. doi: 10.1016/j.ajo.2020.06.012. Epub 2020 Jun 17. Am J Ophthalmol. 2020. PMID: 32561168 Free PMC article.
-
Quantitative assessment of retinal thickness and vessel density using optical coherence tomography angiography in patients with Alzheimer's disease and glaucoma.PLoS One. 2021 Mar 19;16(3):e0248284. doi: 10.1371/journal.pone.0248284. eCollection 2021. PLoS One. 2021. PMID: 33739997 Free PMC article.
-
Elevated Intraocular Pressure Causes Abnormal Reactivity of Mouse Retinal Arterioles.Oxid Med Cell Longev. 2019 Dec 29;2019:9736047. doi: 10.1155/2019/9736047. eCollection 2019. Oxid Med Cell Longev. 2019. PMID: 31976030 Free PMC article.
-
Applications of optical coherence tomography angiography in glaucoma: current status and future directions.Front Med (Lausanne). 2024 Sep 19;11:1428850. doi: 10.3389/fmed.2024.1428850. eCollection 2024. Front Med (Lausanne). 2024. PMID: 39364027 Free PMC article. Review.
References
-
- Weinreb RN, Khaw PT. Primary open-angle glaucoma. Lancet 2004; 363(9422): 1711–20. - PubMed
-
- Flammer J, Orgul S, Costa VP, et al. The impact of ocular blood flow in glaucoma. Prog Retin Eye Res 2002; 21(4): 359–93. - PubMed
-
- Grieshaber MC, Mozaffarieh M, Flammer J. What is the link between vascular dysregulation and glaucoma? Surv Ophthalmol 2007; 52 Suppl 2: S144–54. - PubMed
