. 2018 Nov 29;37(1):295.
doi: 10.1186/s13046-018-0949-2.

GPR119 agonist enhances gefitinib responsiveness through lactate-mediated inhibition of autophagy

Affiliations

GPR119 agonist enhances gefitinib responsiveness through lactate-mediated inhibition of autophagy

Ji Hye Im et al. J Exp Clin Cancer Res. .

Erratum in

Abstract

Background: Ligand-dependent activation of the G-protein coupled receptor 119 (GPR119) lowers blood glucose via glucose-dependent insulin secretion and intestinal glucagon-like peptide-1 production. However, the function of GPR119 in cancer cells has not been studied.

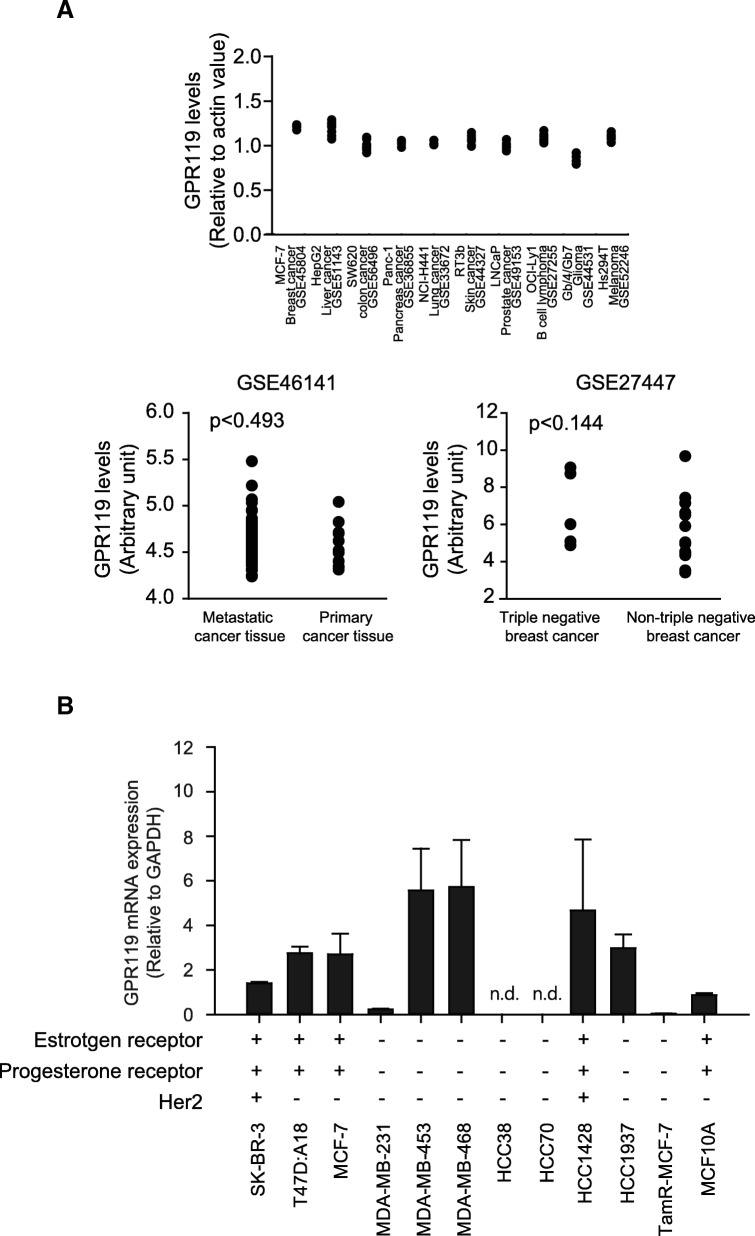
Methods: GPR119 expression was assessed by real-time qPCR and immunohistochemistry in human breast cancer cell lines and breast cancer tissues. Cell proliferation and cell cycle analyses were performed by Incucyte® live cell analysis system and flow cutometry, respectively. Autophagy activity was estimeated by western blottings and LC3-GFP transfection.

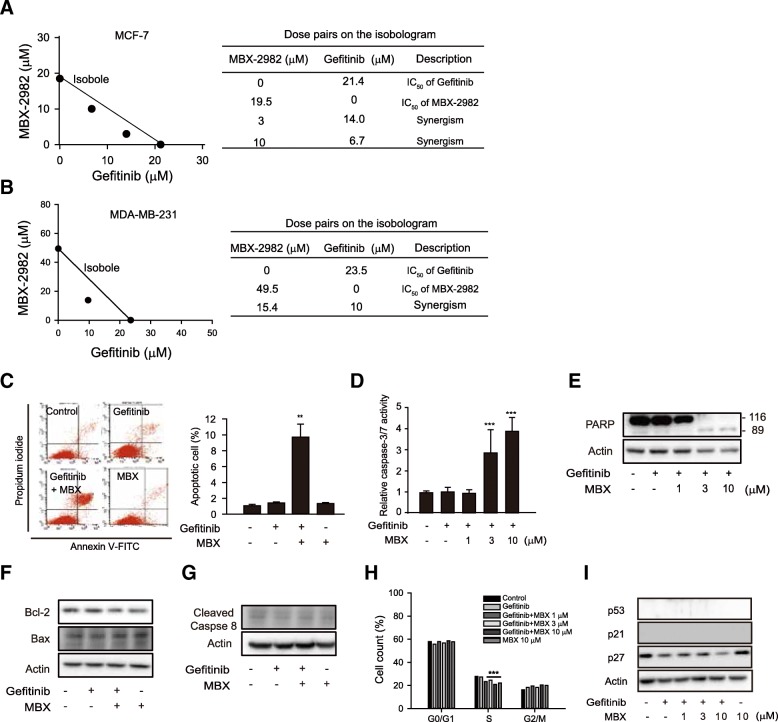
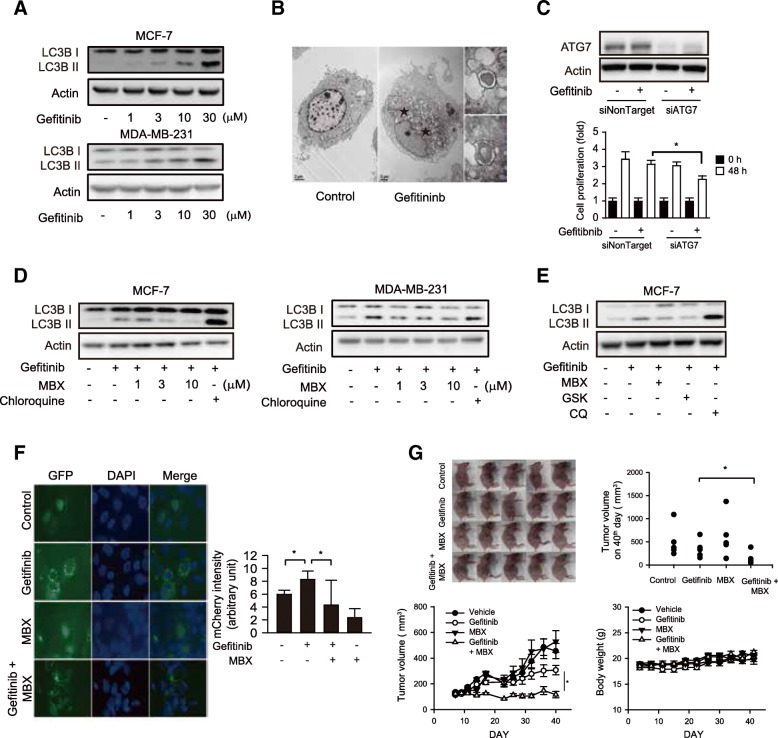
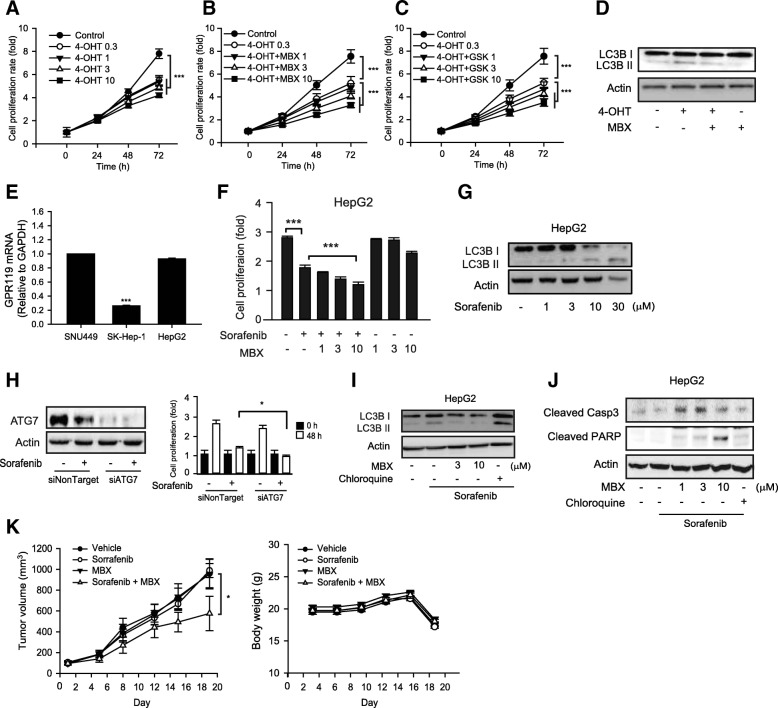
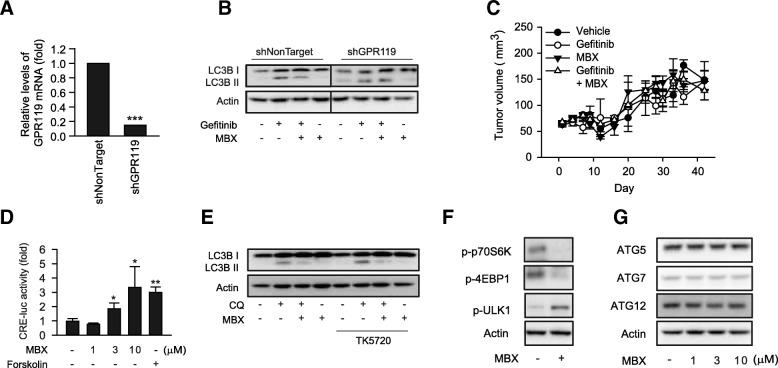
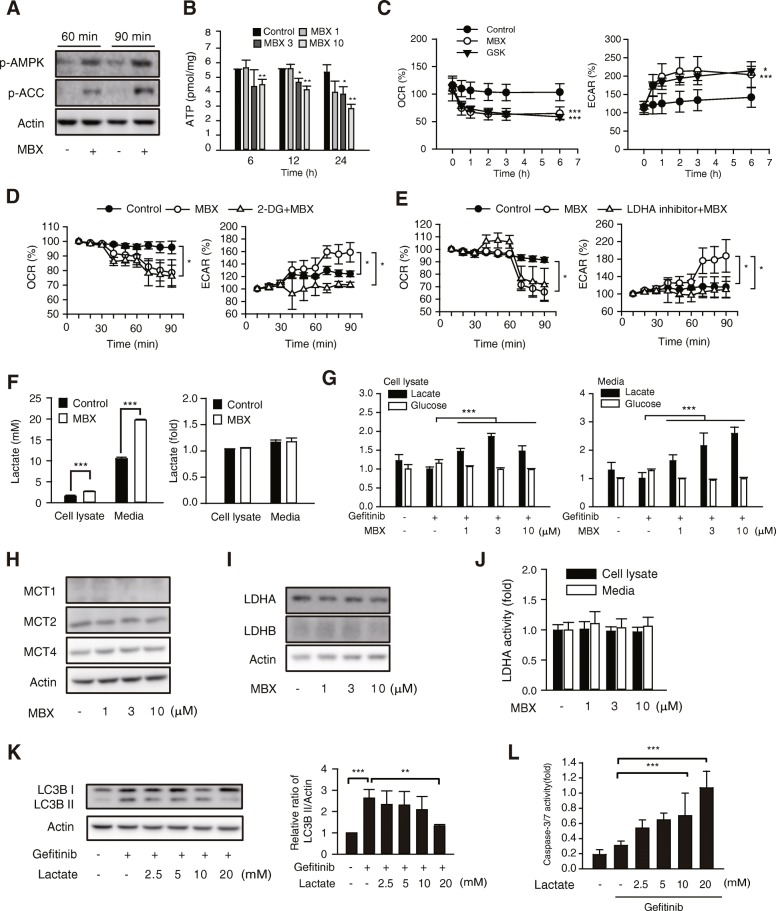
Results: mRNA or protein expression of GPR119 was detected in 9 cancer cell lines and 19 tissue samples. Cotreatment with GPR119 agonist (MBX-2982 or GSK1292263) significantly potentiated gefitinib-induced cell growth inhibition in gefitinib-insensitive MCF-7 and MDA-MB-231 breast cancer cells. We observed that caspase-3/7 activity was enhanced with the downregulation of Bcl-2 in MCF-7 cells exposed to MBX-2982. Gefitinib-induced autophagy is related with cancer cell survival and chemoresistance. GPR119 agonists inhibit gefitinib-induced autophagosome formation in MCF-7 and MDA-MB-231 cells. MBX-2982 also caused a metabolic shift to enhanced glycolysis accompanied by reduced mitochondrial oxidative phosphorylation. MBX-2982 increased intracellular (~ 2.5 mM) and extracellular lactate (~ 20 mM) content. Gefitinib-mediated autophagy was suppressed by 20 mM lactate in MCF-7 cells.

Conclusions: GPR119 agonists reduced mitochondrial OXPHOS and stimulated glycolysis in breast cancer cells, with consequent overproduction of lactate that inhibited autophagosome formation. Because autophagy is crucial for the survival of cancer cells exposed to TKIs, GPR119 agonists potentiated the anticancer effects of TKIs.

Keywords: Autophagy; Breast cancer; GPR119 agonist; Gefitinib; Lactate.


Conflict of interest statement

Ethics approval and consent to participate

All human tissues were obtained with patients’ written informed consent and approved by the ethics committee of Chungnam National University. Animal studies were approved by Laboratory Animal Ethics Committee of Seoul National University.

Consent for publication

Not applicable.

Competing interests

The authors declare that they have no competing interests.

Publisher’s Note

Springer Nature remains neutral with regard to jurisdictional claims in published maps and institutional affiliations.

Figures

Fig. 1
Fig. 1
GPR119 expression in human breast cancer cells and tumor tissues. a Gene Expression Omnibus profiles of GPR119 in human breast cancer. Upper, relative mRNA levels of GPR119 in human cancer cell lines; lower, GPR119 mRNA expression in metastatic and primary breast cancer tissues; GPR119 mRNA expression in triple negative breast cancer (TNBC) and Non-TNBC tissues. b Expression levels of GPR119 mRNA in various human breast cancer cell lines were verified by real-time qPCR. MCF10A cells were used as normal mammary epithelial cells
Fig. 2
Fig. 2
Enhanced proliferation inhibition by GPR119 agonists in breast cancer cells. a and b Synergistic effects of GPR119 agonist on cell proliferation inhibition by gefitinib in MCF-7 a and MDA-MB-231 cells b. Isobole model was used to evaluate drug combination effect. c Apoptosis induction by gefitinib with MBX-2982. Apoptosis was determined by PI and annexin V staining. The stained cells were analyzed by flow cytometry in MCF-7 cells. Annexin V-positive pro-apoptotic and late-apoptotic cells were counted by BD CellQuest Pro software. d Caspase3/7 activity. MCF-7 cells were preincubated with DEVD-NucViewTM 488, and exposed to gefitinib and MBX-2982 for 60 h, and caspase-3/7-selective green fluorescence was monitored. Green fluorescence intensity was calculated by Incucyte® ZOOM basic analyzer. e PARP cleavage by gefitinib with MBX-2982. MCF-7 cells were incubated in the presence of gefitinib or gefitinib with MBX-2982 for 48 h. Western blot analyses were performed to determine PARP cleavage. f Expression of Bcl-2 and Bax. g Expression of cleaved caspase-8 (active form). MCF-7 cells were incubated with 10 μM gefitinib, 10 μM MBX or gefitinib/MBX for 24 h. Cell cycle analysis h and cell cycle-associated protein expression i. MCF-7 cells were treated with MBX-2982 (MBX) for 24 h and fixed with ethanol. Cell cycle was analyzed by propidium iodide (PI) staining in MCF-7 cells. For the quantification of protein expression of p53, p21 and p27, MCF-7 cells were incubated with 1-10 μM MBX-2982 for 24 h. Data represent the mean ± S.D. (n=3). ** p < 0.01, *** p < 0.005 significant difference versus control group
Fig. 3
Fig. 3
Inhibition of gefitinib-induced autophagy by GPR119 ligands in breast cancer cells. a Autophagy induction by gefitinib in human breast cancer cells. LC3B I/II were measured by immunoblottings in breast cancer cells (MCF-7 and MDA-MB-231 cells). Cells were incubated with 1-30 μM gefitinib for 24 h. b Autophagosome formations in gefitinib-treated MCF-7. Autophagosome formation was visualized by TEM in MCF-7 cells. Cells were incubated with 10 μM gefitinib for 24 h. Star marks indicate double lipid layer vesicle structures. c Effect of ATG7 siRNA on anti-proliferative effect of gefitinib. ATG7 expression was detected by western blotting after siATG7 transfection (upper) and cell proliferation was monitored by Incucyte® ZOOM basic analyzer in MCF-7 cells (lower). Data represent the mean ± S.D. (n=6). d Inhibition of gefitinib-induced autophagy formation by MBX-2982 (MBX). LC3B I/II were measured by western blottings in breast cancer cells incubated with 10 μM gefitinib in the presence or absence of 1-10 μM MBX or 3 μM chloroquine. e Inhibition of gefitinib-induced autophagy formation by GSK1292263 (GSK). LC3B I/II were measured by western blottings in MCF-7 cells incubated with 10 μM gefitinib, 10 μM MBX, 10 μM GSK or 3 μM chloroquine for 24 h. f Inhibition of autophagosome puncture formation by MBX. Green fluorescence puncta were detected by fluorescence microscopy after LC3-GFP transfection in MCF-7 cells (left). Red fluorescence was calculated in MCF-7 cells after mCherry-GFP-LC3 plasmid transfection by Incucyte® ZOOM basic analyzer (right). MCF-7 cells were incubated with 10 μM gefitinib in the presence or absence of 10 μM MBX. Data represent the mean ± S.D. (n=3). g Tumor growth of MCF-7 xenograft was monitored for 40 days. Data represent the mean ± S.E. (n=5). * p < 0.05, significant difference between the indicated two groups
Fig. 4
Fig. 4
Enhancement of target therapy-induced proliferation inhibition by GPR119 agonists. a Cell proliferation was monitored after treatments with vehicle or 4-OHT (0.3-10 μM). b and c Cell proliferation was monitored after treatments with 0.3 μM 4-OHT and GPR119 agonists (1-10 μM). Data represent the mean ± S.D. (n=6). d LC3B I/II were measured by western blottings in breast cancer cells incubated with 0.3 μM 4-OHT in the presence or absence of 10 μM MBX for 24 h. e Expression levels of GPR119 mRNA in three human hepatocellular carcinoma cell lines were verified by real-time qPCR. f HepG2 cells were incubated with 10 μM sorafenib or MBX (1-10 μM) for 48 h, and cell proliferation was monitored by MTT assays. Data represent the mean ± S.D. (n=6). g Autophagy induction by sorafenib in HepG2 cells. The cells were incubated with vehicle or sorafenib (1-30 μM) for 18 h. h ATG7 expression was detected by western blotting after siATG7 transfection (left) and cell proliferation was monitored by Incucyte® ZOOM basic analyzer in HepG2 cells (right). Data represent the mean ± S.D. (n=6). i LC3B I/II were measured by western blottings in HepG2 cells incubated with 10 μM sorafemib in the presence or absence of MBX (3 and 10 μM) or 3 μM chloroquine for 18 h. j Cells were incubated with sorafenib in the presence or absence of MBX (1-10 μM) for 24 h. k In vivo effect of MBX-2982 on tumor growth of HepG2-X xenograft. Sorafenib (10 mg/kg), MBX-2982 (10 mg/kg) or Sorafenib with MBX-2982 were orally administered (5 times a week) and tumor growth was monitored for 18 days. Data represent the mean ± S.E. (n=6). * p < 0.05, *** p < 0.005, significant difference between the two indicated groups
Fig. 5
Fig. 5
GPR119 signaling in autophagy inhibition by MBX-2982. a GPR119 mRNA expression in GPR119 shRNA-infected cells. MCF-7 cells were infected with shGPR119 or shNonTarget lentivirus particle, and GPR119 mRNA expression was determined by real-time qPCR. Data represent the mean ± S.D. (n = 3)(*** p < 0.005, significant difference versus shNonTarget-infected control). b Reversal of MBX-2982 (MBX)-induced autophagy inhibition in GPR119 knock-down cells. LC3B I/II were measured by western blotting in shGPR119 or shNonTarget-infected MCF-7 cells. c Xenograft analysis. Tumor growth of shGPR119-MCF-7 xenograft was monitored for 41 days. Balb/c-nu mice were orally administered with gefitinib (1 mg/kg), MBX (10 mg/kg) or gefitinib with MBX (5 times a week). Data represent the mean ± S.E. (n = 3). d CRE reporter activity. MCF-7 cells were transiently transfected with CRE-luciferase reporter plasmid (CRE-luc) and its reporter activity was measured using luminometer. 10 μM forskolin, an adenylyl cyclase activator, was used as positive control. Data represent the mean ± S.D. (n = 3)(* p < 0.05, ** p < 0.01, significant difference versus control group). e Effect of PKA inhibitor on autophagy inhibition by MBX. MCF-7 cells were preincubated with 10 μM of TK5720, a PKA inhibitor for 30 min and then treated with 3 μM chloroquine in the presence or absence of 10 μM MBX. f Effect of MBX on mTOR signaling pathway. mTOR signaling pathway was estimated by immunoblottings for phosphorylated p70S6 kinase, phosphorylated 4EBP1 and phosphorylated ULK1 in MCF-7 cells incubated with 10 μM MBX-2982 for 24 h. g Effects of MBX on the protein levels of ATG5, ATG7 and ATG12. MCF-7 cells were incubated with MBX (1–10 μM) for 24 h
Fig. 6
Fig. 6
Metabolic shift by MBX-2982 and inhibition of gefitinib-induced autophagy by lactate. a AMPK activity was determined by immunoblottings for phosphorylated AMPK and phosphorylated ACC proteins in MCF-7 cells treated with 10 μM MBX-2982. b ATP content was determined by ATP assay kit in MCF-7 cells. Cells were treated with MBX-2982 (1-10 μM). c Effects of GPR119 agonists on mitochondrial OXPHOS and glycolysis in MCF-7 cells. d MCF-7 cells were pretreated with or without 2-deoxyglucose (2-DG, 50 mM) for 30 min and incubated with 10 μM MBX. e MCF-7 cells were pretreated with or without GSK2837808 (LDH inhibitor, 10 μM) for 30 min and incubated with 10 μM MBX. f MBX-induced lactate production in MCF-7 (left) and shGPR119-MCF-7 cells (right). Lactate concentration was assessed by 1H-NMR or lactate assay kit in total cell lysates and culture media. g MCF-7 cells were incubated with 10 μM gefitinib in the presence or absence of MBX for 24 h and concentrations of glucose and lactate were determined by 1H-NMR in total cell lysates (left) and culture media (right). h and i MCF-7 cells were treated with MBX for 24 h and protein expression of lactate transporters and lactate converting enzymes were measured by western blottings. j MCF-7 cells were treated with MBX-2982 for 24 h and LDHA activity was determined by LDH assay kit. k MCF-7 cells were incubated with 10 μM gefitinib in the presence or absence of lactate (2.5-20 mM) for 24 h, and LC3B I/II were measured by immunoblottings. l Caspase3/7 activation by gefitinib with lactate. MCF-7 cells were treated gefitinib (10 μM) with or without lactate (5-20 mM) for 72 h. Data represent the mean ± S.D. (n=3). * p < 0.05, ** p < 0.01,*** p < 0.005 significanct difference between the two indicated groups

References

    1. Liu TC, et al. Role of epidermal growth factor receptor in lung cancer and targeted therapies. Am J Cancer Res. 2017;7(2):187–202. - PMC - PubMed
    1. Matsuda N, et al. Early clinical development of epidermal growth factor receptor targeted therapy in breast cancer. Expert Opin Investig Drugs. 2017;26(4):463–479. doi: 10.1080/13543784.2017.1299707. - DOI - PMC - PubMed
    1. Boya P, Reggiori F, Codogno P. Emerging regulation and functions of autophagy. Nat Cell Biol. 2013;15(7):713–720. doi: 10.1038/ncb2788. - DOI - PMC - PubMed
    1. Kaur J, Debnath J. Autophagy at the crossroads of catabolism and anabolism. Nat Rev Mol Cell Biol. 2015;16(8):461–472. doi: 10.1038/nrm4024. - DOI - PubMed
    1. Wang WJ, et al. Induction of Autophagic death in Cancer cells by agonizing TR3 and attenuating Akt2 activity. Chem Biol. 2015;22(8):1040–1051. doi: 10.1016/j.chembiol.2015.06.023. - DOI - PubMed

MeSH terms