

Time series analysis of neoadjuvant chemotherapy and bevacizumab-treated breast carcinomas reveals a systemic shift in genomic aberrations
- PMID: 30497530
- PMCID: PMC6262977
- DOI: 10.1186/s13073-018-0601-y
Time series analysis of neoadjuvant chemotherapy and bevacizumab-treated breast carcinomas reveals a systemic shift in genomic aberrations
Abstract
Background: Chemotherapeutic agents such as anthracyclines and taxanes are commonly used in the neoadjuvant setting. Bevacizumab is an antibody which binds to vascular endothelial growth factor A (VEGFA) and inhibits its receptor interaction, thus obstructing the formation of new blood vessels.
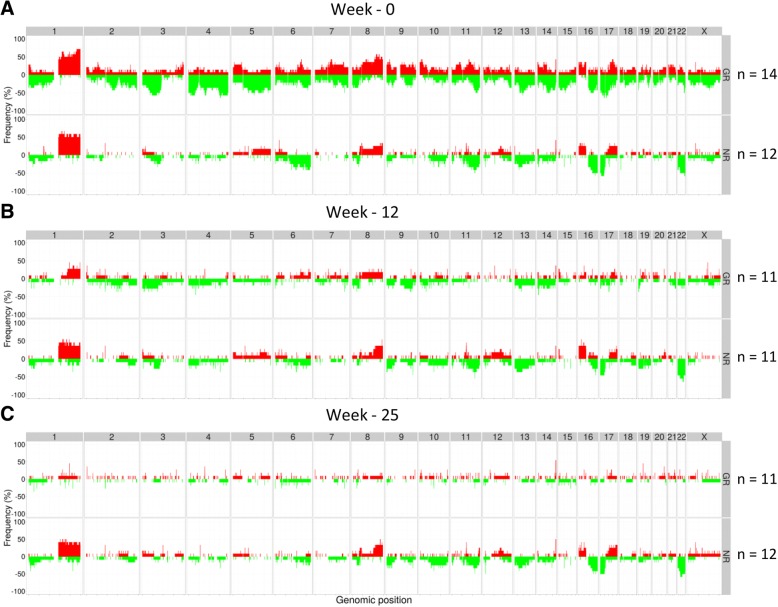
Methods: A phase II randomized clinical trial of 123 patients with Her2-negative breast cancer was conducted, with patients treated with neoadjuvant chemotherapy (fluorouracil (5FU)/epirubicin/cyclophosphamide (FEC) and taxane), with or without bevacizumab. Serial biopsies were obtained at time of diagnosis, after 12 weeks of treatment with FEC ± bevacizumab, and after 25 weeks of treatment with taxane ± bevacizumab. A time course study was designed to investigate the genomic landscape at the three time points when tumor DNA alterations, tumor percentage, genomic instability, and tumor clonality were assessed. Substantial differences were observed with some tumors changing mainly between diagnosis and at 12 weeks, others between 12 and 25 weeks, and still others changing in both time periods.
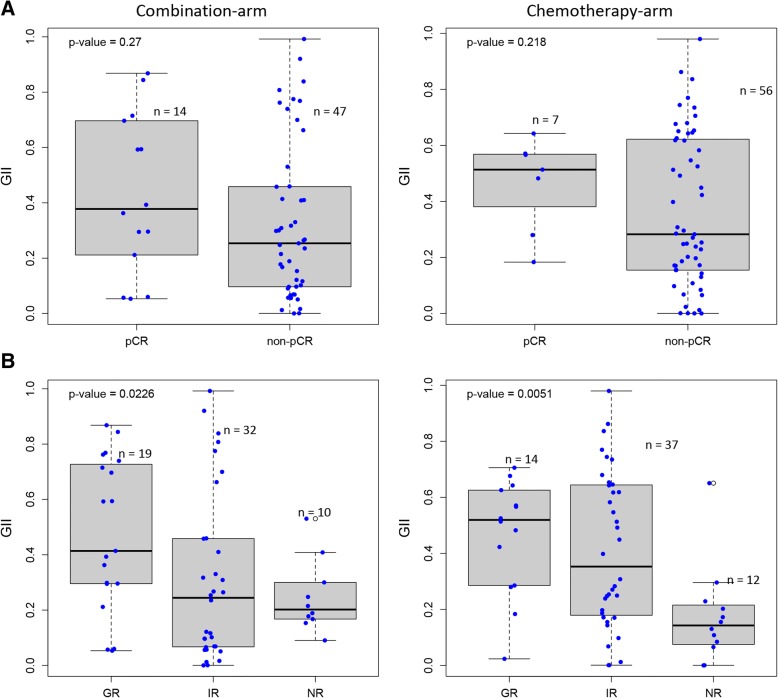
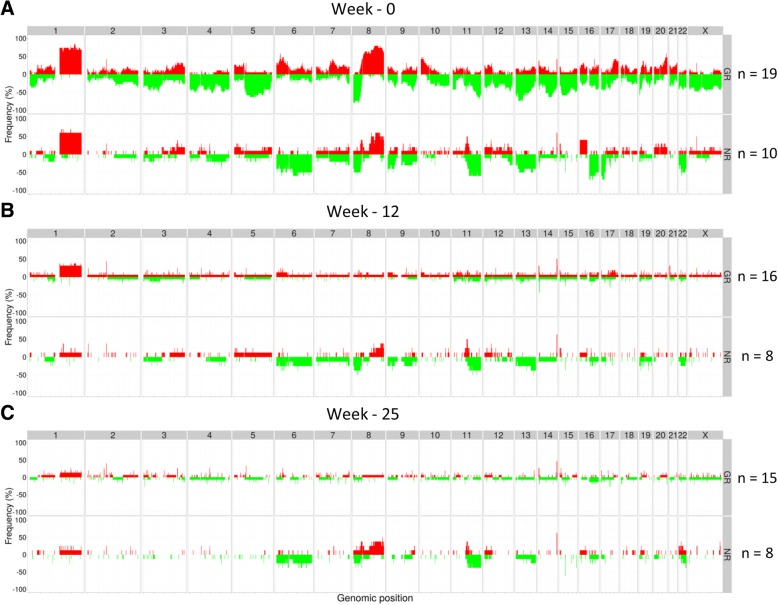
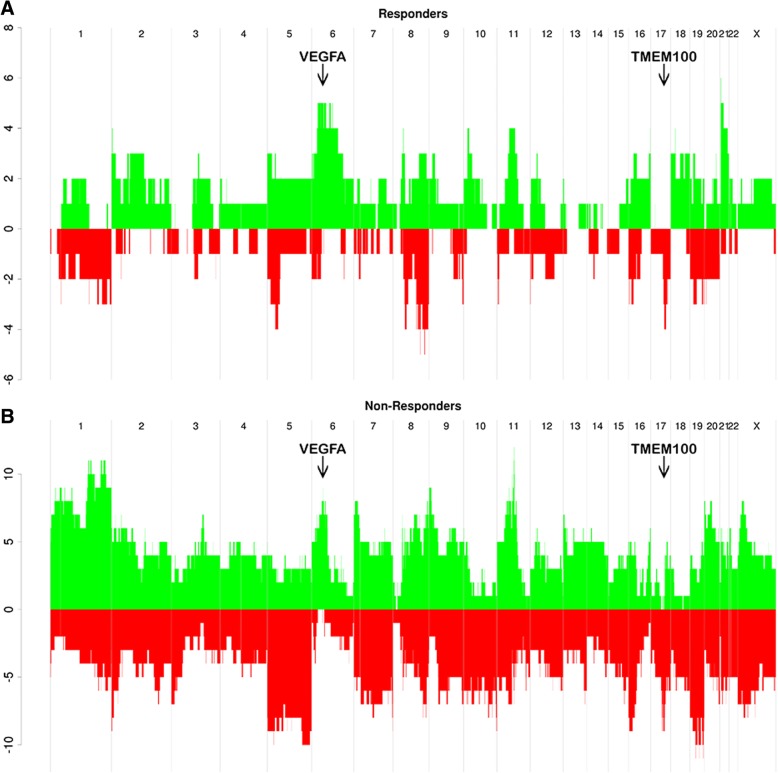
Results: In both treatment arms, good responders (GR) and non-responders (NR) displayed significant difference in genomic instability index (GII) at time of diagnosis. In the combination arm, copy number alterations at 25 loci at the time of diagnosis were significantly different between the GR and NR. An inverse aberration pattern was also observed between the two extreme response groups at 6p22-p12 for patients in the combination arm. Signs of subclonal reduction were observed, with some aberrations disappearing and others being retained during treatment. Increase in subclonal amplification was observed at 6p21.1, a locus which contains the VEGFA gene for the protein which are targeted by the study drug bevacizumab. Of the 13 pre-treatment samples that had a gain at VEGFA, 12 were responders. Significant decrease of frequency of subclones carrying gains at 17q21.32-q22 was observed at 12 weeks, with the peak occurring at TMEM100, an ALK1 receptor signaling-dependent gene essential for vasculogenesis. This implies that cells bearing amplifications of VEGFA and TMEM100 are particularly sensitive to this treatment regime.
Conclusions: Taken together, these results suggest that heterogeneity and subclonal architecture influence the response to targeted treatment in combination with chemotherapy, with possible implications for clinical decision-making and monitoring of treatment efficacy.
Trial registration: NCT00773695 . Registered 15 October 2008.
Keywords: Angiogenesis; Breast cancer; Chemotherapy; Clonal and subclonal aberrations; Targeted treatment; Tumor heterogeneity.
Conflict of interest statement
Ethics approval and consent to participate
Written informed consent forms were obtained from all patients. The study was approved by the Institutional Protocol Review Board of Oslo University Hospital, the Regional Committee for Medical and Health Research Ethics for South-Eastern Norway (ref. no. 2008/10187), and the Norwegian Medicines Agency and was carried out in accordance with the Declaration of Helsinki, International Conference on Harmony/Good Clinical practice.
Consent for publication
Not applicable.
Competing interests
EKH is employed by Roche Norge AS since 01.10.2017. Roche Norge AS is a subsidiary of F. Hoffmann-La Roche Ltd. The data published in this article are based on research conducted with support from Hoffmann-La Roche. The study was planned and the results were interpreted and the article was written without the involvement of Roche Norge AS. Roche Norge AS supported the trial by funding study nurse, CRF, and monitoring of the data. Bevacizumab was supplied by Roche Norge AS. The research was conducted without any involvement by Hoffmann-La Roche and before EKH was employed by Roche Norge AS. Any personal views of EKH should not be understood or quoted as being made on behalf of or reflecting the position of Hoffmann-La Roche. The remaining authors declare that they have no competing interests.
Publisher’s Note
Springer Nature remains neutral with regard to jurisdictional claims in published maps and institutional affiliations.
Figures
References
-
- Kuerer HM, Newman LA, Smith TL, Ames FC, Hunt KK, Dhingra K, Theriault RL, Singh G, Binkley SM, Sneige N, Buchholz TA, Ross MI, McNeese MD, Buzdar AU, Hortobagyi GN, Singletary SE, Kuerer BHM. Clinical course of breast cancer patients with complete pathologic primary tumor and axillary lymph node response to doxorubicin-based neoadjuvant chemotherapy. J Clin Oncol. 1999;17:460–469. doi: 10.1200/JCO.1999.17.2.460. - DOI - PubMed
-
- Bonnefoi H, Litière S, Piccart M, MacGrogan G, Fumoleau P, Brain E, Petit T, Rouanet P, Jassem J, Moldovan C, Bodmer A, Zaman K, Cufer T, Campone M, Luporsi E, Malmström P, Werutsky G, Bogaerts J, Bergh J, Cameron DA, Investigators on behalf of the E 10994/BIG 1-00 S Pathological complete response after neoadjuvant chemotherapy is an independent predictive factor irrespective of simplified breast cancer intrinsic subtypes: a landmark and two-step approach analyses from the EORTC 10994/BIG 1-00 phase III trial. Ann Oncol. 2014;25:1128–1136. doi: 10.1093/annonc/mdu118. - DOI - PMC - PubMed
-
- Chollet P, Amat S, Cure H, de Latour M, Le Bouedec G, Mouret-Reynier M-A, Ferriere J-P, Achard J-L, Dauplat J, Penault-Llorca F. Prognostic significance of a complete pathological response after induction chemotherapy in operable breast cancer. Br J Cancer. 2002;86:1041–1046. doi: 10.1038/sj.bjc.6600210. - DOI - PMC - PubMed
-
- Parnell C, Woll PJ. Principles of cancer treatment by chemotherapy. Surg. 2003;21:272–276.
-
- Bertheau, Lerebours, Mounier, de Roquancourt, Espié, Clot, Servant, Misset, Marty, Janin Prognostic significance of a combined clinicopathologic score for response to primary systemic therapy in locally advanced breast cancer. Oncol Rep. 2005;14:513–520. - PubMed
Publication types
MeSH terms
Substances
Associated data
LinkOut - more resources
Full Text Sources
Medical
Research Materials
Miscellaneous
