

Viral M45 and necroptosis-associated proteins form heteromeric amyloid assemblies
- PMID: 30498077
- PMCID: PMC6362354
- DOI: 10.15252/embr.201846518
Viral M45 and necroptosis-associated proteins form heteromeric amyloid assemblies
Abstract
The murine cytomegalovirus protein M45 protects infected mouse cells from necroptotic death and, when heterologously expressed, can protect human cells from necroptosis induced by tumour necrosis factor receptor (TNFR) activation. Here, we show that the N-terminal 90 residues of the M45 protein, which contain a RIP homotypic interaction motif (RHIM), are sufficient to confer protection against TNFR-induced necroptosis. This N-terminal region of M45 drives rapid self-assembly into homo-oligomeric amyloid fibrils and interacts with the RHIMs of the human kinases RIPK1 and RIPK3, and the Z-DNA binding protein 1 (ZBP1), to form heteromeric amyloid fibrils in vitro Mutation of the tetrad residues in the M45 RHIM attenuates homo- and hetero-amyloid assembly by M45, suggesting that the amyloidogenic nature of the M45 RHIM underlies its biological activity. The M45 RHIM preferentially interacts with RIPK3 and ZBP1 over RIPK1 and alters the properties of the host RHIM protein assemblies. Our results indicate that M45 mimics the interactions made by RIPK1 or ZBP1 with RIPK3, thereby forming heteromeric amyloid structures, which may explain its ability to inhibit necroptosis.
Keywords: M45; RIP homotypic interaction motif; RIPK3; amyloid; necroptosis.
© 2018 The Authors.
Figures
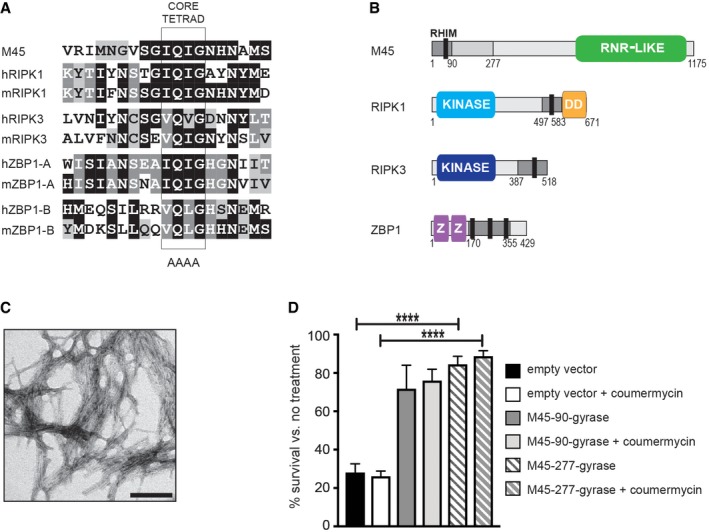
Sequence alignment of RHIMs from M45 and human and murine RIPK1, RIPK3 and ZBP1.
Schematic representation of M45, RIPK1, RIPK3 and ZBP1 proteins. Grey regions indicate RHIM‐encompassing fragments used in this study. Black bar represents 19‐residue RHIM. RNR‐like: inactive ribonucleotide reductase domain; DD: death domain; Z: double‐stranded RNA‐specific adenosine deaminase (DRADA) repeat.
Electron micrograph of fibrils formed by a synthetic peptide encompassing the M45 RHIM. Representative of three samples examined. Scale bar 100 nm.
HT‐29 cell survival 18 h after treatment with TNF + BV‐6 + z‐VAD‐fmk to induce necroptosis. Cells expressed lentivirus constructs encoding 1–90 or 1–277 fragments of M45 and were cultured ± the addition of coumermycin A1 to induce dimerisation. N = 2 for M45‐90 gyrase, ± coumermycin A1 and N = 4 for M45‐277 gyrase and for empty vector, ± coumermycin A1. Error bars represent s.d., ****P < 0.0001. To determine statistical significance, a two‐tailed Student's t‐test was performed using GraphPad Prism (version 7; GraphPad software).

Thioflavin T fluorescence as a function of time, following dilution of WT or AAAA His‐Ub‐M451–90, His‐Ub‐RIPK1497–583 and His‐Ub‐RIPK3387–518 from 8 M to 200 mM urea‐containing buffer. Buffer sample contains ThT but no protein. Samples were tested in triplicate, solid line is the average of the triplicates, and the error bars (in grey) represent ± s.d.
Absorbance spectra from solutions containing Congo red with WT (black lines) or AAAA mutant (dark grey lines) His‐Ub‐M451–90, His‐Ub‐RIPK1497–583 and His‐Ub‐RIPK3387–518 that have been dialysed against assembly buffer. Congo red sample alone with no protein (light grey line) served as a control for the experiment. Experiment conducted once.
Electron micrograph of material eluted in peak 1 from the three MBP fusion proteins (see Fig EV1E), as labelled. These are representative micrographs of the material observed. Scale bar 100 nm in all panels.
Representative micrographs of insoluble material generated after treatment with thrombin removed the MBP. Experiment repeated three times. Scale bar 100 nm in all panels.

Thioflavin T fluorescence as a function of time, following dilution of WT His‐Ub‐ZBP1170–355 from 8 M to 320 mM urea‐containing buffer (solid black line). Buffer sample contains ThT but no protein (solid grey line). Samples were tested in triplicate, solid line is the average of the triplicates, and the error bars (in grey) represent ± s.d.
X‐ray fibre diffraction pattern collected from fibrils formed by His‐Ub‐M451–90. Two different samples were examined in this way.
Representative electron micrographs of assemblies formed by mCHERRY‐M451–90WT and mCHERRY‐M451–90AAAA. Scale bars 200 nm in both panels.
Representative electron micrographs of assemblies formed by His‐Ub‐RIPK3387–518WT and His‐Ub‐RIPK3387–518AAAA. Scale bars 200 nm in both panels.
Size exclusion chromatography (SEC) of MBP‐M451–90, MBP‐RIPK1497–583 and MBP‐RIPK3387–518 following amylose affinity purification. Peak 1 represents high MW material eluting in void volume. SDS–PAGE of peaks 1 and 2.

- A
Fluorescence polarisation profiles from incorporation of FITC‐M451–90 into excess unlabelled M451–90 (green), RIPK1497–583 (red), RIPK3387–518 (blue) or ZBP1170–355 (purple). Average polarisation profile from smoothed triplicate samples plotted, with s.d. indicated. Experiment performed twice and representative results shown here.
- B
Schematic representation of fluorescence spectroscopy experiments used to detect the formation of homo‐ and heteromeric amyloid fibrils. Fusion proteins containing RHIMs and different fluorescent partners are mixed together under assembly‐permissive conditions and examined in the confocal volume. Co‐assembly of two different fluorophores within one complex results in detection of coincident signals in the two channels.
- C, D
Representative fluorescence intensity trace showing homomeric assembly over 40 s in mixtures of (C) mCHERRY‐RIPK1497–583 and YPet‐RIPK1497–583 and (D) mCHERRY‐RIPK3387–518 and YPet‐RIPK3387–518.
- E, F
Representative fluorescence intensity traces showing heteromeric assembly over 40 s in mixtures of (E) mCHERRY‐RIPK1497–583 and YPet‐RIPK3387–518 (inset is expansion of region indicated by *) and (F) mCHERRY‐RIPK1497–583AAAA and YPet‐RIPK3387–518. All mixtures examined in at least three different experiments on three separate occasions.

Fluorescence polarisation profiles from incorporation of FITC‐ RIPK3387–518 into excess unlabelled M451–90 (green), RIPK1497–583 (red), RIPK3387–518 (blue) or ZBP1170–355 (purple). Average polarisation profile from smoothed triplicate samples plotted, with s.d. indicated. Experiment performed twice and representative results shown here.
Representative fluorescence intensity traces collected over 50 s for (left) YPet‐RIPK3387–518AAAA; (middle) a mixture of mCHERRY‐M451–90 and YPet‐RIPK3387–518AAAA; and (right) mCHERRY‐M451–90. Experiment performed once.

Analysis of frequency and brightness (photons/ms) of events detected in the focal volume by fluorescence spectroscopy for YPet‐RIPK1497–583, mCHERRY‐M451–90WT and mCHERRY‐M451–90AAAA alone and when incubated together under conditions allowing RHIM‐based co‐assembly. Raw data presented in Fig 4B and F.
Analysis of frequency and brightness (photons/ms) of events detected in the focal volume by fluorescence spectroscopy for YPet‐RIPK3387–518, mCHERRY‐M451–90WT and mCHERRY‐M451–90AAAA alone and when incubated together under conditions allowing RHIM‐based co‐assembly. Raw data presented in Fig 4C and G.
Analysis of frequency and brightness (photons/ms) of events detected in the focal volume by fluorescence spectroscopy for YPet‐ZBP170–355, mCHERRY‐M451–90WT and mCHERRY‐M451–90AAAA alone and when incubated together under conditions allowing RHIM‐based co‐assembly. Raw data presented in Fig 4D and H.

- A–H
Representative fluorescence intensity traces collected over 50 s for mixtures of (A) mCHERRY‐M451–90 and YPet‐only; (B) mCHERRY‐M451–90 and YPet‐RIPK1497–583; (C) mCHERRY‐M451–90 and YPet‐RIPK3387–518; (D) mCHERRY‐M451–90 and YPet‐ZBP1170–355; (E) mCHERRY‐M451–90AAAA and YPet‐only; (F) mCHERRY‐M451–90AAAA and YPet‐RIPK1497–583; (G) mCHERRY‐M451–90AAAA and YPet‐RIPK3387–518; and (H) mCHERRY‐M451–90 and YPet‐ZBP1170–355. Independent replicates performed at least twice.

Representative electron micrographs of homo‐fibrils formed by M451–90, RIPK1497–583, His‐Ub‐RIPK3387–518 or ZBP1170–355 individually, and hetero‐fibrils formed by indicated mixtures. Samples prepared twice from independent protein preparations.
Hetero‐fibrils containing mCHERRY‐M451–90 and YPet‐RIPK1497–583.
Hetero‐fibrils containing mCHERRY‐M451–90 and YPet‐RIPK3387–518.
Hetero‐fibrils containing mCHERRY‐M451–90 and YPet‐ZBP1170–355.
Hetero‐fibrils containing mCHERRY‐RIPK1497–583 and YPet‐RIPK3387–518.
Hetero‐fibrils containing mCHERRY‐RIPK3387–518 and YPet‐ZBP1170–355.
Pearson's correlation coefficients measured from two confocal images of the indicated protein mixtures.
Hetero‐fibrils containing ECFP‐M451–90 with mCHERRY‐RIPK1497–583 and YPet‐RIPK3387–518.
STED images of heteromeric fibrils formed by co‐assembly of mCHERRY‐M451–90 and YPet‐RIPK3387–518.

Representative electron micrograph of structures formed when His‐Ub‐RodA was incubated with M451–90.
Representative electron micrograph of structures formed when His‐Ub‐RodA was incubated with RIPK1497–583.
Heteromeric assemblies formed by RHIM‐containing proteins, incubated with thioflavin T and imaged using a Cytation 3 Imager (BioTek). CFP, YFP and Texas Red filter sets were used to detect thioflavin T fluorescence, YPet and mCHERRY fluorescence, respectively.
Number of large complexes containing mCHERRY‐RIPK1497–583 and YPet‐RIPK3387–518 of > 5,000 or > 10,000 photons/ms detected in the focal volume in the last 200 s of a 10‐min incubation, as a function of relative His‐Ub‐M451–90 molar equivalents. Concentration of RIPK1 and RIPK3 constant throughout.
Average % incorporation of mCHERRY‐RIPK1497–583 in complexes containing YPet‐RIPK1497–583 and RIPK3387–518, when formed in the presence of increasing molar equivalents of His‐Ub‐M451–90. Concentration of RIPK1 and RIPK3 constant throughout. Analysis performed on hetero‐complexes detected in the focal volume in the last 200 s of a 10‐min incubation.
Still images captured from video recordings of solutions containing YPet‐RIPK3387–518 only (blue) or mixtures of YPet‐RIPK3387–518 with mCHERRY‐M451–90WT (magenta) or with mCHERRY‐M451–90AAAA (green). Solutions were imaged using a NanoSight NS300 particle tracking system, only YPet fluorophore was detected and particle sizes were measured from recorded images. Box indicates the second and third quartiles with median shown by horizontal line. X represents the mean. Whiskers represent the lower and upper limits of the first and fourth quartiles, respectively, excluding single outlier at 46 μm.
Representative electron micrograph of structures formed from mixtures of M451–90WT‐mCHERRY and YPetRIPK3387–518 at 1:1, 2:1 and 4:1 molar equivalents.

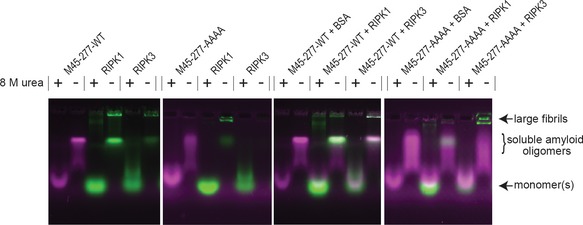
SDS–AGE analysis of monomeric or assembled forms of YPet‐RIPK3387–518 and mCHERRY‐M451–90WT or mCHERRY‐M451–90AAAA. Monomeric forms of the proteins maintained in 8 M urea prior to electrophoresis, as indicated. Assembled samples incubated with 0 or 2% SDS at RT for 10 min before electrophoresis. Protein components as indicated above each lane.
SDS–AGE analysis of assemblies of mCHERRY‐RIPK1497–583 and YPet‐RIPK3387–518 with or without four times molar equivalents of His‐Ub‐M45.
SDS–AGE analysis of assemblies of YPet‐RIPK3387–518 and mCHERRY‐ZBP1170–355 with or without four times molar equivalents of His‐Ub‐M45. AGE experiments performed at least twice. Size of assemblies indicated to the right of the panel, as large assemblies, soluble amyloid oligomers or monomers.

Structure of the RIPK1:RIPK3 RHIM core, prepared using PyMol Graphics System from PDB 5V7Z. The RIPK3 sequence is coloured in blue, and RIPK1 is coloured in green. Tetrad residue side chains are shown as sticks; Tyr, Asn/Gln, Ser and Cys side chains are shown in wheat, red, grey and yellow, respectively. Core tetrad interactions across the opposing β‐sheets are indicated by the dotted box.
Model of M45:RIPK3 RHIM core, prepared by appropriate mutation of RIPK1. The M45 sequence is coloured in cyan and RIPK3 in blue. Tetrad residue side chains are shown as sticks; Tyr, Asn/Gln, Val and Cys side chains are shown in wheat, red, grey and yellow, respectively. Core tetrad interactions across the opposing sheets are indicated by the dotted box.
Schematic representation of RHIM fibrils formed by full‐length proteins with partner domains (e.g. kinase or RNR, coloured green) flanking either side of the amyloid core formed by RHIMs (coloured grey).
Confocal microscopy image of a single fibril composed of YPet‐M451–90. Scale bar 5 μm.
Comment in
-
Mimicry by a viral RHIM.EMBO Rep. 2019 Feb;20(2):e47433. doi: 10.15252/embr.201847433. Epub 2019 Jan 21. EMBO Rep. 2019. PMID: 30665943 Free PMC article.
References
-
- Sun X, Yin J, Starovasnik MA, Fairbrother WJ, Dixit VM (2002) Identification of a novel homotypic interaction motif required for the phosphorylation of receptor‐interacting protein (RIP) by RIP3. J Biol Chem 277: 9505–9511 - PubMed
-
- Newton K (2015) RIPK1 and RIPK3: critical regulators of inflammation and cell death. Trends Cell Biol 25: 347–353 - PubMed
-
- Sun L, Wang X (2014) A new kind of cell suicide: mechanisms and functions of programmed necrosis. Trends Biochem Sci 39: 587–593 - PubMed
-
- Vandenabeele P, Galluzzi L, Vanden Berghe T, Kroemer G (2010) Molecular mechanisms of necroptosis: an ordered cellular explosion. Nat Rev Mol Cell Biol 11: 700–714 - PubMed
Publication types
MeSH terms
Substances
LinkOut - more resources
Full Text Sources
Molecular Biology Databases
Research Materials
Miscellaneous
