. 2019 Jan 15;79(2):360-371.
doi: 10.1158/0008-5472.CAN-18-0781. Epub 2018 Nov 29.

TLR Signaling Is Activated in Lymph Node-Resident CLL Cells and Is Only Partially Inhibited by Ibrutinib

Affiliations

TLR Signaling Is Activated in Lymph Node-Resident CLL Cells and Is Only Partially Inhibited by Ibrutinib

Eman L Dadashian et al. Cancer Res. .

Abstract

Chronic lymphocytic leukemia (CLL) is a malignancy of mature B cells driven by B-cell receptor (BCR) signaling and activated primarily in the lymph node. The Bruton's tyrosine kinase (BTK) inhibitor ibrutinib effectively inhibits BCR-dependent proliferation and survival signals and has emerged as a breakthrough therapy for CLL. However, complete remissions are uncommon and are achieved only after years of continuous therapy. We hypothesized that other signaling pathways that sustain CLL cell survival are only partially inhibited by ibrutinib. In normal B cells, Toll-like receptor (TLR) signaling cooperates with BCR signaling to activate prosurvival NF-κB. Here, we show that an experimentally validated gene signature of TLR activation is overexpressed in lymph node-resident CLL cells compared with cells in the blood. Consistent with TLR activation, we detected phosphorylation of NF-κB, STAT1, and STAT3 in lymph node-resident CLL cells and in cells stimulated with CpG oligonucleotides in vitro. CpG promoted IRAK1 degradation, secretion of IL10, and extended survival of CLL cells in culture. CpG-induced TLR signaling was significantly inhibited by both an IRAK1/4 inhibitor and ibrutinib. Although inhibition of TLR signaling was incomplete with either drug, the combination achieved superior results, including more effective inhibition of TLR-mediated survival signaling. Our data suggest an important role for TLR signaling in CLL pathogenesis and in sustaining the viability of CLL cells during ibrutinib therapy. The combination of ibrutinib with a TLR pathway inhibitor could provide superior antitumor activity and should be investigated in clinical studies. SIGNIFICANCE: CLL relies on the concomitant cooperation of B-cell receptor and Toll-like receptor signaling; inhibition of both pathways is superior to inhibition of either pathway alone. GRAPHICAL ABSTRACT: http://cancerres.aacrjournals.org/content/canres/79/2/360/F1.large.jpg.


Conflict of interest statement

Conflicts of Interest

A. Wiestner reports receiving commercial research grants from Acerta Pharma and Pharmacyclics, an Abbvie Company. No potential conflicts of interest were disclosed by the other authors.

Figures
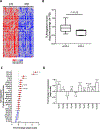
Figure 1:
Figure 1:. TLR gene signature is overrepresented in lymph node-resident CLL cells compared to the peripheral blood.
A, Heat map depicting 1.5- fold change in differentially expressed upregulated genes overlapping with the experimentally derived Toll-like receptor signature across patients comparing PB and LN compartments (n=17). B, Min to max box and whisker plots of the TLR signature score for patients with an unmutated-IGVH (unCLL; n=12) or mutated-IGVH (mCLL; n=5). C, Mean (±SEM) fold change (LN over PB) in gene expression on a log2 scale of key cytokines and chemokines induced by TLR activation (n=17). Red circles represent genes upregulated in the LN and blue circles those downregulated in the LN, compared to PB. D, Mean (±SEM) fold change (LN over PB) in gene expression on a log2 scale of the 10 Toll-like receptors (n=17). Comparisons in B by a Mann-Whitney test and C-D by paired student t-test. *P<0.05, **P<0.01, and ****P<0.0001.
Figure 2:
Figure 2:. TLR signaling is activated in lymph node-resident CLL cells.
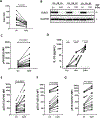
A, proximity ligand assay displaying representative interactions between TLR9-pIκBα for two patients. Green represents the CD20 counterstain indicating a B cell, Blue represents DAPI identifying the nucleus and, and Red puncta identify an interaction between the two probes indicated (representing active signaling). Red arrows indicate representative positive cells and yellow arrows indicated representative negative cells. B-C, MFI as determined by flow cytometry in CLL cells sampled from the peripheral blood (PB) and the matching lymph node (LN) (n=10) for B, pNF-κB(P65(S529)) and C, pSTAT3(Y705). Each line represents one patient. D, Expression of pSTAT3(Y705), total STAT3, pIκBα, total IκBα and GAPDH loading control by western blot for two representative patients. E-F, MFI as determined by flow cytometry in CLL cells sampled from the peripheral blood (PB) and the matching lymph node (LN) (n=10) for E, pSTAT1(S727) and F, pSTAT3(S727). Each line represents one patient. All comparisons by Wilcoxon matched-pairs signed rank test.
Figure 3:
Figure 3:. CpG activates TLR signaling in CLL cells in vitro.
A-C, Cells stimulated with 1μM CpG for five hours were compared to untreated controls (Un). A, IRAK1 MFI by flow cytometry. Each line represents one patient (n=16). B, Expression of IRAK1 and GAPDH loading control by western blot (n=3). C, pNF-κB(P65(S529)) MFI in CLL cells by flow cytometry. Each line represents one patient (n=16). D, IL-10 pg/mL by ELISA in supernatants from cells stimulated with CpG for 1hr, 6hrs, and 24hrs. Each line represents one patient (n=7). E-G, MFI by flow cytometry for cells treated with 1μM CpG for five hours compared to untreated controls (Un; n=16 patients) for E, pSTAT3(Y705), F, pSTAT1(S727) and G, pSTAT3(S727). Each line represents one patient. All comparisons by Wilcoxon matched-pairs signed rank test.
Figure 4:
Figure 4:. Ibrutinib inhibits TLR signaling in CLL cells.
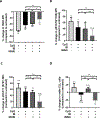
A-D, PBMCs from CLL patients were cultured with or without 1μM ibrutinib or 10μM IRAKi for one hour followed by five hours of CpG stimulation (1μM). A, Mean (±SEM) % change in IRAK1 expression from baseline determined by flow cytometry (n=14). B, Expression of IRAK1 and GAPDH (loading control) by western blotting for two representative patients. C-D, Mean (±SEM) % change over baseline in CLL cells (n=14 patients) as determined by flow cytometry for C, pNF-κB(P65(S529)) and D, pSTAT3(Y705). Asterisks (**P<0.01 and ***P<0.001) refer to comparisons between treated conditions and untreated control, brackets show comparisons between different treatments. All statistics by Wilcoxon matched-pairs signed rank test.
Figure 5:
Figure 5:. Ibrutinib inhibits both BCR and TLR signaling in CLL.
A, Primary CLL PBMCs were pre-treated with or without 1μM ibrutinib (IB) or 10μM IRAKi for one hour followed by stimulation of the TLR for five hours with CpG (1μM). Shown is the median (±IQR) % change compared to CpG controls in MFI of pSTAT3(Y705); IQR −34 to −17 for IB and −20 to −11 for IRAKi, pSTAT1(S727); IQR −20 to −10 for IB and −23 to −15 for IRAKi, and pSTAT3(S727); IQR −22 to −6 for IB and −20 to −5 for IRAKi in CLL cells as determined by flow cytometry (n=11). B, Primary CLL PBMCs were pre-treated with or without 1μM ibrutinib (IB) or 10μM IRAKi for 5.75 hours followed by stimulation of the BCR for 15 minutes with αIgM (20μg/mL) for a total of 6 hours. Shown is the median (±IQR) % change compared to αIgM controls in MFI of pBTK(Y223); IQR −30 to −19 for IB and −7 to −4 for IRAKi, pPLCg2(Y759); IQR −35 to −21 for IB and −4 to 0 for IRAKi, and pERK(T202/Y204); IQR −44 to −16 for IB and −14 to −1 for IRAKi in CLL cells as determined by flow cytometry (n=11). Asterisks indicate comparisons made to stimulated control, brackets show comparisons between IB and IRAKi. All comparisons by Wilcoxon matched-pairs signed rank test; **P<0.01.
Figure 6:
Figure 6:. Dual targeting of TLR signaling with ibrutinib and IRAKi is superior to single-agents.
A-D, PBMCs from CLL patients (n=10) were cultured with or without 1μM ibrutinib (IB) or 10μM IRAKi or their combination for one hour, followed by five hours with 1μM CpG. All comparisons made to CpG stimulated controls are significant (P≤0.004). Shown is the median (±IQR) % change compared to untreated controls of A, IRAK1, B, pSTAT3(Y705), C, pSTAT1(S727), and D, median (±IQR) % change of CLL cell viability determined by flow cytometry. Asterisks (*P<0.05, **P<0.01 and ***P<0.001) refer to comparisons between treated conditions and untreated controls and brackets show comparisons between IB, IRAKi and their combination. All comparisons by Wilcoxon matched-pairs signed rank test.

Similar articles

Cited by

References

    1. Herishanu Y, Katz BZ, Lipsky A, Wiestner A. Biology of chronic lymphocytic leukemia in different microenvironments: clinical and therapeutic implications. Hematol Oncol Clin North Am 2013;27:173–206 - PMC - PubMed
    1. Kipps TJ, Stevenson FK, Wu CJ, Croce CM, Packham G, Wierda WG, et al. Chronic lymphocytic leukaemia. Nature reviews Disease primers 2017;3:16096 - PMC - PubMed
    1. Sun C, Wiestner A. Prognosis and therapy of chronic lymphocytic leukemia and small lymphocytic lymphoma. Cancer Treat Res 2015;165:147–75 - PubMed
    1. Damle RN, Wasil T, Fais F, Ghiotto F, Valetto A, Allen SL, et al. Ig V gene mutation status and CD38 expression as novel prognostic indicators in chronic lymphocytic leukemia. Blood 1999;94:1840–7 - PubMed
    1. Hamblin TJ, Davis Z, Gardiner A, Oscier DG, Stevenson FK. Unmutated Ig V(H) genes are associated with a more aggressive form of chronic lymphocytic leukemia. Blood 1999;94:1848–54 - PubMed

Publication types

MeSH terms