. 2018 Nov 29;9(1):5068.
doi: 10.1038/s41467-018-07466-6.

Comprehensive human cell-type methylation atlas reveals origins of circulating cell-free DNA in health and disease

Affiliations

Comprehensive human cell-type methylation atlas reveals origins of circulating cell-free DNA in health and disease

Joshua Moss et al. Nat Commun. .

Abstract

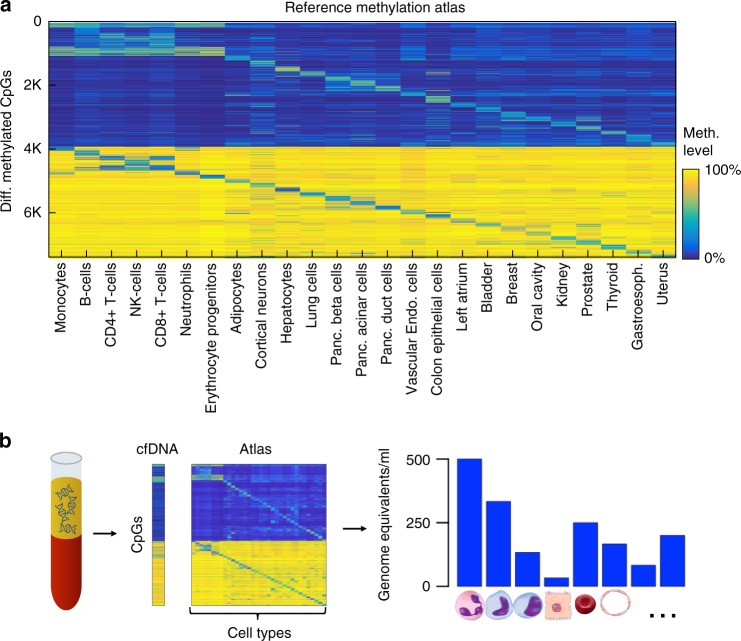
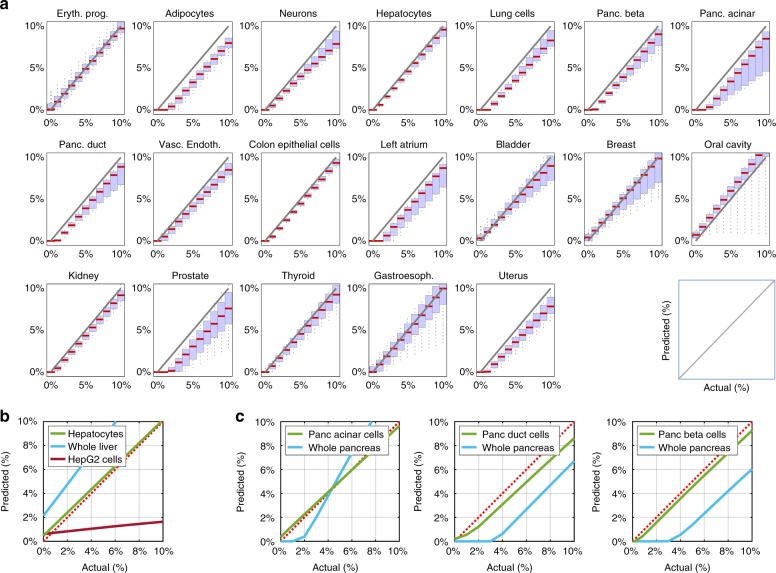
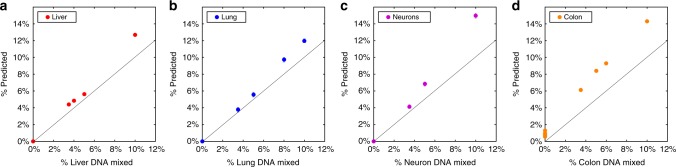
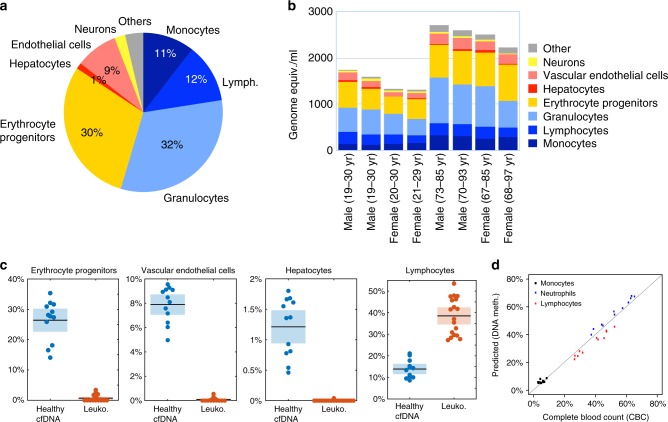
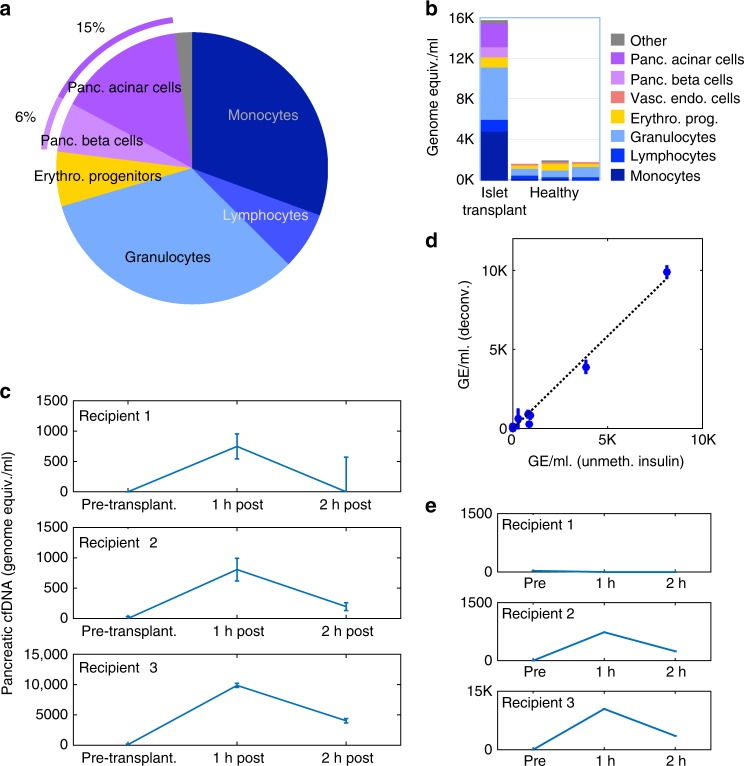
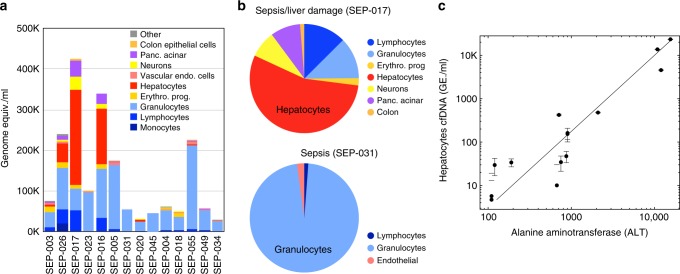
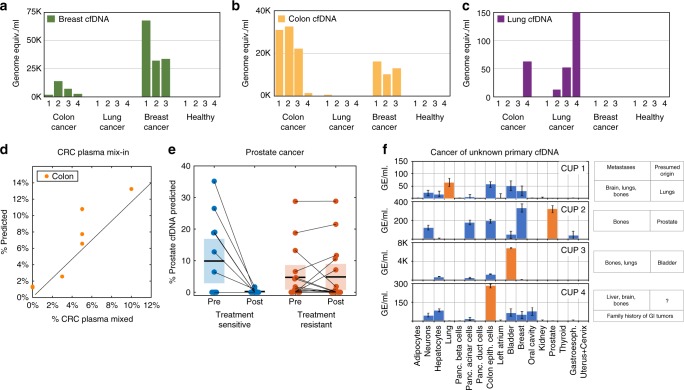
Methylation patterns of circulating cell-free DNA (cfDNA) contain rich information about recent cell death events in the body. Here, we present an approach for unbiased determination of the tissue origins of cfDNA, using a reference methylation atlas of 25 human tissues and cell types. The method is validated using in silico simulations as well as in vitro mixes of DNA from different tissue sources at known proportions. We show that plasma cfDNA of healthy donors originates from white blood cells (55%), erythrocyte progenitors (30%), vascular endothelial cells (10%) and hepatocytes (1%). Deconvolution of cfDNA from patients reveals tissue contributions that agree with clinical findings in sepsis, islet transplantation, cancer of the colon, lung, breast and prostate, and cancer of unknown primary. We propose a procedure which can be easily adapted to study the cellular contributors to cfDNA in many settings, opening a broad window into healthy and pathologic human tissue dynamics.


Conflict of interest statement

J.M., R.S., B.G., T.K. and Y.D. are inventors on a patent entitled “CELL FREE DNA DECONVOLUTION AND USE THEREOF” (US provisional application No. 62/661,179). The remaining authors declare no competing interests.

Figures

Fig. 1
Fig. 1
Identification of tissue-of-origin of cfDNA using deconvolution of the plasma methylome aided by a comprehensive methylation atlas. a Methylation atlas composed of 25 tissues and cell types (columns) across ~8000 CpGs (rows). For each cell type, we selected the top 100 uniquely hypermethylated (top) and 100 most hypomethylated (bottom) CpG sites, giving a total of 5000 tissue-discriminating individual CpGs. We then added neighboring (up to 50 bp) CpGs, as well as 500 CpGs that are differentially methylated across pairs of otherwise similar tissues. Overall, we used 7890 CpGs that are located in 4039 500 bp genomic blocks. b Deconvolution of plasma DNA. Cell-free DNA (cfDNA) is extracted from plasma and analyzed with a methylation array. It is then deconvoluted using a reference methylation atlas to quantify the contribution of each cell type to the cfDNA sample
Fig. 2
Fig. 2
DNA methylation patterns allow for accurate deconvolution of simulated admixed samples. a The methylome of each cell type was mixed in silico with the methylome of leukocytes such that it contributed between 0 and 10% of DNA, in 1% intervals (x-axis of each plot) and compared to the prediction of deconvolution using our reference methylation atlas (y-axis). Red horizontal bars represent the median predicted contribution for each mixed-in level, across 36–180 replicates for each cell type (2–10 replicates of measured cell type methylomes, each mixed within any of 18 leukocyte replicates). The blue area represents a box plot spanning the 25th to 75th percentiles for each mixing ratio, with black vertical lines marking the 9th to 91st percentiles. b Primary tissue methylome allows a more accurate deconvolution than whole-tissue or a cell line. Hepatocyte methylome was mixed in silico with blood methylome as in a. The level of inferred admixture (y-axis) was calculated using a reference tissue methylome atlas that included other hepatocyte samples (green), whole liver methylomes (blue) or the methylome of the HepG2 cell line (red). Dotted red line marks accurate prediction. c Cell type-specific methylomes allow a more accurate deconvolution than whole tissue methylomes. The methylome of pancreatic acinar, duct, or beta cells was diluted in silico into leukocyte methylomes (left, middle, and right, respectively); the level of admixture was calculated using a comprehensive reference atlas that contained either independent samples of the spiked-in pancreas cell types (green lines), or a whole pancreas methylome (blue lines). Note assay linearity, but reduced sensitivity, when using a whole pancreas methylome
Fig. 3
Fig. 3
In vitro mixing experiments. Genomic DNA derived from liver (a), lung (b), neurons (c), and colon (d) (each from a single donor) was mixed in nine different combinations (detailed in Supplementary Data 1) with genomic DNA extracted from the blood of a single healthy donor, in the proportions indicated in the X axis. A total of 250 ng DNA from each mixture was subjected to an Illumina EPIC array, and the resulting methylome was deconvoluted to predict the contribution of each mixed-in tissue (Y axis). Each dilution point represents one mixing experiments
Fig. 4
Fig. 4
Cellular contributors to cfDNA in healthy individuals. a Predicted distributions of contributors to circulating cfDNA, averaged across eight sample pools of healthy donors. Contributions smaller than 1% were included in “Other”. b Deconvolution results for eight sets of pooled DNA samples, expressed as absolute levels of DNA (genome equivalents/ml plasma, derived by multiplying the fraction contribution of each tissue by the total amount of cfDNA in 1 ml plasma). Shown are contributions larger than 1%. Young, 19–30 years old; Old, 67–97 years old (pool average > 75 yr). c Comparison of estimated proportion of various cell types in healthy plasma samples (blue) vs. leukocytes (orange), as predicted by deconvolution. Shown, from left, are the contributions of erythrocyte progenitor cells, vascular endothelial cells and hepatocytes, all of which are not expected in leukocyte samples. Also shown are the predicted contributions of lymphocytes, that represent a large fraction of leukocyte cell population. Shaded boxes mark 95% confidence interval of the sample mean. d Deconvolution of whole blood methylomes (not plasma), showing excellent correlation (Pearson’s r = 0.985, p < 2e−16) between the estimated proportions of monocytes, neutrophils and lymphocytes and the actual proportions of these cells obtained via standard complete blood count (CBC) for each sample
Fig. 5
Fig. 5
Cellular contributors to cfDNA in islet transplant recipients. a Deconvolution results for pooled sample of cfDNA from five patients, 1 h after islet transplantation. The patients present a noticeable amount of pancreas-derived cfDNA (typically absent in healthy donors). Cell types contributing <1% were included in “Other”. b Same as a, expressed as absolute levels of cfDNA (genome equivalents per ml plasma). Also shown is the prediction for a healthy individual. c Inferred amount of cfDNA from all three pancreas cell types for three individuals prior to, 1 h after, and 2 h after islet transplantation. Error bars: SD, estimated using Bootstrapping. d Comparison of pancreatic cfDNA estimations using deconvolution (y-axis) to results of targeted insulin promoter methylation assay (x-axis). Pearson’s r = 0.996, p-value = 1.6e−8. e Same as c, using a reference atlas with whole pancreas methylome, instead of purified pancreas cell types. Here, deconvolution fails to identify pancreatic cfDNA in recipient 1
Fig. 6
Fig. 6
Cellular contributors to cfDNA in sepsis. a Predicted cellular contributions are shown for 14 samples of cfDNA from patients with sepsis. Cell types present at <1% were included in “Other”. b Pie charts representing predicted distribution of cell types contributing to cfDNA of two of the sepsis patients. c Predicted levels of hepatocyte cfDNA compared to serum levels of alanine aminotransferase (ALT), a standard biomarker for hepatocyte damage (Pearsons’s r = 0.93, p-value ≤ 4e−7). Error bars: SD, as estimated using Bootstrapping
Fig. 7
Fig. 7
Cellular contributors to cfDNA in cancer. ac Predicted contributions of breast, colon, and lung DNA to the plasma methylome of four patients with colon cancer (CC), four patients with lung cancer (LC), three patients with breast cancer (BRC), and four healthy donors (H). All patients were at advanced stages of disease. d A mix-in experiment. The plasma of a patient with advanced colon cancer was mixed with three healthy plasma samples in varying proportions (detailed in Supplementary Data 1), and the fraction of colon-derived cfDNA was assessed using deconvolution of the methylome. e Identification of prostate-derived cfDNA in published plasma methylomes of patients with prostate cancer before and after treatment. Patients classified as abiraterone acetate (AA) treatment responsive (blue) show a dramatic drop in prostate-derived cfDNA, compared with the AA-resistant patients (red). f Deconvolution of cfDNA methylation predicts cfDNA origin for CUP cancer patients. Shown are the predicted cellular contributors for cfDNA samples from four patients diagnosed with a Cancer of Unknown Primary (CUP). Blood cell types and cells contributing <1% are not shown. For each patient, the location of metastases and the presumed tissue source of cancer according to clinical history are listed. Deconvolution results agreeing with clinical predictions are shown as orange bars. Error bars: SD, as estimated using Bootstrapping

References

    1. Wan JC, et al. Liquid biopsies come of age: towards implementation of circulating tumour DNA. Nat. Rev. Cancer. 2017;17:223–238. doi: 10.1038/nrc.2017.7. - DOI - PubMed
    1. Fan HC, Gu W, Wang J, Blumenfeld YJ, El-Sayed YY, Quake SR. Non-invasive prenatal measurement of the fetal genome. Nature. 2012;487:320–324. doi: 10.1038/nature11251. - DOI - PMC - PubMed
    1. Lo YM, et al. Maternal plasma DNA sequencing reveals the genome-wide genetic and mutational profile of the fetus. Sci. Transl. Med. 2010;2:61ra91. doi: 10.1126/scitranslmed.3001720. - DOI - PubMed
    1. De Vlaminck I, et al. Circulating cell-free DNA enables noninvasive diagnosis of heart transplant rejection. Sci. Transl. Med. 2014;6:241ra277. doi: 10.1126/scitranslmed.3007803. - DOI - PMC - PubMed
    1. De Vlaminck, I et al. Noninvasive monitoring of infection and rejection after lung transplantation. Proc. Natl Acad. Sci. USA 112, 13336–13341 (2015). - PMC - PubMed

Publication types