. 2018 Nov 29;9(1):5073.
doi: 10.1038/s41467-018-07544-9.

Olfactory marker protein (OMP) regulates formation and refinement of the olfactory glomerular map

Affiliations

Olfactory marker protein (OMP) regulates formation and refinement of the olfactory glomerular map

Dinu F Albeanu et al. Nat Commun. .

Abstract

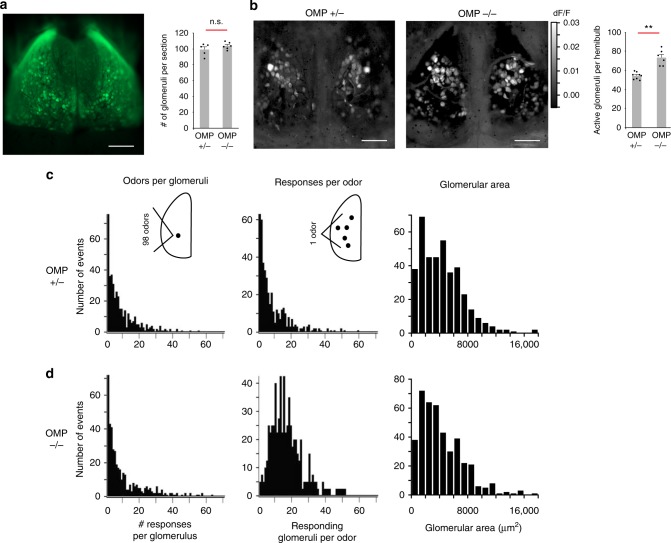
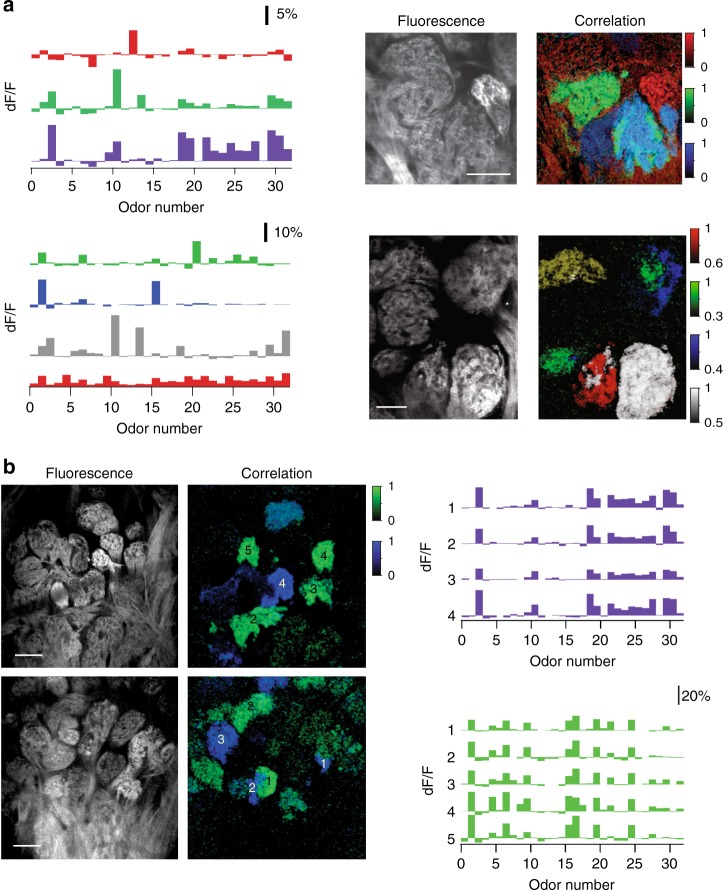
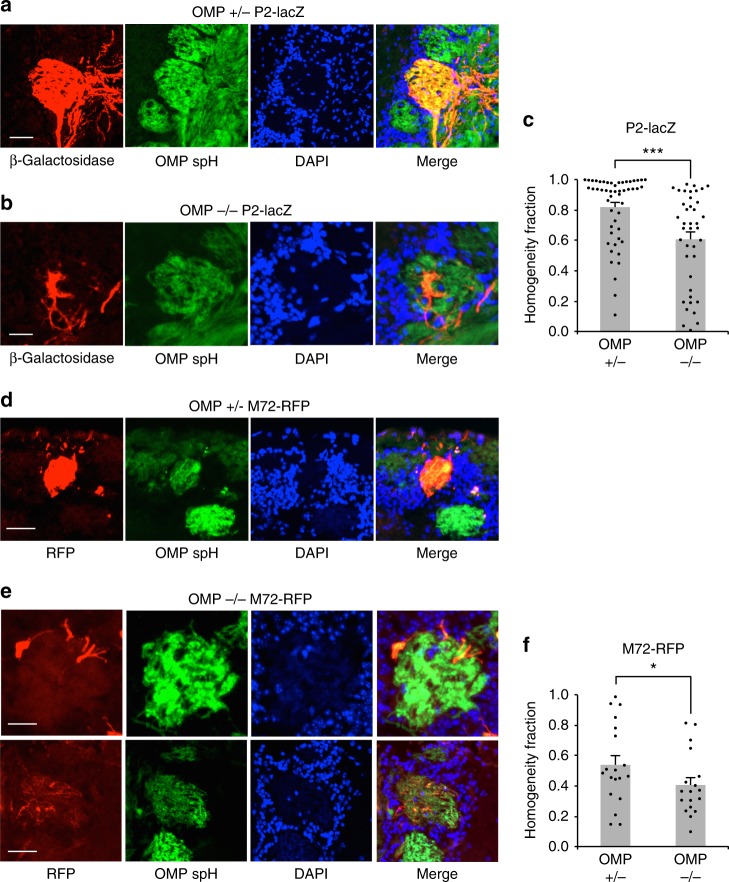
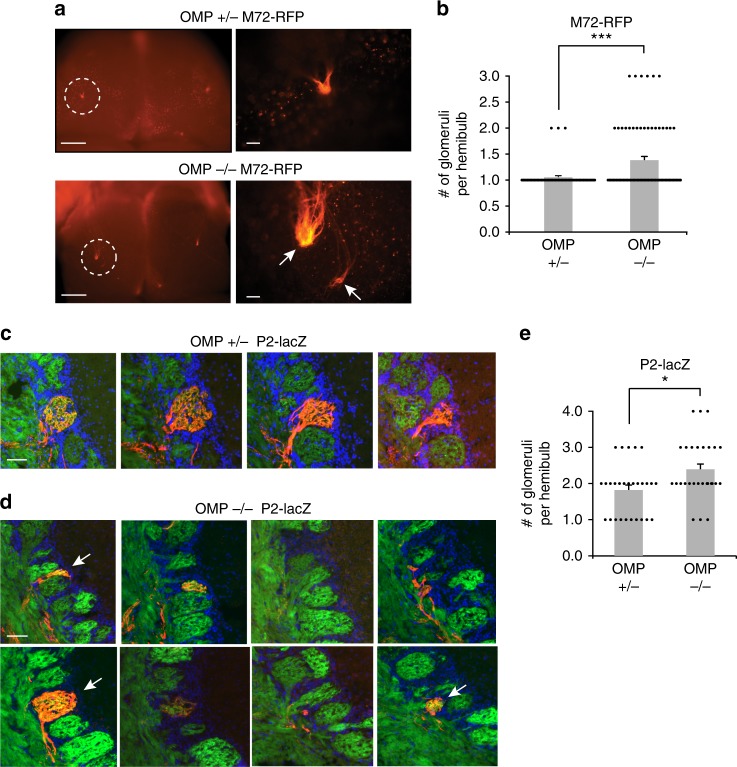
Inputs from olfactory sensory neuron (OSN) axons expressing the same type of odorant receptor (OR) converge in the glomerulus of the main olfactory bulb. A key marker of mature OSNs is olfactory marker protein (OMP), whose deletion has been associated with deficits in OSN signal transduction and odor discrimination. Here, we investigate glomerular odor responses and anatomical architecture in mice in which one or both alleles of OMP are replaced by the fluorescent synaptic activity reporter, synaptopHluorin. Functionally heterogeneous glomeruli, that is, ones with microdomains with distinct odor responses, are rare in OMP+/- mice, but occur frequently in OMP-/- mice. Genetic targeting of single ORs reveals that these microdomains arise from co-innervation of individual glomeruli by OSNs expressing different ORs. This glomerular mistargeting is locally restricted to a few glomerular diameters. Our studies document functional heterogeneity in sensory input within individual glomeruli and uncover its anatomical correlate, revealing an unexpected role for OMP in the formation and refinement of the glomerular map.


Conflict of interest statement

A.C.P. is employed by Cohen Veterans Bioscience, a non-profit public charity research organization. The other authors declare no competing interests.

Figures

Fig. 1
Fig. 1
Absence of OMP alters odor responses, but preserves macro-organization of the OB. a (Left) Widefield view of dorsal surface of an OMP+/– mouse shows labeled glomeruli from the resting fluorescence of spH. (Right) Quantification of the number of glomeruli per coronal section in central sections of the OB. Shown are 99 ± 3.44 glomeruli per coronal section for OMP+/- mice (mean ± SEM, n = 5 slices from 2 mice) and 104 ± 1.8 glomeruli per coronal section for OMP–/– (mean ± SEM, n = 6 slices from 2 mice). b (Left) Maximum projection glomerular odor response maps for exemplar OMP+/– and OMP–/– mice to a panel of 99 odorants. (Right) Average number of responsive glomeruli per hemibulb to the odor panel (Supplementary Table 1). Shown are 53.9 ± 1.3 glomeruli per hemibulb for OMP+/- mice (mean ± SEM, n = 8 hemibulbs) and 72.6 ± 3.3 glomeruli per hemibulb for OMP–/– (mean ± SEM, n = 6 hemibulbs). c, d (Left) Histograms of the number of odors to which a single glomerulus responds. (Center) Histograms of the number of glomeruli activated by an individual odor in the panel. (Right) Histograms of glomerular area in central coronal sections of the OB in OMP+/– and OMP–/– mice. n.s. indicates difference is not statistically significant, **p < 0.005, Kolmogorov–Smirnov test; scale bar, 500 μm
Fig. 2
Fig. 2
Analysis of functional glomerular heterogeneity in OMP–/– glomeruli. a Raw two-photon fluorescence of a glomerulus in an OMP–/– mouse. b, c Example time courses and average responses (dF/F) of the glomerulus in (a) to 4 different stimuli. Colored circles mark regions of interest and correspond to color of traces in (b). Green horizontal line marks stimulus delivery. d (Top) Projection of all pixels in (a) on two principal components (PC1 vs. PC2) reference coordinates. PCA was performed on the odor response spectra of each pixel. (Bottom) Average odor response spectra of three functional clustered identified in glomeruli from (a). Color scale units are correlation coefficients. e Spatial correlograms showing the spatial distribution of the three pixel clusters identified via PCA in (d) within the example glomerulus (a) were obtained by correlating the average response vectors of the identified clusters to the odor responses of individual pixels in the field of view. Numbers mark correlation maps corresponding to each functional cluster in (d). Note that each cluster corresponds to a spatially contiguous area we refer to as a microdomain. f (Left) Cartoon depicting two optical imaging planes (z) within the example glomerulus (a) at two different depths (I and II, 20 µm apart). (Center and Right) RGB color scheme overlays of the correlograms determined as in (e) for the two optical planes sampled within the glomerulus. Blue corresponds to image 1 in (e), green to image 2, red to image 3. g Three spatial microdomains in a second example glomerulus in the OMP–/– mouse. (Left) Average odor response spectra of functional clusters identified via PCA. (Right) Resting fluorescence, single pixel correlograms, and their overlay in an RGB scheme. Color scale units are correlation coefficient. h Summary graph of the average frequency of glomerular heterogeneity recorded in OMP+/– and OMP–/– mice (4.8 ± 2.5%, n = 4 bulbs versus 24.7 ± 6.9%, n = 7 bulbs, p = 0.0058, Mann–Whitney U test; horizontal bars represent the mean, dots individual animals). i Histogram of pairwise odor response similarity between functional domains within the same anatomical glomerulus (red) and between different glomeruli (black) in OMP–/– mice. Results are presented as means ± SEM; **p < 0.001; scale bar, 20 μm
Fig. 3
Fig. 3
Local functional glomerular duplications in OMP–/– mice. a (Left) Example average odor response spectra of PCA-identified functional clusters corresponding to glomerular microdomains from two different fields of view (top vs. bottom). (Right) Corresponding resting fluorescence and overlay of correlograms. Note the presence of functionally homogeneous and heterogeneous glomeruli adjacent to each other. For example, in the lower panel, six anatomically identifiable glomeruli are discernable. The correlograms (Right) indicate that green microdomains are shared between two close-by anatomical glomeruli. White and red microdomains mix within one anatomical glomerulus. The white cluster is also present as a spatial-functional homogeneous adjacent glomerulus. Color scale units are correlation coefficient. Scale bar, 50 μm. b Two partially overlapping example fields of view in one OMP–/– mouse. (Left) Resting glomerular fluorescence. (Center) Correlograms: colors correspond to functionally matched glomeruli or subglomerular microdomains. (Right) Odor response spectra for the green and blue glomeruli. Numbers correspond to the location of the functionally similar glomeruli in the sampled fields of view. Color scale units are correlation coefficient. Scale bar, 80 μm
Fig. 4
Fig. 4
Anatomical glomerular heterogeneity in OMP–/– mice. a Example homogeneous glomerulus in a P2-lacZ OMP+/– mouse. P2-positive OSN axons labeled with β-Gal (red), SpH-positive OSN axons (green) and glomerular outline by DAPI-stained nuclei of juxtaglomerular cells (blue). Note the high overlap between the red and green pixels in the merged image. Scale bar, 50 μm. b Example heterogeneous glomerulus in a P2-lacZ OMP–/– mouse. P2-positive OSN axons labeled with β-Gal (red) do not overlap entirely with SpH-positive OSN axons (green) and only partially fill the glomerulus, outlined by DAPI-stained nuclei of juxtaglomerular cells (blue). Scale bar, 50 μm. c Quantification of glomerular homogeneity (P2-lacZ) in the OMP+/– versus OMP–/– mice. Homogeneity fraction: 0.82 ± 0.03 (mean ± SEM, n = 52 glomeruli) in OMP+/– mice, and 0.61 ± 0.05 (mean ± SEM, n = 40 glomeruli) in OMP–/– animals. Scale bar, 50 μm. d, e Same as (a) and (b) an M72-RFP example glomerulus in the OMP+/– and OMP–/– genetic backgrounds. Scale bar, top 25 μm, bottom 40 μm. f Quantification of glomerular homogeneity in M72-RFP OMP+/– versus OMP–/– mice. Homogeneity fraction: 0.54 ± 0.06 (mean ± SEM, n = 19 glomeruli) in OMP+/– mice, and 0.41 ± 0.05 (mean ± SEM, n = 18 glomeruli) in OMP–/– animals; *p < 0.05, ***p < 0.001, Kolmogorov–Smirnov test
Fig. 5
Fig. 5
Duplicate glomeruli in the OMP–/– mice. a (Left) Whole mount of the OB dorsal surface in a M72-RFP OMP+/– (Top) and OMP–/– (Bottom) mouse with a the M72 glomerulus fluorescently labeled. Scale bar, 500 μm. (Right) Zoom-in of circled region. Note the duplicated glomeruli in the OMP–/– mouse (arrows). Scale bar, 100 μm. b Quantification of duplicate glomeruli in M72-RFP mice for OMP+/– and OMP–/– mice. Shown are 1.05 ± 0.03 glomeruli per hemifield (mean ± SEM, n = 56 hemibulbs) in OMP+/– mice and 1.36 ± 0.07 glomeruli per hemifield (mean ± SEM, n = 76 hemibulbs) in OMP–/– mice. c Serial coronal sections through individual glomeruli in one hemibulb of a P2-lacZ OMP+/– mouse. P2-positive OSN axons are labeled with β-Gal (red), OSN axons with SpH (green), and nuclei of juxtaglomerular cells surrounding glomeruli by DAPI (blue). Scale bar, 50 μm. d Serial coronal sections of a multiple glomeruli in one hemibulb of a P2-lacZ OMP–/– mouse. Arrows indicate distinct glomeruli and fluorescent labels as in (c). Scale bar, 50 μm. e Quantification of duplicate glomeruli in P2-lacZ mice for OMP+/– and OMP–/– mice. Shown are 1.82 ± 0.14 glomeruli per hemifield (mean ± SEM, n = 28 hemibulbs) in OMP+/– mice and 2.39 ± 0.16 glomeruli per hemifield (mean ± SEM, n = 28 hemibulbs) in OMP–/– mice. *P < 0.05, ***p < 0.001, Wilcoxon rank-sum test

References

    1. Duchamp-Viret P, Chaput MA, Duchamp A. Odor response properties of rat olfactory receptor neurons. Science. 1999;284:2171–2174. doi: 10.1126/science.284.5423.2171. - DOI - PubMed
    1. Mombaerts P, et al. Visualizing an olfactory sensory map. Cell. 1996;87:675–686. doi: 10.1016/S0092-8674(00)81387-2. - DOI - PubMed
    1. Ressler KJ, Sullivan SL, Buck LB. Information coding in the olfactory system: evidence for a stereotyped and highly organized epitope map in the olfactory bulb. Cell. 1994;79:1245–1255. doi: 10.1016/0092-8674(94)90015-9. - DOI - PubMed
    1. Vassar R, et al. Topographic organization of sensory projections to the olfactory bulb. Cell. 1994;79:981–991. doi: 10.1016/0092-8674(94)90029-9. - DOI - PubMed
    1. Feinstein P, Mombaerts P. A contextual model for axonal sorting into glomeruli in the mouse olfactory system. Cell. 2004;117:817–831. doi: 10.1016/j.cell.2004.05.011. - DOI - PubMed

Publication types

Substances