

Economic analysis of pharmacist-administered influenza vaccines in Ontario, Canada
- PMID: 30498367
- PMCID: PMC6207261
- DOI: 10.2147/CEOR.S167500
Economic analysis of pharmacist-administered influenza vaccines in Ontario, Canada
Abstract
Objective: The aim of this study was to evaluate the impact of pharmacist administration of influenza vaccine in Ontario on: 1) vaccination-associated costs related to the number of people vaccinated; 2) annual influenza-related outcomes and costs; and 3) change in productivity costs.
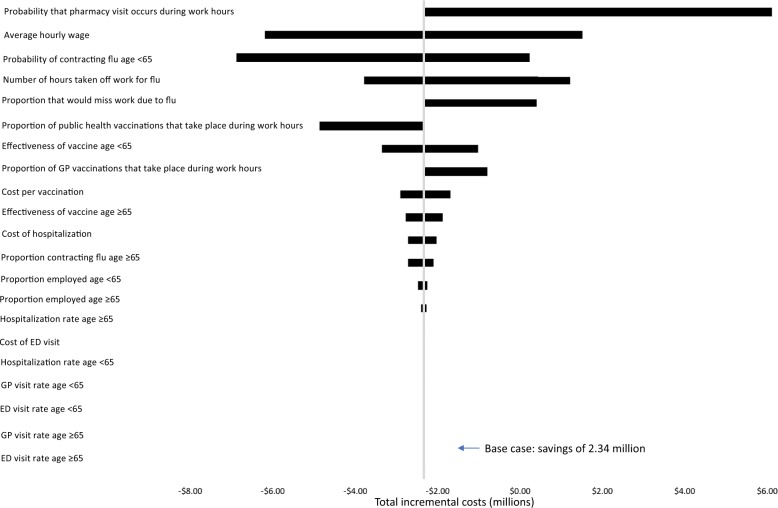
Methods: Using available data for Ontario, the total number of vaccinations given by providers in the 2011/12 influenza season (pre) was compared to the 2013/14 influenza season (post). Vaccine costs and provider fees for administration were assigned for both periods. An economic model was created to estimate the impact of the change in influenza vaccination volume on influenza-related outcomes and on the health care costs associated with treating influenza-related outcomes. Productivity costs due to both time off work due to getting vaccinated and influenza illness were considered. One-way sensitivity analysis was used to assess parameter uncertainty.
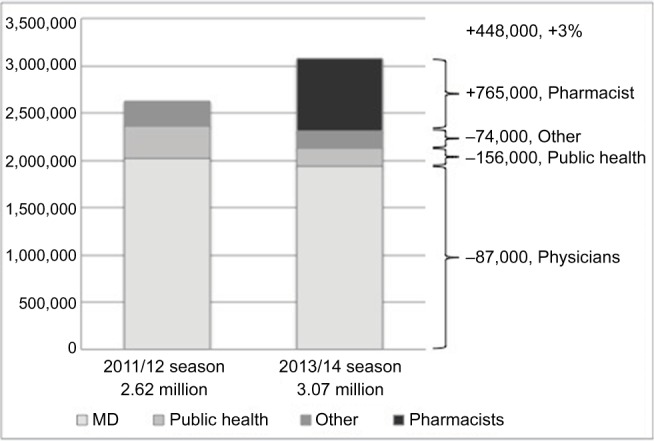
Results: The number of vaccinations received by Ontarians increased by 448,000 (3% of the population), with pharmacists vaccinating approximately 765,000 people/year. The increased cost to the Ontario Ministry of Health and Long-term Care was $6.3 million, while the money saved due to reduced influenza-related outcome costs was $763,158. Productivity losses were reduced by $4.5 million and $3.4 million for the time invested to get vaccinated and time off work due to influenza illness, respectively.
Conclusion: After two influenza seasons, following the introduction of pharmacist-administered influenza vaccinations, there was a net immunization increase of almost 450,000, which potentially saved $2.3 million in direct health care costs and lost productivity in the province.
Keywords: costs; immunization; pharmacist; productivity; universal influenza vaccination.
Conflict of interest statement
Disclosure The results of this study have been presented at the following conferences: O’Reilly D, Blackhouse G, Burns S, et al. Economic analysis of community pharmacists providing influenza vaccination in Ontario. 2016 Canadian Immunization Conference, Ottawa, ON, December 6–8, 2016. (Oral presentation)O’Reilly D, Blackhouse G, Burns S, et al. Economic analysis of pharmacist-administered influenza immunizations in Ontario. CADTH Symposium, Ottawa, ON, April 23–25, 2017. (Oral presentation)Houle SKD, O’Reilly D, Blackhouse G, et al. Economic analysis of community pharmacists providing influenza vaccination in Ontario. Can Pharm J. 2017;150(4):S31. https://www.pharmacists.ca/cpha-ca/assets/File/news-events/Conference/2017/Research/CPJSupplementAb-stractsPosters17.pdf (Published abstract)Houle SKD, O’Reilly D, Blackhouse G, Burns S, et al. Economic analysis of community pharmacists providing influenza vaccination in Ontario. North American Primary Care Research Group Annual Meeting, Montreal, QC, November 17–21, 2017. (Poster)O’Reilly D, Blackhouse G, Burns S, et al. Economic analysis of community pharmacists providing influenza vaccination in Ontario. OPEN 2016 Research Showcase. School of Pharmacy, University of Waterloo. November 7, 2016. http://www.open-pharmacy-research.ca/events/2016-research-showcase/oral-presentations/ JM is employed by the Neighbourhood Pharmacy Association of Canada, which provided funding for this project. The authors report that they have no other conflicts of interest in this work.
Figures
References
-
- Canadian Public Health Agency [webpage on the Internet] Immunize Canada. Ottawa (ON): Immunize Canada; 2017. [Accessed September 6, 2018]. Available from: http://www.immunize.ca/en/diseases-vaccines/influenza.aspx.
-
- Dahrouge S, Devlin R, Hogg B, Russell G, Coyle D, Fergusson D. The Economic Impact of Improvements in Primary Healthcare Performance. Ottawa (ON): Canadian Health Services Research Foundation; 2012.
-
- Statistics Canada [webpage on the Internet] Estimates of population, by age group and sex for July 1, Canada, provinces and territories, annual (persons unless otherwise noted), CANSIM (database) Table 051-0001. Ottawa: Statistics Canada; 2016. [Accessed September 6, 2018]. Available from: http://www5.statcan.gc.ca/cansim/a26?id=510001.
-
- Ontario College of Pharmacists Expanded Scope regulation now in effect. Pharmacy Connection. 2012;19(4):12–21.
-
- Government of Ontario [webpage on the Internet] Progress Report 2014 Health Care. Toronto (ON): Queen’s Printer for Ontario; 2014. [Accessed February 24, 2017]. Available from: http://www.ontario.ca/page/progress-report-2014-health-care.
LinkOut - more resources
Full Text Sources
