. 2018 Nov 15:12:418.
doi: 10.3389/fncel.2018.00418. eCollection 2018.

Differences in Intercellular Communication During Clinical Relapse and Gadolinium-Enhanced MRI in Patients With Relapsing Remitting Multiple Sclerosis: A Study of the Composition of Extracellular Vesicles in Cerebrospinal Fluid

Affiliations

Differences in Intercellular Communication During Clinical Relapse and Gadolinium-Enhanced MRI in Patients With Relapsing Remitting Multiple Sclerosis: A Study of the Composition of Extracellular Vesicles in Cerebrospinal Fluid

Fabiana Geraci et al. Front Cell Neurosci. .

Abstract

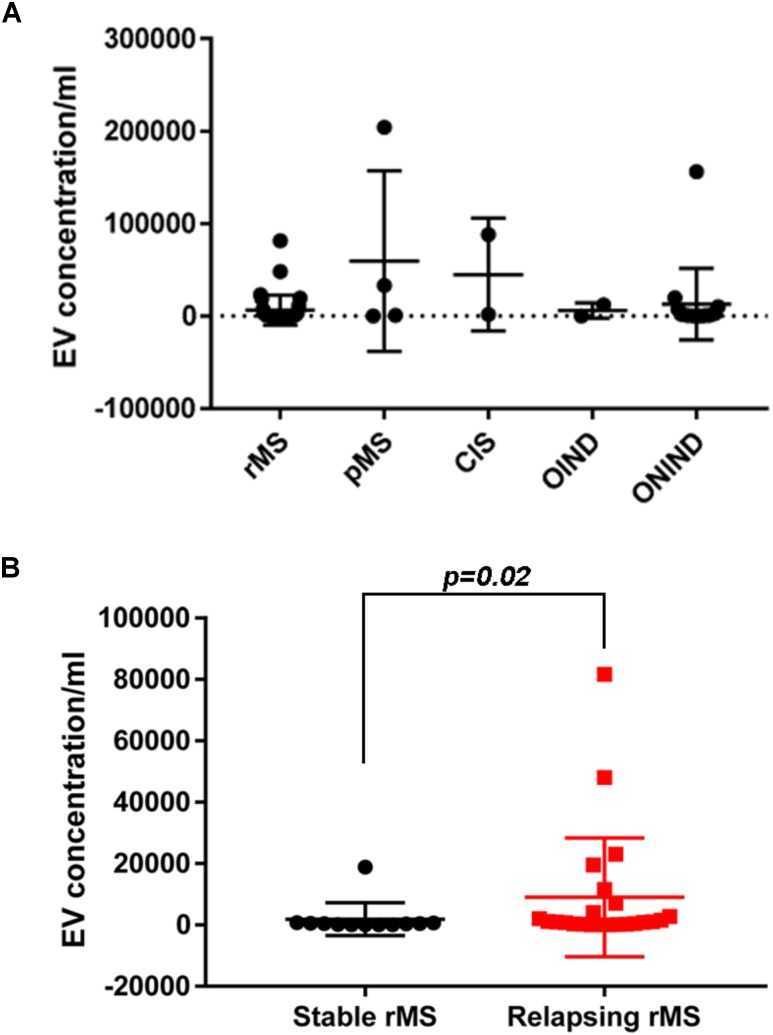
This study was designed based on the hypothesis that changes in both the levels and surface marker expression of extracellular vesicles (EVs) isolated from the cerebrospinal fluid (CSF) may be associated with the clinical form, disease activity, and severity of multiple sclerosis (MS). The analyzes were performed on subjects affected by MS or other neurological disorders. EVs, which were isolated by ultracentrifugation of CSF samples, were characterized by flow cytometry. A panel of fluorescent antibodies was used to identify the EV origin: CD4, CCR3, CCR5, CD19, and CD200, as well as isolectin IB4. The Mann-Whitney U-test and Kruskal-Wallis test were used for statistical analyzes. EVs isolated from the CSF were more abundant in patients with progressive MS and in those with a clinically isolated syndrome than in all the other groups examined. Furthermore, an important change in the number of EVs and in their surface marker expression occurred during active phases of MS [i.e., clinical relapses and the presence of enhancing lesions on magnetic resonance imaging (MRI)]. In particular, the number of CSF-EVs increased in patients affected by MS during clinical relapse; this finding was associated with a decrease in the number of CD19+/CD200+ (naïve B cells) EVs. These markers are expressed by immature and naïve B lymphocytes, and to the best of our knowledge, this double staining has never been associated with MS, but their reduction has been observed in patients with another type of Th1 cell-mediated autoimmune disease. In contrast, the presence of lesions in the brain and spine on gadolinium-enhanced MRI was associated with an increase in the numbers of CCR3+/CCR5+ (subset of CD8 memory T cells), CD4+/CCR3+ (Th2 cells), and CD4+/CCR5+ (Th1 cells) CSF-EVs. Two points are worth emphasizing: (i) the data obtained in this study confirm that CSF-EVs represent a potentially promising tool to identify biomarkers specific for different phases of MS; and (ii) Considering the role of EVs in intercellular communication, our results provide some insights that improve our understanding of the relationships among some of the cell types that are mainly involved in MS pathogenesis (e.g., lymphocytes, glia, and neurons).

Keywords: cerebrospinal fluid; extracellular vesicles; lymphocytes; multiple sclerosis; surface markers.


Figures

FIGURE 1
FIGURE 1
EV concentration in CSF samples from patients with MS and control subjects. (A) Quantitative flow cytometry analysis of EVs in human CSF collected from patients with rMS (n = 35), patients with pMS (n = 4), patients with CIS (n = 2), patients with OIND (n = 2), and patients with ONIND (n = 16). The Kruskal–Wallis statistical test was used to calculate the reported p-values (p = 0.49). Individual dots indicate values for single donors. (B) Quantitative flow cytometry analysis of CSF-EVs collected from patients with rMS in the clinically stable (n = 12) or acute (n = 23) phase of the disease. The Mann–Whitney U-test was used to calculate the reported p-values (p = 0.02). Individual dots indicate the values for single donors.
FIGURE 2
FIGURE 2
No differences in IB4+ CSF-EVs were observed among the examined samples. (A) Flow cytometry analysis of IB4+ CSF-EVs collected from patients with rMS (n = 25), patients with pMS (n = 3), patients with pMS (n = 2), patients with OIND (n = 2), and patients with ONIND (n = 14). The Kruskal–Wallis statistical test was used to calculate the reported p-values (p = 0.83). Individual dots indicate values for single donors. (B) Quantitative flow cytometry analysis of CSF-EVs collected from patients with rMS in the clinically stable (n = 8) or acute (n = 17) phase of the disease. The Mann–Whitney U-test was used to calculate the reported p-values (p = 0.02). Individual dots indicate the values for single donors.
FIGURE 3
FIGURE 3
Differences in extracellular vesicles between patients with rMS in the course of a clinical relapse and stable phase. Flow cytometry analysis of extracellular vesicles stained for the selected CDs in CSF collected from patients with rMS in the clinically stable (n = 5) or acute (n = 18) phase of the disease. The Mann–Whitney U-test was used to calculate the reported p-values: (A) CD4 (p = 0.20), (B) CCR3 (p = 0.40), (C) CCR5 (p = 0.09), (D) CD4/CCR3 (p = 0.59), (E) CD4/CCR5 (p = 0.86), (F) CCR3/CCR5 (p = 0.86), (G) CD200 (p = 0.64), (H) CD19 (p = 0.48), and (I) CD19/CD200 (p = 0.03). Individual dots indicate the values for single donors.
FIGURE 4
FIGURE 4
Differences in extracellular vesicles between patients with rMS in the course of a neuroradiological relapse and the stable phase. Flow cytometry analysis of extracellular vesicles stained for the selected CDs in CSF collected from patients with rMS in the neuroradiologically stable (n = 10) or active (n = 13) phase of the disease. The Mann–Whitney U-test was used to calculate the reported p-values: (A) CD4 (p = 0.52), (B) CCR3 (p = 0.004), (C) CCR5 (p = 0.042), (D) CD4/CCR3 (p = 0.018), (E) CD4/CCR5 (p = 0.004), (F) CCR3/CCR5 (p = 0.004), (G) CD200 (p = 0.83), (H) CD19 (p = 0.08), (I) CD19/CD200 (p > 1). Individual dots indicate the values for single donors.
FIGURE 5
FIGURE 5
Levels of CD4+/CCR5+ CSF-EVs were increased in patients with rMS presenting with gadolinium-positive lesions. Flow cytometry analysis of CD4+/CCR3+ and CD4+/CCR5+ CSF-EVs in patients with rMS in the neuroradiologically stable (n = 10) or active (n = 13) phase of the disease. The Mann–Whitney U-test was used to calculate the reported p-values between gadolinium-positive patients with rMS (p = 0.13). Individual dots indicate the values for single donors.
FIGURE 6
FIGURE 6
Significant differences in CSF-EV biomarkers among patients with rMS presenting different clinical and radiological statuses. Findings are summarized. The indicated biomarkers were different between comparison groups. The arrow preceding the name of each biomarker indicates an increase or decrease in the CSF-EV concentration in rMS groups, whereas the lack of an arrow indicates an invariant value. Solid arrows indicate statistically significant differences, and dotted arrows indicate non-significant differences.

References

    1. Abels E. R., Breakefield X. O. (2016). Introduction to extracellular vesicles: biogenesis, RNA cargo selection, content, release, and uptake. Cell. Mol. Neurobiol. 36 301–312. 10.1007/s10571-016-0366-z - DOI - PMC - PubMed
    1. Babbe H., Roers A., Waisman A., Lassmann H., Goebels N., Hohlfeld R., et al. (2000). Clonal expansions of CD8( + ) T cells dominate the T cell infiltrate in active multiple sclerosis lesions as shown by micromanipulation and single cell polymerase chain reaction. J. Exp. Med. 192 393–404. 10.1084/jem.192.3.393 - DOI - PMC - PubMed
    1. Baker D., Marta M., Pryce G., Giovannoni G., Schmierer K. (2017). Memory B cells are major targets for effective immunotherapy in relapsing multiple sclerosis. EBioMedicine 16 41–50. 10.1016/j.ebiom.2017.01.042 - DOI - PMC - PubMed
    1. Balashov K. E., Rottman J. B., Weiner H. L., Hancock W. W. (1999). CCR5( + ) and CXCR3( + ) T cells are increased in multiple sclerosis and their ligands MIP-1alpha and IP-10 are expressed in demyelinating brain lesions. Proc. Natl. Acad. Sci. U. S. A. 96 6873–6878. 10.1073/pnas.96.12.6873 - DOI - PMC - PubMed
    1. Barclay A. N., Wright G. J., Brooke G., Brown M. H. (2002). CD200 and membrane protein interactions in the control of myeloid cells. Trends Immunol. 23 285–290. 10.1016/S1471-4906(02)02223-8 - DOI - PubMed