

Three-Dimensional Probabilistic Maps of Mesial Temporal Lobe Structures in Children and Adolescents' Brains
- PMID: 30498435
- PMCID: PMC6249374
- DOI: 10.3389/fnana.2018.00098
Three-Dimensional Probabilistic Maps of Mesial Temporal Lobe Structures in Children and Adolescents' Brains
Abstract
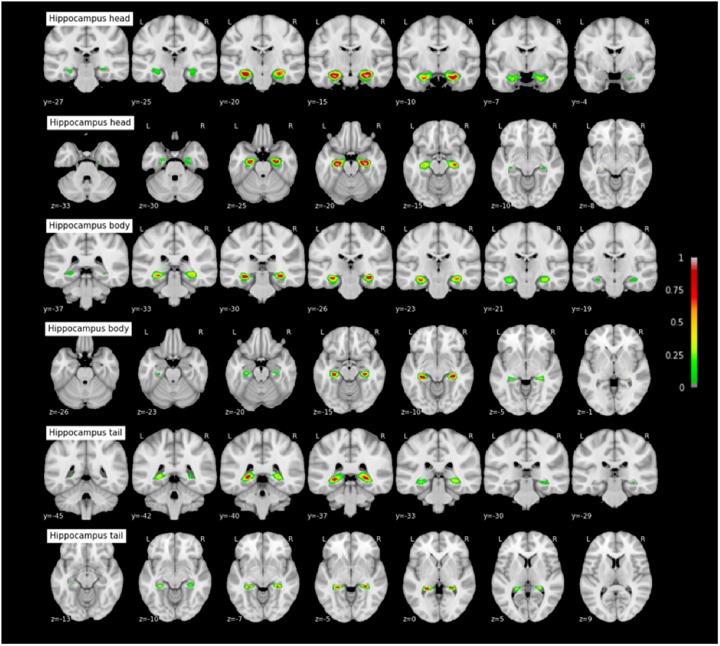
The hippocampus and the adjacent perirhinal, entorhinal, temporopolar, and parahippocampal cortices are interconnected in a hierarchical MTL system crucial for memory processes. A probabilistic description of the anatomical location and spatial variability of MTL cortices in the child and adolescent brain would help to assess structure-function relationships. The rhinal sulcus (RS) and the collateral sulcus (CS) that border MTL cortices and influence their morphology have never been described in these populations. In this study, we identified the aforementioned structures on magnetic resonance images of 38 healthy subjects aged 7-17 years old. Relative to sulcal morphometry in the MTL, we showed RS-CS conformation is an additional factor of variability in the MTL that is not explained by other variables such as age, sex and brain volume; with an innovative method using permutation testing of the extrema of structures of interest, we showed that RS-SC conformation was not associated with differences of location of MTL sulci. Relative to probabilistic maps, we offered for the first time a systematic mapping of MTL structures in children and adolescent, mapping all the structures of the MTL system while taking sulcal morphology into account. Our results, with the probabilistic maps described here being freely available for download, will help to understand the anatomy of this region and help functional and clinical studies to accurately test structure-function hypotheses in the MTL during development. Free access to MTL pediatric atlas: http://neurovault.org/collections/2381/.
Keywords: development; hippocampus; medial temporal lobe; parahippocampal gyrus; probabilistic maps.
Figures


Similar articles
-
Three-dimensional probability maps of the rhinal and the collateral sulci in the human brain.Brain Struct Funct. 2016 Nov;221(8):4235-4255. doi: 10.1007/s00429-016-1189-x. Epub 2016 May 20. Brain Struct Funct. 2016. PMID: 27206426
-
Volumetry of temporopolar, perirhinal, entorhinal and parahippocampal cortex from high-resolution MR images: considering the variability of the collateral sulcus.Cereb Cortex. 2002 Dec;12(12):1342-53. doi: 10.1093/cercor/12.12.1342. Cereb Cortex. 2002. PMID: 12427684
-
Encoding of novel picture pairs activates the perirhinal cortex: an fMRI study.Hippocampus. 2003;13(1):67-80. doi: 10.1002/hipo.10049. Hippocampus. 2003. PMID: 12625459
-
[Functional neuroimaging studies of episodic memory--functional dissociation in the medial temporal lobe structures].Brain Nerve. 2008 Jul;60(7):833-44. Brain Nerve. 2008. PMID: 18646623 Review. Japanese.
-
Object memory and perception in the medial temporal lobe: an alternative approach.Curr Opin Neurobiol. 2005 Dec;15(6):730-7. doi: 10.1016/j.conb.2005.10.014. Epub 2005 Nov 3. Curr Opin Neurobiol. 2005. PMID: 16271459 Review.
Cited by
-
Spectral-based thickness profiling of the corpus callosum enhances anomaly detection in fetal alcohol spectrum disorders.Front Neurosci. 2023 Nov 6;17:1289013. doi: 10.3389/fnins.2023.1289013. eCollection 2023. Front Neurosci. 2023. PMID: 38027471 Free PMC article.
-
The Architect Who Lost the Ability to Imagine: The Cerebral Basis of Visual Imagery.Brain Sci. 2020 Jan 21;10(2):59. doi: 10.3390/brainsci10020059. Brain Sci. 2020. PMID: 31972965 Free PMC article.
-
Pattern of Deep Grey Matter Undersizing Boosts MRI-Based Diagnostic Classifiers in Fetal Alcohol Spectrum Disorders.Hum Brain Mapp. 2025 Jun 1;46(8):e70233. doi: 10.1002/hbm.70233. Hum Brain Mapp. 2025. PMID: 40387267 Free PMC article.
-
FMRI correlates of autobiographical memory: Comparing silent retrieval with narrated retrieval.Neuropsychologia. 2024 Apr 15;196:108842. doi: 10.1016/j.neuropsychologia.2024.108842. Epub 2024 Feb 28. Neuropsychologia. 2024. PMID: 38428520 Free PMC article.
-
Enhancing fetal alcohol spectrum disorders diagnosis with a classifier based on the intracerebellar gradient of volumetric undersizing.Hum Brain Mapp. 2023 Aug 1;44(11):4321-4336. doi: 10.1002/hbm.26348. Epub 2023 May 20. Hum Brain Mapp. 2023. PMID: 37209313 Free PMC article.
References
LinkOut - more resources
Full Text Sources
Molecular Biology Databases