

Developmental Changes in Number Personification by Elementary School Children
- PMID: 30498466
- PMCID: PMC6249874
- DOI: 10.3389/fpsyg.2018.02214
Developmental Changes in Number Personification by Elementary School Children
Abstract
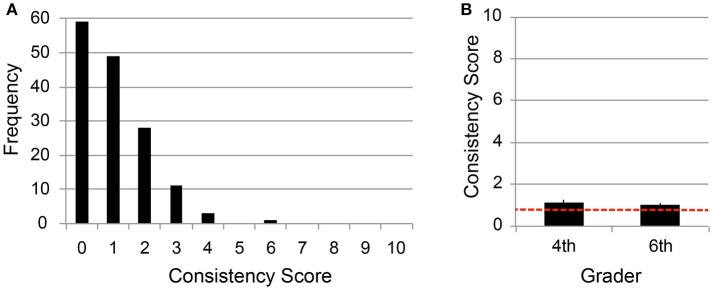
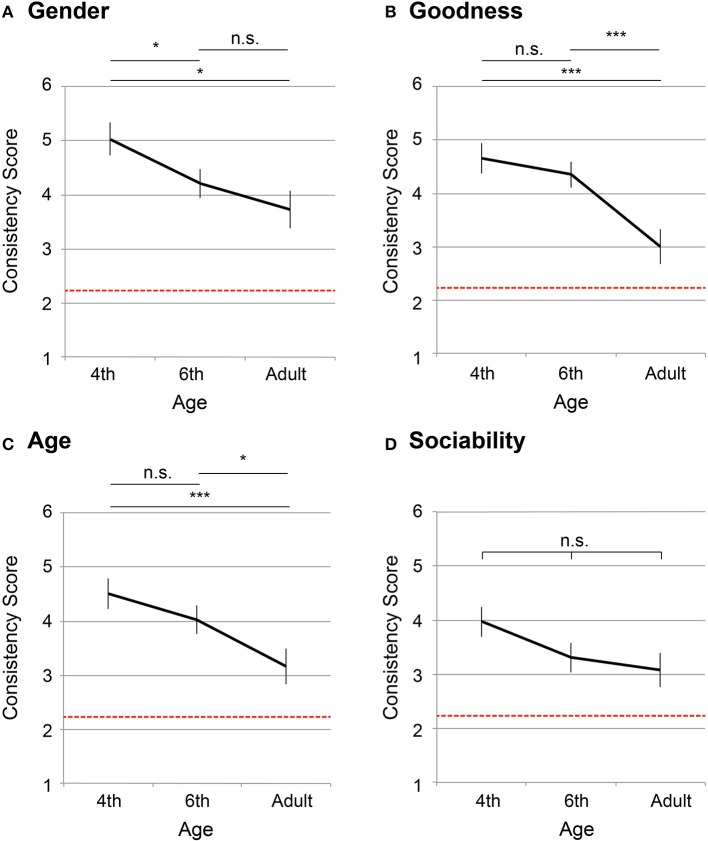
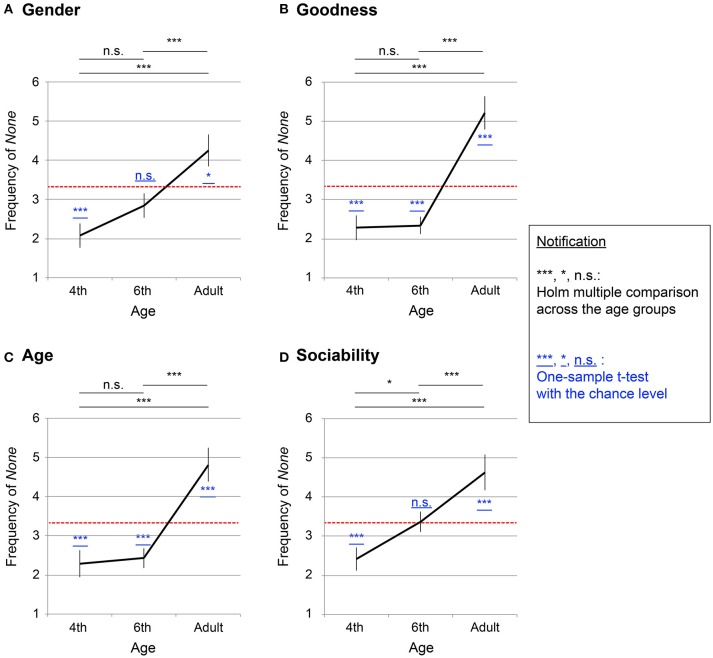
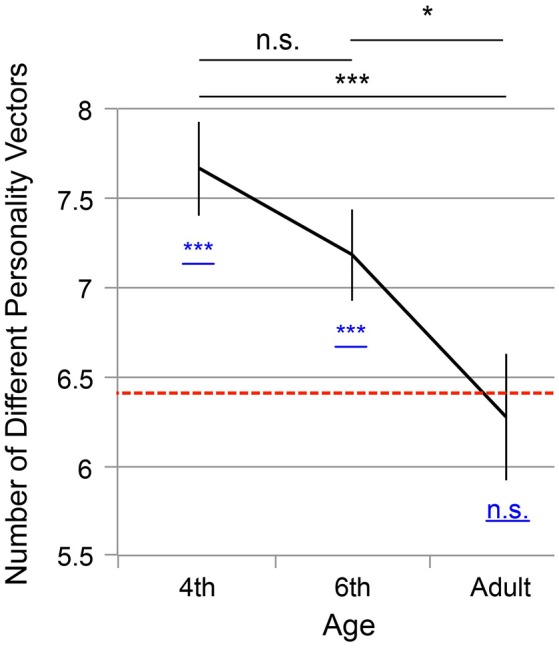
Children often personify non-living objects, such as puppets and stars. This attribution is considered a healthy phenomenon, which can simulate social exchange and enhance children's understanding of social relationships. In this study, we considered that the tendency of children to engage in personification could potentially be observed in abstract entities, such as numbers. We hypothesized that children tend to attribute personalities to numbers, which diminishes during the course of development. By consulting the methodology to measure ordinal linguistic personification (OLP), which is a type of synesthesia, we quantified the frequency with which child and adult populations engage in number personification. Questionnaires were completed by 151 non-synesthetic children (9-12 years old) and 55 non-synesthetic adults. Children showed a higher tendency than adults to engage in number personification, with respect to temporal consistency and the frequency of choosing meaningful answers. Additionally, children tended to assign unique and exclusive descriptions to each number from zero to nine. By synthesizing the series of analyses, we revealed the process in which number personification diminishes throughout development. In the discussion, we examined the possibility that number personification serves as a discrimination clue to aid children's comprehension of the relationships between numbers.
Keywords: development; elementary school children; ordinal linguistic personification; personification; synesthesia.
Figures
Similar articles
-
Ordinal linguistic personification as a variant of synesthesia.J Cogn Neurosci. 2007 Apr;19(4):694-703. doi: 10.1162/jocn.2007.19.4.694. J Cogn Neurosci. 2007. PMID: 17381259
-
Théodore Flournoy on synesthetic personification.J Hist Neurosci. 2017 Jan-Mar;26(1):1-14. doi: 10.1080/0964704X.2015.1077542. Epub 2015 Nov 13. J Hist Neurosci. 2017. PMID: 26566190
-
Torturing personification of chronic pain among torture survivors.J Psychosom Res. 2017 Aug;99:155-161. doi: 10.1016/j.jpsychores.2017.06.016. Epub 2017 Jun 20. J Psychosom Res. 2017. PMID: 28712422
-
A developmental intergroup theory of social stereotypes and prejudice.Adv Child Dev Behav. 2006;34:39-89. doi: 10.1016/s0065-2407(06)80004-2. Adv Child Dev Behav. 2006. PMID: 17120802 Review.
-
Young children's naive theory of biology.Cognition. 1994 Apr-Jun;50(1-3):171-88. doi: 10.1016/0010-0277(94)90027-2. Cognition. 1994. PMID: 8039360 Review.
References
-
- Baron-Cohen S. (1996). Is there a normal phase of synaesthesia in development? Psyche 2, 2–27.
-
- Bills C. (2003). Metaphor in young children's mental calculation, in Proceedings of the Third Conference of the European Society for Research in Mathematics Education (Bellaria: ).
LinkOut - more resources
Full Text Sources